. 2021 Mar 26;12(1):1914.
doi: 10.1038/s41467-021-22242-9.

Host-derived lipids orchestrate pulmonary γδ T cell response to provide early protection against influenza virus infection

Affiliations

Host-derived lipids orchestrate pulmonary γδ T cell response to provide early protection against influenza virus infection

Xiaohui Wang et al. Nat Commun. .

Abstract

Innate immunity is important for host defense by eliciting rapid anti-viral responses and bridging adaptive immunity. Here, we show that endogenous lipids released from virus-infected host cells activate lung γδ T cells to produce interleukin 17 A (IL-17A) for early protection against H1N1 influenza infection. During infection, the lung γδ T cell pool is constantly supplemented by thymic output, with recent emigrants infiltrating into the lung parenchyma and airway to acquire tissue-resident feature. Single-cell studies identify IL-17A-producing γδ T (Tγδ17) cells with a phenotype of TCRγδhiCD3hiAQP3hiCXCR6hi in both infected mice and patients with pneumonia. Mechanistically, host cell-released lipids during viral infection are presented by lung infiltrating CD1d+ B-1a cells to activate IL-17A production in γδ T cells via γδTCR-mediated IRF4-dependent transcription. Reduced IL-17A production in γδ T cells is detected in mice either lacking B-1a cells or with ablated CD1d in B cells. Our findings identify a local host-immune crosstalk and define important cellular and molecular mediators for early innate defense against lung viral infection.


Conflict of interest statement

The authors declare no competing interests.

Figures
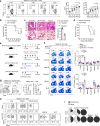
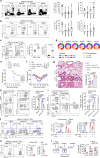
Fig. 1
Fig. 1. PdmH1N1 infection induces infiltration of thymus-derived γδ T cells into lung.
a Representative plots (left) and frequency and number (right) of γδ T cells in lungs of pdmH1N1-infected mice (n = 9). b, c Mice at 1 dpi were i.v. transferred with or without 2 × 106 γδ T cells purified from mice at 4 dpi. b Kaplan–Meier survival rate (n = 9, 10). c Representative hematoxylin and eosin (H&E) histology (left) and scoring (right) of lungs from mice at 5 dpi (n = 3). Images are at original magnification ×200. Scale bar, 40 μm. d Kaplan–Meier survival rate of mice with i.p. injected 200 μg of anti-TCRγδ or control antibodies 3 days before infection (n = 10). e Schema of FTY720 injection (f) and thymectomy (ThX) surgery (g). f Flow cytometry plots (left) and cumulative data (right) showing frequencies and numbers of CD3+TCRγδ+ cells in gated live singlets from the indicated organs (n = 3, 4, 4). MedLN mediastinal lymph nodes, PleuralC pleural cavity, MLN mesenteric lymph nodes. g Mice received ThX or mock surgery 1 day before infection (n = 5). Representative plots (left) and cumulative data (right) showing the frequencies and numbers of CD3+TCRγδ+ cells from lungs at 4 dpi. h, i Mock-infected and pdmH1N1-infected mice at 5 dpi were i.v. injected with 40 μg of FITC-conjugated antibody to CD45 10 min before they were killed. Mice were perfused with PBS and tissues were harvested and analysed. Since MedLN is only detectable from 2 dpi onwards, and γδ T cells are only detectable in BLF of infected mice, analysis of γδ T cells in MedLN and BLF was conducted only with infected mice. Representative plots (h) and frequency pie charts (i) showing circulating γδ T (CD45+) or parenchyma-associated γδ T cells (CD45) in gated CD3+TCRγδ+ cells (n = 5). Data are combined from two or three independent experiments and presented as mean ± SEM. P values were determined using two-tailed unpaired Student’s t-test (c, g, h), Gehan-Breslow-Wilcoxon Test (b, d) or one-way ANOVA (a, f). Source data are included in Source Data file.
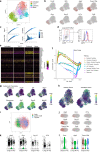
Fig. 2
Fig. 2. Lung γδ T cells protect against pdmH1N1 by producing IL-17A.
a Representative plots showing IL-17A+ cells (left) and cumulative data (right) showing frequencies of IL-17A+ γδ T cells in IL-17A+ population (n = 10) and cell numbers of γδ T cells (n = 10, 6, 6, 10) at 5 dpi. b Plots (left) and cumulative data (right) showing IL-17A+ γδ T cells at 5 dpi (n = 10, 6, 6, 10). c Plots (left) and cumulative data (right) showing IL-17A+ γδ T cells at 5 dpi (n = 10). d Flow cytometry analysis of Vγ chain usage and IL-17A expression by γδ T cell subtypes (n = 6). e–g PdmH1N1-infected Il17a−/− mice at 1 dpi were i.v. transferred with 2 × 106 γδ T cells purified from infected wild-type (WT) or Il17a−/− mice at 4 dpi. Kaplan–Meier survival rate (e) and body weight (f) were monitored (n = 14, 12, 12, 11). g H&E histology (left) and scoring (right) of lungs at 5 dpi (n = 3). Scale bar, 40 μm. h, i Mice at 5 dpi were i.v. injected with 40 μg of FITC-anti-CD45 antibody 10 min before killed and perfused (n = 5). h Plots (left) and cumulative data (right) showing lung circulating (CD45+) and parenchyma-associated (CD45) IL-17A+ γδ T cells. i Plots (left) and cumulative data (right) showing frequencies of CD69+CD103+ cells. j Mice received an i.p. injection of 1 μg of PTX immediately after infection. At 4 dpi, mice were injected with FITC-anti-CD45 10 min before they were killed and analyzed (n = 5). k Mice received ThX or Mock-ThX 1 day before infection (n = 5). Plots (left) and cumulative data (right) showing IL-17A+ γδ T cells at 4 dpi. l Schema of parabiosis (left) and chimerism of Tγδ17 cells (right) (n = 8, 6). Data are combined from two or three independent experiments and presented as mean ± SEM. P values were determined using two-tailed unpaired Student’s t-test (c, h–l), Gehan-Breslow-Wilcoxon Test (e), one-way ANOVA (a, b, g), or two-way ANOVA (f). Source data are included in Source Data file.
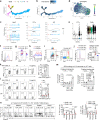
Fig. 3
Fig. 3. Lung Tγδ17 cells have a distinct transcriptome indicative of functional maturity.
a Sorting-purified single γδ T cells from lungs at 4 dpi were subjected to scRNA-seq. UMAP clustering following dimension reduction based on highly variable genes across the 7863 single cells recovered revealed the formation of 4 primary clusters of distinct cell types that were then assigned identifiers based on their expression profiles. b, c Visualization of the expression profiles for key genes previously reported to be associated with Tγδ17 in a. d Representative flow cytometric plots showing expression of AQP3 and IL-17A in gated CD3+TCRγδ+ cells from pdmH1N1-infected lungs at 4 dpi. e Heatmap visualization of the expression patterns of the most varied genes in each cluster across each cell in the cluster. These highly varied genes were used to help annotate the clusters. f Representative GSEA results generated using distinct gene list databases (KEGG, Hallmark, Reactome) as visualized through UMAP confirmed that the substantial heterogeneity observed between the γδ T clusters was driven by significant differences in gene expression along unique biological pathways/processes. Eight significantly variant pathways between the activated and Tγδ17 clusters are shown here as these 2 clusters are highly separated within the UMAP space and in GSEA analysis. g, h UMAP plots show the expression profiles of genes associated with Tγδ17 in a. i Correlation analysis of scRNA-seq data with previously published sequencing of Tγδ17 cells (GSE123400) as shown visually through UMAP following canonical correlation analysis. j UMAP visualization of the expression levels of prominent genes associated with Tγδ17 cells. k, l Violin plots of the expression profiles of markers associated with Tγδ17 in i.
Fig. 4
Fig. 4. The γδTCR-IRF4 axis regulates IL-17A production in lung γδ T cells.
a, b Trajectory map generated using DDTree reduction as implemented through Monocle on a list of 1224 genes with detectable expression and significant dispersion within the Tγδ17 subset. c Pseudotime mapping of gene expression levels within the Tγδ17 subset. d UMAP visualization of IRF4 targeted genes that enrich in the Tγδ17 subset. e Violin plots of the gene expression of Il17a and Cd3g separated by the projected cell state demonstrates that state 4, which has progressed the furthest along pseudotime, is composed of cells that highly express those 2 genes. f IRF4 expression in γδ T cells in mouse lungs at 5 dpi. Shaded histograms depict staining by isotype control antibody. g Representative plot with adjunct histograms gated on lung CD3+ live singlets at 5 dpi. h Mouse γδ T cells cells (2 × 106/mL) were stimulated with soluble anti-CD3/CD28 beads (5 μg/mL). Kinetic diagrams showing the merged calcium mobilization in TCRγδhi and TCRγδlow cells. i Plots with adjunct histograms gated on CD3+ (left) or CD3+ TCRγδ+ (right) live singlets of human PBMCs. j IRF4 expression in γδ T cells from human PBMCs. Mean fluorescent intensity, MFI (n = 6). k, l Expression of IRF4 (k) and IL-17A (l) on day 3 of purified γδ T cells from WT or Irf4−/− mice cultured with plate-bound 1 μg/mL of anti-CD28 and various concentrations of anti-CD3ε (n = 3). m γδ T cells were stimulated with 1 μg/mL of anti-CD28 and 1.5 or 5 μg/mL of anti-CD3ε. ChIP quantification of IRF4 binding to the Il17a promoter was performed using quantitative PCR (n = 3). n IL-17A production in WT and Irf4−/− bone marrow chimera were analysed at 5 dpi (n = 6). Data are combined from two or three independent experiments and represented as mean ± SEM. P-values were determined using two-tailed unpaired Student’s t-test (j, l, m, n) or one-way ANOVA (k). Source data are included in Source Data file.
Fig. 5
Fig. 5. Infection-induced endogenous lipids promote γδ T IL-17A production.
a–e LC-MS/MS assessment of CL species in BLF from infected mice at 5 dpi (n = 5). a CL elution profile. b Abundance of identified CLs with various carbon chain length and double-bond components. Circle sizes correspond to abundance of chromatographic peak areas of CLs among identified CL species. c Phosphatidyl (PA) composition in CLs. Bars represent mean profile abundance of each PA in all identified subunits of CL molecules. d The double-bond distribution in CLs. Bars represent the mean profile abundance of total double-bond counts in all identified CL species. e Relative abundance of CL species normalized to internal standard CL(14:0/14:0/14:0/14:0) (n = 5). f CL in BLF of LCMV-clone13-infected mice at 7 dpi assessed by fluorometric assay (n = 6). g–k MDCK cells were infected, treated with LPS (10 μg/mL) or hypoxic environment (1% O2/5% CO2) for 24 h. g Content of CL (n = 5). h Transmission electron microscopy (TEM) examination. Mitochondria (arrowheads), vacuole formation (double arrows), filamentous particle formation and viral particles (arrows). i ATP in supernatant assessed using Cell-Glo ATP assay (n = 6). j, k MitoTracker Green and MitoSOX red mitochondrial superoxide indicator (j) or JC-1 dye (k) were used for assessing production of superoxide by mitochondria (j) or mitochondrial depolarization (k) (n = 5). l Mice at 1 dpi were i.p. injected with CL (100 μg/kg) and analysed at 5 dpi (n = 3). m Mice were i.v. given 500 μg of anti-CD1d antibody at 1 dpi and analysed at 4 dpi (n = 3, 5). n Schema of antibiotics treatment in o and p (n = 10). o Bacteria load in stool and BLF. p Frequency of IL-17A+ γδ T (left) and number of γδ T cells (right) in lungs. Data are combined from two or three independent experiments and represented as mean ± SEM. P values were determined using two-tailed unpaired Student’s t-test (e, f, l, m, o, p) or one-way ANOVA (g, i, j, k). Source data are included in Source Data file.
Fig. 6
Fig. 6. γδ T IL-17A production requires CD1d-dependent antigen presentation.
a Confocal immunofluorescence microscopy of lungs from pdmH1N1-infected mice at 3 dpi, stained for B220 (green), CD43 (red), TCRγδ (purple), and DAPI (blue). Outlined areas (left row) are enlarged 10× at right. Scale bar, 50 μm. b Mice at 1 dpi were i.v. injected with 5 × 105 CL-preloaded B-1a cells and analysed by flow cytometry at 5 dpi. Flow cytometry plots (left) and cumulative data (right) showing frequency of IL-17A+ cells in gated lung CD3+TCRγδ+ cells (n = 4). c Schema of B-1a cell depletion. Mice were infected with pdmH1N1 and analysed at 4 dpi. Representative flow cytometry plots (left) and cumulative data (right) showing frequencies of IL-17A+ cells in gated lung CD3+ TCRγδ+ cells (n = 5, 4). d CD19-deficient (Cd19−/−) and WT mice were infected with pdmH1N1 and analysed at 5 dpi. Representative flow cytometry plots (left) and cumulative data (right) showing frequencies of IL-17A+ cells in gated lung CD3+TCRγδ+ cells (n = 5). e CD1d1+/+CD19Cre/+ and control CD1d1f/fCD19Cre/+ mice were infected with pdmH1N1 and analysed at 5 dpi. Representative flow cytometry plots (left) and cumulative data (right) showing frequencies of IL-17A+ cells in gated lung CD3+TCRγδ+ cells (n = 7). f Purified γδ T cells (1 × 105/well) were cultured 1:4 with B-1a cells from naïve C57BL/6 mice with or without CL, and with 10 μg/mL anti-CD1d blocking antibody or isotype control antibody for 3 days. IL-17A production in γδ T cells was determined by flow cytometry. Representative flow cytometry plots (left) and cumulative data (right) showing frequency of IL-17A+ cells in gated γδ T cells (n = 3). Data are combined from two or three independent experiments and are represented as mean ± SEM. P-values were determined using two-tailed unpaired Student’s t-test (be) or one-way ANOVA (f). Source data are included in Source Data file.
Fig. 7
Fig. 7. Correlations between human lung γδ T cells and pneumonia severity.
a Representative plots (left) and cumulative data (right) showing prevalence of Vγ9Vδ2 cells in Blood (n = 18) and BLF (n = 57, paired samples n = 10) of pneumonia patients. Left: P-values calculated by Mann–Whitney U test; Right: p-values calculated by Wilcoxon matched-pairs signed rank test. Data are represented as mean ± SD. b Prevalence of Vγ9Vδ2 cells in patients diagnosed as moderate (n = 41) and severe (n = 16) pneumonia. P-values calculated by Mann–Whitney U test. Data are represented as mean ± SD. c, d Gating strategy of B-1 cells in BLF (c) and PBMC (d) of pneumonia patients. e Prevalence of B-1 cells in Blood (n = 25) and BLF (n = 66, paired samples n = 7) of pneumonia patients. Left: P-values calculated by Mann–Whitney U test; right: P-values calculated by Wilcoxon matched-pairs signed rank test. Data are represented as mean ± SD. f CD1d expression on B-1 and B-2 cells in BLF of pneumonia patients (n = 5). Two-tailed unpaired Student’s t-test. g Immunohistochemical staining of Influenza A Virus nucleoprotein (NP) in the lung tissues from influenza-infetced pneumonia patient. Scale bar, 50 μm. h Lung tissues of influenza-infected pneumonia patient were fixed and subjected to TEM examination. Mitochondria (arrowheads) were identified in the images. Scale bar, 200 nm. i Content of CL in BLF of patients diagnosed as moderate (n = 37) and severe (n = 23) pneumonia was assessed by fluorometric assay. P-values calculated by Mann–Whitney U test. Data are represented as mean ± SD. j UMAP clustering of human γδ T cells present in the BLF of pneumonia patients. k Heatmap of highly variable genes in each cluster. l UMAP clustering using genes found to be variably expressed in mouse γδ T cells demonstrates that these three clusters observed include a significant degree of conservation between mouse model and human disease. m UMAP visualization of the expression profiles for key genes. n Pseudotime trajectory analysis of genes in Tγδ17 cluster demonstrates that IRF4 and IL23R expression are tightly correlated, while RORC and BATF are not appreciably linked. Source data are included in Source Data file.

Similar articles

Cited by

References

    1. Braciale TJ, Sun J, Kim TS. Regulating the adaptive immune response to respiratory virus infection. Nat. Rev. Immunol. 2012;12:295–305. doi: 10.1038/nri3166. - DOI - PMC - PubMed
    1. Tisoncik-Go J, et al. Integrated omics analysis of pathogenic host responses during pandemic H1N1 influenza virus infection: the crucial role of lipid metabolism. Cell Host Microbe. 2016;19:254–266. doi: 10.1016/j.chom.2016.01.002. - DOI - PMC - PubMed
    1. Tam VC, et al. Lipidomic profiling of influenza infection identifies mediators that induce and resolve inflammation. Cell. 2013;154:213–227. doi: 10.1016/j.cell.2013.05.052. - DOI - PMC - PubMed
    1. Chien YH, Meyer C, Bonneville M. gammadelta T cells: first line of defense and beyond. Annu. Rev. Immunol. 2014;32:121–155. doi: 10.1146/annurev-immunol-032713-120216. - DOI - PubMed
    1. Papotto PH, Ribot JC, Silva-Santos B. IL-17+ gammadelta T cells as kick-starters of inflammation. Nat. Immunol. 2017;18:604–611. doi: 10.1038/ni.3726. - DOI - PubMed

Publication types

MeSH terms