. 2021 Mar 26;12(1):1915.
doi: 10.1038/s41467-021-22194-0.

Evaluating the economic impact of water scarcity in a changing world

Affiliations

Evaluating the economic impact of water scarcity in a changing world

Flannery Dolan et al. Nat Commun. .

Abstract

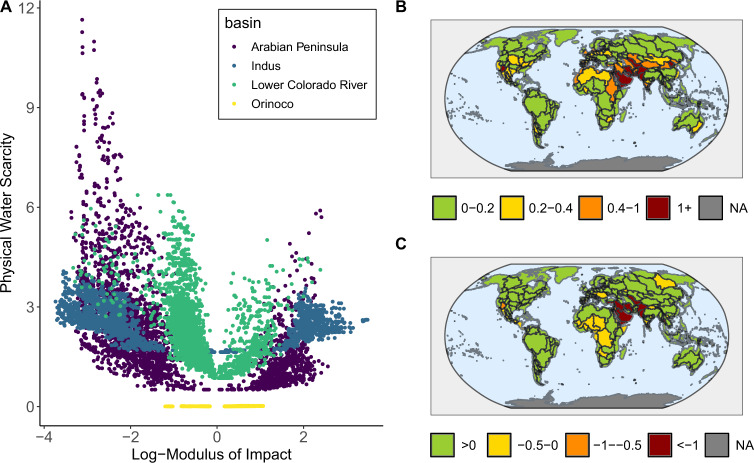
Water scarcity is dynamic and complex, emerging from the combined influences of climate change, basin-level water resources, and managed systems' adaptive capacities. Beyond geophysical stressors and responses, it is critical to also consider how multi-sector, multi-scale economic teleconnections mitigate or exacerbate water shortages. Here, we contribute a global-to-basin-scale exploratory analysis of potential water scarcity impacts by linking a global human-Earth system model, a global hydrologic model, and a metric for the loss of economic surplus due to resource shortages. We find that, dependent on scenario assumptions, major hydrologic basins can experience strongly positive or strongly negative economic impacts due to global trade dynamics and market adaptations to regional scarcity. In many cases, market adaptation profoundly magnifies economic uncertainty relative to hydrologic uncertainty. Our analysis finds that impactful scenarios are often combinations of standard scenarios, showcasing that planners cannot presume drivers of uncertainty in complex adaptive systems.


Conflict of interest statement

The authors declare no competing interests.

Figures

Fig. 1
Fig. 1. Economic and physical water scarcity.
The scatter plot in panel A shows the two metrics in panels B and C plotted against each other in four basins. Each point represents the maximum absolute value of that metric over time in each scenario. The map in panel B shows WTA in each water basin while the map in panel C shows the log-modulus of economic impact. Both maps plot the maximum absolute value of the metric over time and the median across all scenarios. The correspondence between the two metrics is not perfect. Some water-scarce basins have more capacity to handle water scarcity and thus are not as impacted economically as others.
Fig. 2
Fig. 2. Runoff and economic impact uncertainty.
Uncertainty over time plots of the four chosen basins. Values are taken relative to the 2015 baseline. Uncertainty prior to 2015 is illustrative only. The scenario group shown in AD has the lowest mean climate-induced economic impact uncertainty over time out of the 600 groups. The scenario group shown in EH has the highest mean climate-induced economic impact uncertainty over time. In most scenarios, runoff uncertainty is amplified by the human system, leading to higher uncertainty in economic impact.
Fig. 3
Fig. 3. Land use scenario impacts.
Density plots depicting the difference in tax regimes. The plot in A depicts the sum of global cropland over time under the two carbon tax regimes. The density plot in B shows water withdrawals in the Arabian Peninsula in FFICT (orange) and UCT (cyan) scenarios. The density plot in C depicts the shadow price of water in the Indus River basin in the two tax cases. Values in B and C are averaged over time. Total agricultural land increases under the FFICT while water price and water withdrawals increase under the UCT.

References

    1. Forum, W. E. Global Risks 2015. 69 http://www3.weforum.org/docs/WEF_Global_Risks_2015_Report15.pdf (2015).
    1. Nations, U. Sustainable Development Goals: 17 Goals to Transform Our World. https://www.un.org/sustainabledevelopment/ (2015).
    1. Vörösmarty CJ, Hoekstra AY, Bunn SE, Conway D, Gupta J. Fresh water goes global. Science. 2015;349:478–479. doi: 10.1126/science.aac6009. - DOI - PubMed
    1. Gleick, P. The World’s Water, Vol. 7, The Biennial Report on Freshwater Resources. SERBIULA Sist. Libr.20, 10.5822/978-1-61091-483-3 (2011).
    1. Dalin C, Konar M, Hanasaki N, Rinaldo A, Rodriguez-Iturbe I. Evolution of the global virtual water trade network. Proc. Natl Acad. Sci. USA. 2012;109:5989–5994. doi: 10.1073/pnas.1203176109. - DOI - PMC - PubMed

Publication types

LinkOut - more resources