. 2021 Mar 26;12(1):1905.
doi: 10.1038/s41467-021-22272-3.

Brown and beige adipose tissue regulate systemic metabolism through a metabolite interorgan signaling axis

Affiliations

Brown and beige adipose tissue regulate systemic metabolism through a metabolite interorgan signaling axis

Anna Whitehead et al. Nat Commun. .

Abstract

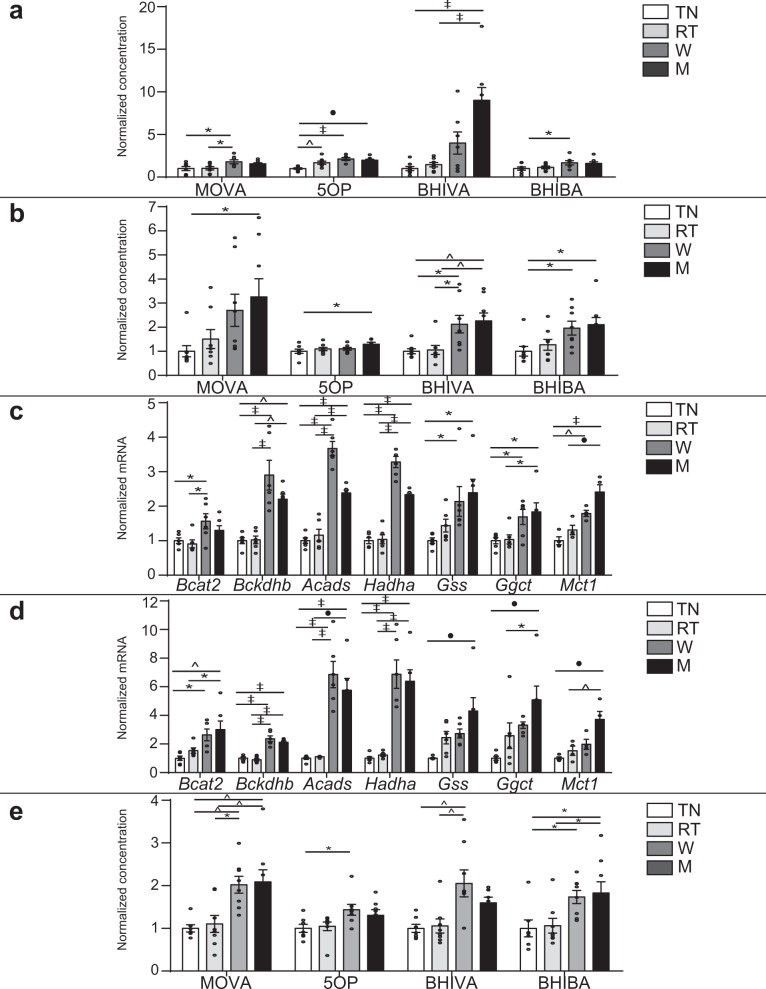
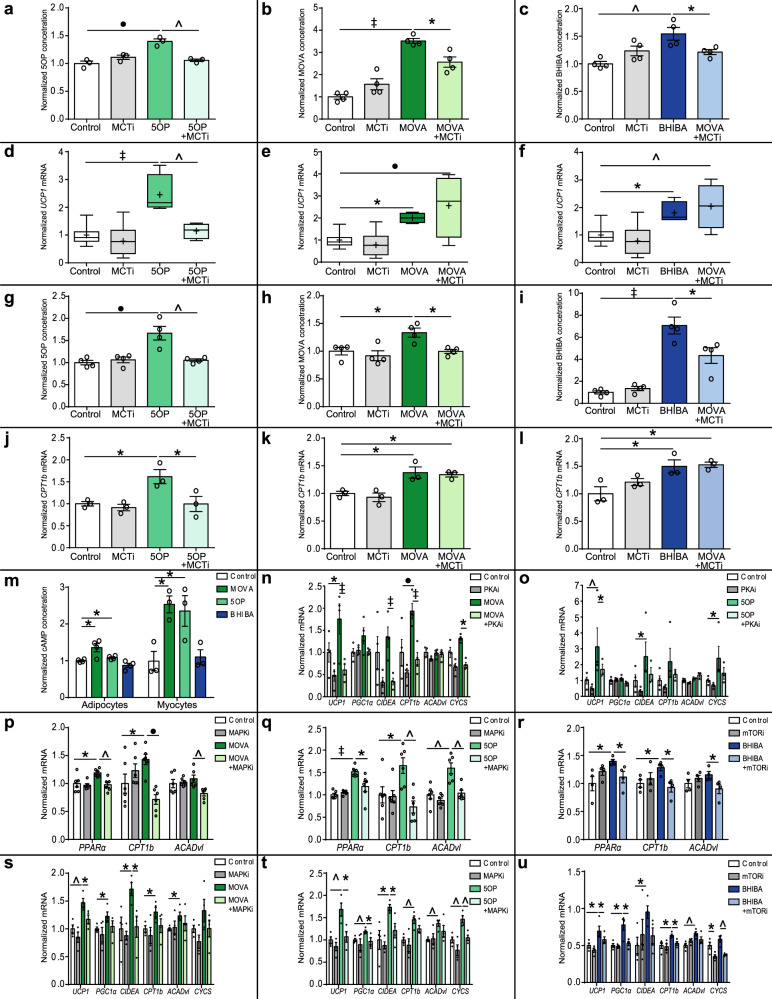
Brown and beige adipose tissue are emerging as distinct endocrine organs. These tissues are functionally associated with skeletal muscle, adipose tissue metabolism and systemic energy expenditure, suggesting an interorgan signaling network. Using metabolomics, we identify 3-methyl-2-oxovaleric acid, 5-oxoproline, and β-hydroxyisobutyric acid as small molecule metabokines synthesized in browning adipocytes and secreted via monocarboxylate transporters. 3-methyl-2-oxovaleric acid, 5-oxoproline and β-hydroxyisobutyric acid induce a brown adipocyte-specific phenotype in white adipocytes and mitochondrial oxidative energy metabolism in skeletal myocytes both in vitro and in vivo. 3-methyl-2-oxovaleric acid and 5-oxoproline signal through cAMP-PKA-p38 MAPK and β-hydroxyisobutyric acid via mTOR. In humans, plasma and adipose tissue 3-methyl-2-oxovaleric acid, 5-oxoproline and β-hydroxyisobutyric acid concentrations correlate with markers of adipose browning and inversely associate with body mass index. These metabolites reduce adiposity, increase energy expenditure and improve glucose and insulin homeostasis in mouse models of obesity and diabetes. Our findings identify beige adipose-brown adipose-muscle physiological metabokine crosstalk.


Conflict of interest statement

The authors declare no competing interests.

Figures

Fig. 1
Fig. 1. Browning adipocytes secrete metabolites, which induce brown-adipocyte-associated gene expression in primary adipocytes.
a Brown-adipocyte-associated gene expression by murine primary adipocytes after exposure to conditioned media (±protein denaturation) from adipocytes induced to brown through cAMP (forskolin 1 μM; red) or peroxisome proliferator-activated receptor δ (PPARδ; GW0742 100 nM; light blue). b, c Conditioned media from browning adipocytes increases brown-adipocyte-associated gene expression in primary adipocytes. Denaturing the media protein content enhanced gene expression (control n = 4; Forskolin-conditioned, PPARδ agonist-conditioned, control denatured, Forskolin-conditioned denatured, PPARδ-conditioned denatured, n = 3; One-way ANOVA Tukey’s post hoc; Control vs. Forskolin-conditioned denatured Ucp1 P < 0.0001, Pgc1α P < 0.0001, Cidea P = 0.003, Cpt1b P = 0.019, Acadvl P = 0.0012, Cycs P = 0.0006; Forskolin- vs. Forskolin-conditioned denatured Ucp1 P = 0.0001, Pgc1α P < 0.0001, Cidea P = 0.0095, Cpt1b P = 0.047, Acadvl P = 0.01, Cycs P = 0.003; conditioned control denatured vs. Forskolin-conditioned denatured Ucp1 P = 0.002, Pgc1α P < 0.0001, Cidea P = 0.029, Cycs P = 0.0013; Conditioned control vs. PPARδ agonist-conditioned denatured Ucp1 P = 0.003, Pgc1α P < 0.0001, Cidea P = 0.0013, Cpt1b P = 0.0029, Acadvl P = 0.0003, Cycs P = 0.0049; PPARδ agonist-conditioned vs. PPARδ agonist-conditioned denatured Ucp1 P = 0.0075, Pgc1α P < 0.0001, Cidea P = 0.0042, Cpt1b P = 0.02, Acadvl P = 0.0046; conditioned control denatured vs. PPARδ agonist denatured Ucp1 P = 0.0075, Pgc1α P < 0.0001, Cidea P = 0.01, Cpt1b P = 0.037, Acadvl P = 0.017, Cycs P = 0.0094). d Reconstituted aqueous-soluble metabolites from browning adipocyte-conditioned media increases brown-adipocyte-associated gene expression in primary adipocytes (n = 3; One-way ANOVA Dunnett’s post hoc; Forskolin aqueous metabolites Ucp1 P < 0.0001, Cidea P = 0.0023; Pparδ agonist aqueous metabolites Ucp1 P < 0.0001, Cidea P = 0.0008). e Metabolomic analysis of the browning adipocyte-conditioned media (yellow) separated from controls (green) in a partial least squares-discriminant analysis (PLS-DA) model (n = 6, Q2 = 0.753). f Volcano plot analysis of metabolomic data identifies that the conditioned media from both browning models was enriched with α-hydroxyisocaproic acid (HIC), α-ketoisovaleric acid (AKV), α-hydroxyisovaleric acid (AHI), 3-methyl-2-oxovaleric acid (MOVA), 5-oxoproline (5OP), β-hydroxyisobutyric acid (BHIBA), and β-hydroxyisovaleric acid (BHIVA) (n = 6; fold-change threshold = 1.5, P value threshold = 0.05). Metabolites enriched (yellow), metabolites depleted (green). g MOVA, 5OP, BHIBA, and BHIVA at physiological concentrations increased brown-adipocyte-associated gene expression in primary adipocytes. Forskolin treatment given as a positive control for browning. (control, AKV, AHI, MOVA, 5OP, BHIBA BHIVA, Forskolin n = 4; HIC n = 3; two-tailed t-test; AKV Pgc1α P = 0.04, Cidea P = 0.01, Cycs P = 0.002; MOVA Ucp1 P = 0.02, Pgc1α = 0.0015, Cidea P  = 0.006, Cpt1b P = 0.02, Acadvl P = 0.0009, Cycs P = 0.005; 5OP Ucp1 P = 0.05, Pgc1α = 0.0006, Cpt1b P = 0.0007, Acadvl P = 0.0008, Cycs P = 0.007; BHIBA Ucp1 P = 0.012, Cidea P = 0.04, Cpt1b P = 0.000014, Acadvl P = 0.016, Cycs P = 0.0007; BHIVA Ucp1 P = 0.0068, Pgc1α = 0.012, Cidea P = 0.009, Acadvl P = 0.001, Cycs P = 0.005; Forskolin Ucp1 P = 0.011, Pgc1α = 0.005, Cidea P = 0.006, Cpt1b P = 0.05, Acadvl P = 0.017, Cycs P = 0.001). h Forskolin or a PPARδ agonist-induced thermogenic genes in mouse canonical primary brown adipocytes (n = 3; One-way ANOVA Dunnett’s post hoc; Forskolin UCP1 P = 0.014, PGC1α P = 0.003, CIDEA P = 0.0016, CPT1b P = 0.0002, ACADvl P = 0.0003, CYCS P = 0.0006; PPARδ agonist UCP1 P = 0.017, PGC1α P = 0.008, CIDEA P = 0.002, CPT1b P = 0.0006, ACADvl P = 0.0002, CYCS P = 0.0008). i Conditioned media from primary brown adipocytes treated with either forskolin or PPARδ agonist was enriched with MOVA, 5OP, BHIBA, and BHIVA (n = 3; One-way ANOVA Dunnett’s post hoc; Forskolin MOVA P = 0.006, BHIVA P = 0.036; PPARδ agonist MOVA P = 0.046, 5OP P = 0.045, BHIBA P = 0.012). (pink = HIC, orange = AKV, yellow = AHI, dark green = MOVA, light green = 5OP, dark blue = BHIBA, purple = BHIVA, red = forskolin) ∗P ≤ 0.05, ^P ≤ 0.01, •P ≤ 0.001, ‡P ≤ 0.0001. Data are mean ± SEM with individual data points shown. Source data are provided as a Source Data file.
Fig. 2
Fig. 2. Browning human adipocytes secrete metabolites, which induce a brown-adipocyte-like functional phenotype.
a 3-methyl-2-oxovaleric acid (MOVA), 5-oxoproline (5OP), β-hydroxyisovaleric acid (BHIVA), and β-hydroxyisobutyric acid (BHIBA) are enriched in browning human adipocyte media (n = 3; One-way ANOVA Dunnett’s post hoc; Forskolin MOVA P = 0.0015, 5OP P = 0.034, BHIVA = 0.012; PPARδ agonist MOVA P = 0.0017, 5OP P = 0.007, BHIVA P = 0.0003, BHIBA P = 0.0017). b MOVA, 5OP, BHIBA, and BHIVA induce brown-adipocyte-associated gene expression in human adipocytes. Forskolin treatment given as a positive control for browning (Control, MOVA, 5OP, BHIBA, and BHIVA n = 4; Forskolin n = 6; two-tailed t-test; MOVA Ucp1 P = 0.0006, Pgc1α = 0.011, Cpt1b P = 0.005, Acadvl P = 0.003, Cycs P = 0.008; 5OP Ucp1 P = 0.019, Pgc1α = 0.0011, Cidea P = 0.002, Cpt1b P = 0.025, Cycs P  = 0.0086; BHIVA Ucp1 P = 0.012, Pgc1α = 0.015, Cidea P  = 0.009, Acadvl P = 0.0016, Cycs P = 0.0038; BHIBA Pgc1α = 0.002, Cidea P = 0.014, Cpt1b P = 0.0024, Acadvl P = 0.01, Cycs P = 0.012; Forskolin Ucp1 P = 0.0014, Pgc1α = 0.009, Cidea P = 0.0002, Acadvl P < 0.0001, Cycs P = 0.0006). c UCP1 protein concentration in human primary adipocytes treated with MOVA, 5OP, BHIVA, and BHIBA determined by ELISA (n = 3, One-way ANOVA Dunnett’s post hoc; MOVA P = 0.025, 5OP P = 0.015, BHIBA P = 0.05). d Basal and stimulated (succinate 20 mmol/L) oxygen consumption increased in human adipocytes treated with MOVA, 5OP, BHIVA, and BHIBA, and Forskolin (provided for comparison) (Control n = 4, MOVA, 5OP, BHIVA, BHIBA n = 3, Forskolin n = 5; two-tailed t-test; Basal MOVA P = 0.023, 5OP P < 0.0001, BHIVA P = 0.006, BHIBA P = 0.0005, Forskolin P < 0.0001; 20-mM Succinate MOVA P = 0.046, 5OP P = 0.011, BHIVA P = 0.044, Forskolin P = 0.00017). eg TCA cycle intermediates citrate, fumarate, and malate 13C-enrichment from 13C-palmitate metabolism in MOVA, 5OP, BHIVA, and BHIBA-treated human adipocytes. M + n, the isotope of M with an increased m/z of +n (Control n = 10, MOVA, 5OP, BHIVA, BHIBA n = 4; One-way ANOVA Dunnett’s post hoc; Citrate MOVA P = 0.013, 5OP P = 0.013, BHIBA P < 0.0001; Fumarate 5OP P = 0.02, BHIBA P < 0.0001; Malate MOVA P = 0.0003, 5OP P = 0.0016, BHIBA P < 0.0001). h Glucose uptake in MOVA, 5OP, BHIVA, and BHIBA-treated human adipocytes. Forskolin provided for comparison (MOVA n = 29, 5OP n = 28, BHIVA n = 30, BHIBA n = 30; two-tailed t-test; MOVA P = 0.0019, 5OP P < 0.0001, BHIVA P < 0.0001, BHIBA P = 0.0009). i Fatty acid uptake in MOVA, 5OP, BHIBA, and BHIVA-treated human adipocytes. Forskolin provided for comparison (MOVA, BHIBA, BHIVA n = 18, 5OP n = 32; two-tailed t-test; MOVA P = 0.02, 5OP P < 0.0012, BHIVA P = 0.00011, BHIBA P = 0.0029, Forskolin = 0.0041). j Composite confocal images (top) of immortalized human adipocytes from neck fat treated with MOVA, 5OP, BHIBA, and BHIVA, stained for lipid (green), nuclei (blue), and UCP1 (yellow) (bottom) (representative images from control = 9, MOVA = 11, 5OP = 9, BHIBA = 12, BHIVA = 12; scale bars = 50 μm). k UCP1 in human adipocytes from neck fat treated with MOVA, 5OP, BHIBA, BHIVA, or Forskolin (percentage change to control) (MOVA n = 11, 5OP n = 9, BHIBA n = 12, BHIVA n = 12, Forskolin n = 6; two-tailed t-test; MOVA P < 0.0001, 5OP P = 0.031, BHIBA P = 0.0395, Forskolin P = 0.0033). Basal respiration, proton leak, chemically uncoupled maximal respiration, and coupling efficiency, assessed by the Seahorse XF platform Mito Stress assay, in human primary adipocytes isolated from neck fat and treated with MOVA l (control n = 26, MOVA n = 29; two-tailed t-test; Basal P = 0.0063, Leak P = 0.00084; maximal P = 0.02; One-way ANOVA with Dunnett’s post hoc; coupling efficiency MOVA P = 0.004, Forskolin P = 0.0066) 5OP m (control n = 29, 5OP n = 28; two-tailed t-test; Basal P < 0.0001, Leak P = 0.0002, maximal P = 0.02 One-way ANOVA with Dunnett’s post hoc; coupling efficiency 5OP P = 0.0013, Forskolin P = 0.01) BHIVA n (control n = 28, BHIVA n = 30; two-tailed t-test; Leak P = 0.033, One-way ANOVA with Dunnett’s post hoc; coupling efficiency BHIVA P = 0.037, Forskolin P = 0.02) or BHIBA o (control n = 29, BHIBA n = 29; two-tailed t-test; Basal P = 0.05, Leak P = 0.01, One-way ANOVA with Dunnett’s post hoc; coupling efficiency BHIBA P = 0.03, Forskolin P = 0.0005) and compared with forskolin (n = 6). Experiments were performed with 20 μM MOVA, 20 μM 5OP, 20 μM BHIBA, 10 μM BHIVA, and 1 μM Forskolin. ∗P ≤ 0.05, ^P ≤ 0.01, •P ≤ 0.001, ‡P  ≤ 0.0001. Light blue = PPARδ agonist, red = forskolin, dark green = MOVA, light green = 5OP, purple = BHIVA, dark blue = BHIBA. Data in bar charts are mean ± SEM with data points shown. Box and whisker plots show 25th to 75th percentile (box) min to max (whiskers), mean (+) and median (−). Source data are provided as a Source Data file.
Fig. 3
Fig. 3. Export of metabolite signals from browning adipocytes is mediated by monocarboxylate transporter 1.
a The expression of monocarboxylate transporter 1 (MCT1) in primary human adipocytes treated with a scrambled control siRNA (con siRNA) or an siRNA against MCT1 (MCT1 siRNA) (n = 4; Con P < 0.0001, Con siRNA P < 0.0001). The concentration of b 3-methyl-2-oxovaleric acid (MOVA), c 5-oxoproline (5OP), d β-hydroxyisovaleric acid (BHIVA), and e β-hydroxyisobutyric acid (BHIBA) measured by liquid chromatography–mass spectrometry in adipocytes (intracellular) and the media (extracellular) of cells treated with forskolin (1 μM) (Forsk), con siRNA, MCT1 siRNA, con siRNA and forskolin (con siRNA + Forsk), or MCT1 siRNA and forskolin (MCT1 siRNA + Forsk) (n = 3) (Extracellular; Con vs. Forsk; MOVA P = 0.02, 5OP P < 0.0001, BHIVA P = 0.0012, BHIBA P = 0.0002; Con siRNA vs. Con SiRNA + Forsk MOVA P < 0.0001, 5OP P < 0.0001, BHIVA P  = 0.0122, BHIBA P = 0.0073; Forsk vs. MCT1 siRNA + Forsk MOVA P = 0.0061, 5OP P < 0.0001, BHIVA P = 0.0007, BHIBA P  = 0.0004; Con siRNA + Forsk vs. MCT1 siRNA + Forsk MOVA P < 0.0001, 5OP P < 0.0001, BHIVA P = 0.047, BHIBA P = 0.022) (Intracellular; Con vs. Forsk MOVA P = 0.0123, 5OP P = 0.0103, BHIVA P = 0.04 BHIBA P = 0.032; Con vs. MCT1 siRNA MOVA P = 0.034, 5OP P = 0.022; Con siRNA vs. Con siRNA + Forsk MOVA P = 0.0101, BHIVA P = 0.037, BHIBA P = 0.039; Con siRNA vs. MCT1 siRNA MOVA P = 0.012; Forsk vs. MCT siRNA + Forsk MOVA P = 0.003, 5OP P = 0.012, BHIVA P = 0.05, BHIBA P = 0.05; Con siRNA + Forsk vs. MCT1 siRNA + Forsk MOVA P = 0.0013, 5OP P = 0.0097, BHIVA P = 0.036, BHIBA P = 0.041). One-way ANOVA with Tukey’s post hoc ∗P ≤ 0.05, ^P ≤ 0.01, •P ≤ 0.001, ‡P ≤ 0.0001. Data are mean ± SEM with individual data points shown. Source data are provided as a Source Data file.
Fig. 4
Fig. 4. MOVA, 5OP, and BHIBA regulate metabolism in mouse and human skeletal myocytes.
a Conditioned media from murine primary adipocytes induced to brown via a cAMP-mediated mechanism increases expression of mitochondrial and metabolic genes in C2C12 myocytes (n = 3; One-way ANOVA with Tukey’s post hoc; Control vs. Forskolin-conditioned, Pgc1α P = 0.016, Pparα P = 0.0092, Cpt1b P = 0.027, Ndufs1 P = 0.041; Conditioned Control vs. Forskolin-conditioned, Pgc1α P = 0.02, Pparα P = 0.011, Cpt1b P = 0.031, Ndufs1 P = 0.016). b The expression of the mitochondrial and metabolic gene panel in C2C12 myocytes treated with 3-methyl-2-oxovaleric acid (MOVA), 5-oxoproline (5OP), β-hydoxyisovaleric acid (BHIVA), and β-hydroxyisobutyric acid (BHIBA) (n = 4; two-tailed t-test; Pgc1α MOVA P = 0.015, 5OP P = 0.004; Pparα MOVA P = 0.008, 5OP P = 0.008, BHIBA P = 0.013; Cpt1b MOVA P = 0.006, 5OP P = 0.0005; Acadvl MOVA P = 0.011, 5OP P = 0.0013; Cycs MOVA P = 0.0012, 5OP P = 0.002; Ndufs1 MOVA P = 0.006, 5OP P = 0.002). c Conditioned media from browning human primary adipocytes increases expression of mitochondrial and metabolic genes in human primary skeletal myocytes (Control, Forskolin-conditioned n = 4, Control conditioned n = 3; One-way ANOVA with Tukey’s post hoc; Control vs. Forskolin-conditioned, Pgc1α P = 0.014, Pparα P = 0.0027, Cpt1b P = 0.012, Acadvl P = 0.016, Cycs P = 0.024, Ndufs1 P = 0.032; Conditioned Control vs. Forskolin-conditioned, Pgc1α P = 0.011, Pparα P = 0,007, Cycs P = 0.014). d The expression of the mitochondrial and metabolic gene panel in human primary skeletal myocytes treated with MOVA, 5OP, BHIVA, and BHIBA (n = 4; two-tailed t-test; PGC1α 5OP P = 0.037; PPARα MOVA P = 0.043, 5OP P = 0.033, BHIBA P = 0.0011; CPT1b MOVA P = 0.034, 5OP P = 0.018, BHIBA P = 0.011; ACADvl MOVA P = 0.037, 5OP P = 0.016). High-resolution respirometry analysis of human primary myocyte respiration with octanoyl-carnitine/malate (Oc/Mal) followed by ADP, pyruvate, glutamate and succinate (Pyr/Glu/Succ), maximal chemically uncoupled substrate oxidation (carbonyl-cyanide m-chlorophenyl hydrazine; CCCP), and rotenone (Rot) following treatment with e MOVA (20 μM) (n = 12; two-tailed t-test; ADP P = 0.027) or f 5OP (20 μM) (Control n = 12, 5OP n = 11; two-tailed t-test; Oc/Mal P = 0.038, ADP P = 0.024, CCCP P = 0.03). g Glucose uptake (6-(N-(7-Nitrobenz-2-oxa-1,3-diazol-4-yl)amino)-6-Deoxyglucose; 6-NBDG) in MOVA (20 μM), 5OP (20 μM), and BHIBA (20 μM)-treated human skeletal myocytes (Control n = 32, MOVA n = 31, 5OP n = 32, BHIBA n = 34; One-way ANOVA with Dunnett’s post hoc; MOVA P = 0.007, 5OP P = 0.0085). h Fatty acid (BODIPY-FA) uptake in MOVA (20 μM), 5OP (20 μM), and BHIBA (20 μM)-treated human skeletal myocytes (Control n = 57, MOVA n = 43, 5OP n = 43, BHIBA n = 47; One-way ANOVA with Dunnett’s post hoc; MOVA P = 0.027, 5OP P = 0.046, BHIBA P = 0.019). Dark green = MOVA, light green = 5OP, purple = BHIVA, dark blue = BHIBA. ∗P ≤ 0.05, ^P ≤ 0.01, •P ≤ 0.001, ‡P ≤ 0.0001. Data in bar charts are mean ± SEM with data points shown. Box and whisker plots show 25th to 75th percentile (box) min to max (whiskers), mean (+) and median (−). Source data are provided as a Source Data file.
Fig. 5
Fig. 5. Cold exposure increases adipose tissue and circulating plasma concentrations of the metabokines.
GC-MS analysis of 3-methyl-2-oxovaleric acid (MOVA), 5-oxoproline (5OP), β-hydroxyisovaleric acid (BHIVA), and β-hydroxyisobutyric acid (BHIBA) concentration in the a interscapular brown adipose tissue (BAT) and b subcutaneous inguinal white adipose tissue (WAT) of mice housed at thermoneutrality (TN), room temperature (RT), 8 °C for 1 week (W), or 8 °C for 1 month (M) (BAT; TN n = 8, RT n = 8, W n = 7, M n = 8; One-way ANOVA with Dunnett’s post hoc; MOVA TN vs. W P = 0.029, RT vs. W P = 0.037; 5OP TN vs. RT P = 0.0046, TN vs. W P < 0.0001, TN vs. M P = 0.0001; BHIVA TN vs. M P < 0.0001, RT vs. M P < 0.0001; BHIBA TN vs. W P = 0.05) (WAT n = 8; One-way ANOVA with Dunnett’s post hoc; MOVA TN vs. M P = 0.02; 5OP TN vs. M P = 0.026; BHIVA TN vs. W P = 0.016, TN vs. M P = 0.0067, RT vs. W P = 0.023, RT vs. M P = 0.0096; BHIBA TN vs. W P = 0.034, TN vs. M P = 0.013). Expression of branched-chain amino acid catabolic (MOVA, BHIBA and BHIVA biosynthetic) enzymes branched-chain amino acid transaminase 2 (Bcat2), branched-chain keto acid dehydrogenase E1 subunit beta (Bckdhb), acyl-CoA dehydrogenase short chain (Acads), hydroxyacyl-CoA dehydrogenase (Hadha), 5OP biosynthetic enzymes glutathione synthetase (Gss), γ-glutamylcyclotransferase (Ggct), and monocarboxylate transporter 1 (Mct1) in the c interscapular BAT (Bcat2, TN vs. W P = 0.035, RT vs. W P = 0.013; Bckdhb TN vs. W p < 0.0001, TN vs. M P = 0.005, RT vs. W P < 0.0001, RT vs. M P = 0.006; Acads TN vs. W P < 0.0001, TN vs. M P < 0.0001, RT vs. W P < 0.0001, RT vs. M P < 0.0001; Hadha TN vs. W P < 0.0001, TN vs. M P < 0.0001, RT vs. W P < 0.0001, RT vs. M P < 0.0001; Gss TN vs. W P = 0.04, TN vs. M P = 0.01; Ggct TN vs. W P = 0.045, TN vs. M P = 0.014, RT vs. M P = 0.018; Mct1 TN vs. W P = 0.0062, TN vs. M P < 0.0001, RT vs. M P = 0.0005) and d subcutaneous WAT (Bcat2, TN vs. W P = 0.019, TN vs. M P = 0.0042, RT vs. M P = 0.037; Bckdhb TN vs. W P < 0.0001, TN vs. M P < 0.0001, RT vs. W P < 0.0001, RT vs. M P < 0.0001; Acads TN vs. W P < 0.0001, TN vs. M P < 0.0001, RT vs. W P < 0.0001, RT vs. M P = 0.0001; Hadha TN vs. W P < 0.0001, TN vs. M P < 0.0001, RT vs. W P < 0.0001, RT vs. M P < 0.0001; Gss TN vs. M P = 0.0008; Ggct TN vs. M P = 0.001, RT vs. M P = 0.04; Mct1 TN vs. M P = 0.0006, RT vs. M P = 0.003) of mice housed at thermoneutrality (TN), room temperature (RT), 8 °C for 1 week (W) or 8 °C for 1 month (M) (n = 6; One-way ANOVA with Dunnett’s post hoc). e MOVA, 5OP, BHIVA, and BHIBA concentration in the blood plasma of mice housed at thermoneutrality (TN), room temperature (RT), 8 °C for 1 week (W) or 8 °C for 1 month (M) (TN n = 7, RT n = 8, W n = 7, M n = 8; One-way ANOVA with Dunnett’s post hoc; MOVA TN vs. W P = 0.006, TN vs. M P = 0.0035, RT vs. W P = 0.011, RT vs. M P = 0.0063; 5OP TN vs. W P = 0.042; BHIVA TN vs. W P = 0.0033, RT vs. W P = 0.0039; BHIBA TN vs. W P = 0.047, TN vs. M P = 0.023, RT vs. M P = 0.03). ∗P ≤ 0.05, ^P ≤ 0.01, •P ≤ 0.001, ‡P ≤ 0.0001. Data in bar graphs are mean ± SEM with individual data points shown. Source data are provided as a Source Data file.
Fig. 6
Fig. 6. The adipokine-like metabolite adipose tissue concentrations are inversely correlated with BMI and positively correlated with brown-adipocyte-associated gene expression in humans.
a–d The inverse correlation of 3-methyl-2-oxovaleric acid (MOVA) (n = 42, r2 = 0.16, P = 0.0088), 5-oxoproline (5OP) (n = 42, r2 = 0.1, P = 0.046), β-hydroxyisovaleric acid (BHIVA) (n = 42, r2 = 0.345, P < 0.0001), and β-hydroxyisobutyric acid (BHIBA) (n = 41, r2 = 0.08, P = 0.08) subcutaneous adipose tissue concentration, measured by GC-MS, to BMI in human volunteers. e–h Correlation of MOVA (n = 30, r2 = 0.15, P = 0.032), 5OP (n = 30, r2 = 0.18, P = 0.02), BHIVA (n = 30, r2 = 0.13, P = 0.05), and BHIBA (n = 29, r2 = 0.06, P = 0.19) concentration with uncoupling protein 1 (UCP1) gene expression in subcutaneous adipose tissue of human volunteers. i–l Correlation of MOVA (n = 28, r2 = 0.13, P = 0.06), 5OP (n = 30, r2 = 0.164, P = 0.027), BHIVA (n = 30, r2 = 0.2, P = 0.014), and BHIBA (n = 29, r2 = 0.06, P = 0.2) concentration with carnitine palmitoyltransferase 1b (CPT1b) gene expression in human adipose tissue. Dark green = MOVA, light green = 5OP, purple = BHIVA, dark blue = BHIBA. Analysis by Pearson correlation. Source data are provided as a Source Data file.
Fig. 7
Fig. 7. MOVA, 5OP, and BHIBA decrease weight gain and regulate systemic energy metabolism in mice.
Weights of mice receiving a 100 mg/kg/day 3-methyl-2-oxovaleric acid (MOVA) (n = 10; Two-way ANOVA P = 0.03; two-tailed t-test, week 5 P = 0.04, week 6 P = 0.046, week 7 P = 0.025, week 8 P = 0.01, week 9 P = 0.03, week 10 P = 0.01, week 11 P = 0.045, week 12 P = 0.046, week 13 P = 0.03, week 14 P = 0.03, week 16 P = 0.049, week 17 P = 0.02) b 100 mg/kg/day 5-oxoproline (5OP) (n = 10; Two-way ANOVA P = 0.05; two-tailed t-test, week 8 P = 0.049, week 12 P = 0.018, week 13 P = 0.02, week 14 P = 0.038, week 15 P = 0.036, week 16 P = 0.02, week 17 P = 0.02), c 150 mg/kg/day β-hydroxyisobutyric acid (BHIBA) (n = 10; two-tailed t-test, week 10 P = 0.05, week 17 P = 0.047) compared to controls (n = 9). d Adiposity of MOVA-, 5OP-, and BHIBA-treated mice (n = 5; two-tailed t-test; MOVA P = 0.006, 5OP P = 0.045). Average hourly energy expenditure for 24-h period, 12-h dark phase (DARK) and 12-h light phase (LIGHT) of e MOVA (n = 9; ANCOVA with body mass as a covariate, 24 h P < 0.001, DARK P = 0.017, LIGHT P = 0.011) f 5OP (n = 9; ANCOVA with body mass as a covariate, 24 h P = 0.0042, DARK P = 0.03, LIGHT P = 0.0044) and g BHIBA (n = 8, ANCOVA with body mass as a covariate, 24 h P = 0.013, LIGHT P = 0.03) treated mice. Insulin tolerance tests of h MOVA (two-tailed t-test; 45 min P = 0.049), i 5OP (two-tailed t-test; 15 min P = 0.049, 30 min P = 0.05), and j BHIBA (two-tailed t-test, 45 min P = 0.019, 60 min P = 0.014) treated mice (n = 10, control n = 9). k Increased mitochondrial content in brown adipose tissue (BAT) of BHIBA-, 5OP-, and MOVA-treated mice (n = 5; two-tailed t-test, BHIBA P = 0.004, 5OP P = 0.05, MOVA P = 0.04). l Ucp1 and Pgc1α concentration of BAT from BHIBA-, 5OP-, and MOVA-treated mice (n = 5; two-tailed t-test; Ucp1 BHIBA P = 0.001, 5OP P = 0.015, MOVA P = 0.02; Pgc1α BHIBA P = 0.004). m Increased subcutaneous inguinal adipose tissue mitochondrial content in BHIBA and 5OP-treated mice (n = 5; two-tailed t-test; BHIBA P = 0.019, 5OP P = 0.04). n Ucp1, Pgc1α, and Cpt1 concentration of subcutaneous adipose tissue from BHIBA-, 5OP-, and MOVA-treated mice (n = 5; two-tailed t-test; Ucp1 BHIBA P = 0.02, 5OP P = 0.005; Pgc1α BHIBA P = 0.004, 5OP P = 0.003; Cpt1 BHIBA P = 0.0006, 5OP P = 0.0002, MOVA P = 0.0065). o BHIBA, 5OP, and MOVA increase soleus muscle mitochondrial content in mice (n = 5; two-tailed t-test; BHIBA P = 0.01, 5OP P = 0.001, MOVA P = 0.015). p BHIBA, 5OP, and MOVA increase Pgc1α and Ndufs1 in the soleus muscle of mice (n = 5; two-tailed t-test; Pgc1α BHIBA P = 0.0085, 5OP P < 0.0001, MOVA P = 0.0014; Ndufs1 BHIBA P = 0.0069, 5OP P = 0.0023, MOVA P = 0.0003). q 18F-FDG PET/CT of BHIBA-, 5OP-, and MOVA-treated mice identifies tissue-specific metabolic effects (representative images from five independent repeats). Scale bars are standardized uptake value (SUV) in rainbow scale (0 violet–5 red). Right—CT, middle—PET, left—PET/CT. 18F-FDG uptake into r BAT (BHIBA P = 0.045, MOVA P = 0.016), and s hind limb muscle (BHIBA P = 0.043, 5OP P = 0.041, MOVA P = 0.0008) and t forelimb muscle (5OP P = 0.014, MOVA P < 0.0001) of BHIBA-, 5OP-, and MOVA-treated mice (n = 5; two-tailed t-test). Dark green = MOVA, light green = 5OP, dark blue = BHIBA. Data in bar graphs are mean ± SEM with individual data points shown. Box and whisker plots show 25th to 75th percentile (box) min to max (whiskers), mean (+) and median (−). ∗P ≤ 0.05, ^P ≤ 0.01, •P ≤ 0.001, ‡P ≤ 0.0001. Source data are provided as a Source Data file.
Fig. 8
Fig. 8. MOVA and 5OP signal through cAMP–PKA–p38 MAPK and BHIBA via mTOR.
The intracellular concentration of a 5-oxoproline (5OP) (n = 3, Control vs. 5OP P = 0.0004, 5OP vs. 5OP + MCTi P = 0.0011), b 3-methyl-2-oxovaleric acid (MOVA) (n = 4, Control vs. MOVA P < 0.0001, MOVA vs. MOVA + MCTi P = 0.011), and c β-hydroxyisobutyric acid (BHIBA) (n = 4, Control vs. BHIBA P = 0.002, BHIBA vs. BHIBA + MCTi P = 0.05) in human primary adipocytes treated concomitantly with the monocarboxylate transporter inhibitor α-cyano-4-hydroxycinnamate (MCTi) (2 mM), which prevents cellular export and import of monocarboxylate species (Two-way ANOVA with Tukey’s post hoc). The expression of UCP1 in human primary adipocytes treated concomitantly with MCTi and d 5OP (20 μM) (Control vs. 5OP P < 0.0001, 5OP vs. 5OP + MCTi P = 0.0034), e MOVA (20 μM) (Control vs. MOVA P = 0.042, Control vs. MOVA + MCTi P = 0.0009), and f BHIBA (20 μM) (Control vs. BHIBA P = 0.047, Control vs. BHIBA + MCTi P = 0.007) (Control n = 12; MCTi n = 11; 5OP, MOVA, BHIBA n = 4; 5OP + MCTi, MOVA + MCTi, BHIBA + MCTi n = 4; Two-way ANOVA with Tukey’s post hoc). The intracellular concentration of g 5OP (Control vs. 5OP P = 0.001, 5OP vs. 5OP + MCTi P = 0.0019), h MOVA (Control vs. MOVA P = 0.029, MOVA vs. MOVA + MCTi P = 0.027), and i BHIBA (Control vs. BHIBA P < 0.0001, BHIBA vs. BHIBA + MCTi P = 0.017) in human primary skeletal myocytes treated concomitantly with the MCTi (2 mM) (n = 4; Two-way ANOVA with Tukey’s post hoc). The expression of CPT1b in human primary myocytes treated concomitantly with MCTi and j 5OP (20 μM) (Control vs. 5OP P = 0.035, 5OP vs. 5OP + MCTi P = 0.034), k MOVA (20 μM) (Control vs. MOVA P = 0.023, Control vs. MOVA + MCTi P = 0.038), and l BHIBA (20 μM) (Control vs. BHIBA P = 0.026, Control vs. BHIBA + MCTi P = 0.019) (n = 3; Two-way ANOVA with Tukey’s post hoc). m Normalized intracellular cAMP concentration measured by liquid chromatography–mass spectrometry in human primary adipocytes and myocytes treated with MOVA (20 μM), 5OP (20 μM), or BHIBA (20 μM) (Two-tailed t-test; adipocytes n = 4, MOVA P = 0.02, 5OP P = 0.039; myocytes n = 3, MOVA P = 0.012, 5OP P = 0.05). Human primary adipocytes treated with the selective protein kinase A inhibitor H89 (10 μM) (PKAi) with and without n 20 μM MOVA (UCP1 MOVA vs. Control P = 0.004, MOVA vs. MOVA + PKAi P < 0.0001; CIDEA MOVA vs. MOVA + PKAi P = 0.0001; CPT1b MOVA vs. Control P = 0.0003, MOVA vs. MOVA + PKAi P < 0.0001; CYCS MOVA vs. MOVA + PKAi P = 0.029) and o 20 μM 5OP (UCP1 5OP vs. Control P = 0.0019, 5OP vs. 5OP + PKAi P = 0.036; CIDEA 5OP vs. Control P = 0.03; CYCS 5OP vs. Control P = 0.05) (n = 4; Two-way ANOVA with Holm-Sidak post hoc). Human primary myocytes treated with the p38 MAPK inhibitor Birb 796 (500 nM) (p38 MAPKi) with and without p 20 μM MOVA (n = 6; Two-tailed t-test; Control vs. MOVA PPARα P = 0.017, CPT1b P = 0.05; MOVA vs. MOVA + MAPKi PPARα P = 0.003, CPT1b P = 0.0002, ACADvl P = 0.007) and q 20 μM 5OP (n = 6; Two-tailed t-test; Control vs. 5OP PPARα P < 0.0001, CPT1b P = 0.026, ACADvl P = 0.0024; 5OP vs. 5OP + MAPKi PPARα P = 0.022, CPT1b P = 0.002, ACADvl P = 0.0021). r Human primary myocytes treated with the mTOR inhibitor temsirolimus (500 nM) (mTORi) with and without 20 μM BHIBA (n = 4; Two-tailed t-test; Control vs. BHIBA PPARα P = 0.026, CPT1b P = 0.017; BHIBA vs. BHIBA + mTORi PPARα P = 0.044, CPT1b P = 0.012, ACADvl P = 0.05). Human primary adipocytes treated with the p38 MAPK inhibitor Birb 796 (500 nM) (p38 MAPKi) with and without s 20 μM MOVA (n = 4; Two-tailed t-test; Control vs. MOVA UCP1 P = 0.0041, PGC1α P = 0.037, CIDEA P = 0.025, CPT1b P = 0.029, ACADvl P = 0.017; MOVA vs. MOVA + MAPKi UCP1 P = 0.033, CIDEA P = 0.023) and t 20 μM 5OP (n = 4; Two-tailed t-test; Control vs. 5OP UCP1 P = 0.0052, PGC1α P = 0.007, CIDEA P = 0.016, CPT1b P = 0.0045, ACADvl P = 0.0013, CYCS P = 0.0047; 5OP vs. 5OP + MAPKi UCP1 P = 0.017, PGC1α P = 0.041, CIDEA P = 0.024, CYCS P = 0.0068). u Human primary adipocytes treated with mTORi (500 nM) with and without 20 μM BHIBA (n = 4; Two-tailed t-test; Control vs. BHIBA UCP1 P = 0.044, PGC1α P = 0.013, CIDEA P = 0.018, CPT1b P = 0.025, ACADvl P = 0.007; BHIBA vs. BHIBA + mTORi UCP1 P = 0.047, PGC1α P = 0.019, CPT1b P = 0.014, CYCS P = 0.0014; Control vs. mTORi CYCS P = 0.029). Dark green = MOVA, light green = 5OP, dark blue = BHIBA. Data in bar graphs are mean ± SEM with individual data points shown. Box and whisker plots show 25th to 75th percentile (box) min to max (whiskers), mean (+) and median (−). ∗P ≤ 0.05, ^P ≤ 0.01, •P ≤ 0.001, ‡P ≤ 0.0001. Source data are provided as a Source Data file.

Similar articles

Cited by

References

    1. Lowell BB, Spiegelman BM. Towards a molecular understanding of adaptive thermogenesis. Nature. 2000;404:652–660. doi: 10.1038/35007527. - DOI - PubMed
    1. Wu Z, et al. Mechanisms controlling mitochondrial biogenesis and respiration through the thermogenic coactivator PGC-1. Cell. 1999;98:115–124. doi: 10.1016/S0092-8674(00)80611-X. - DOI - PubMed
    1. Wu J, et al. Beige adipocytes are a distinct type of thermogenic fat cell in mouse and human. Cell. 2012;150:366–376. doi: 10.1016/j.cell.2012.05.016. - DOI - PMC - PubMed
    1. Wu J, Cohen P, Spiegelman BM. Adaptive thermogenesis in adipocytes: is beige the new brown? Genes Dev. 2013;27:234–250. doi: 10.1101/gad.211649.112. - DOI - PMC - PubMed
    1. Bouillaud F, Ricquier D, Thibault J, Weissenbach J. Molecular approach to thermogenesis in brown adipose tissue: cDNA cloning of the mitochondrial uncoupling protein. Proc. Natl Acad. Sci. U. S. A. 1985;82:445–448. doi: 10.1073/pnas.82.2.445. - DOI - PMC - PubMed

Publication types

MeSH terms