. 2021 Mar 26;11(1):6955.
doi: 10.1038/s41598-021-85381-5.

Geographically weighted machine learning model for untangling spatial heterogeneity of type 2 diabetes mellitus (T2D) prevalence in the USA

Affiliations

Geographically weighted machine learning model for untangling spatial heterogeneity of type 2 diabetes mellitus (T2D) prevalence in the USA

Sarah Quiñones et al. Sci Rep. .

Erratum in

Abstract

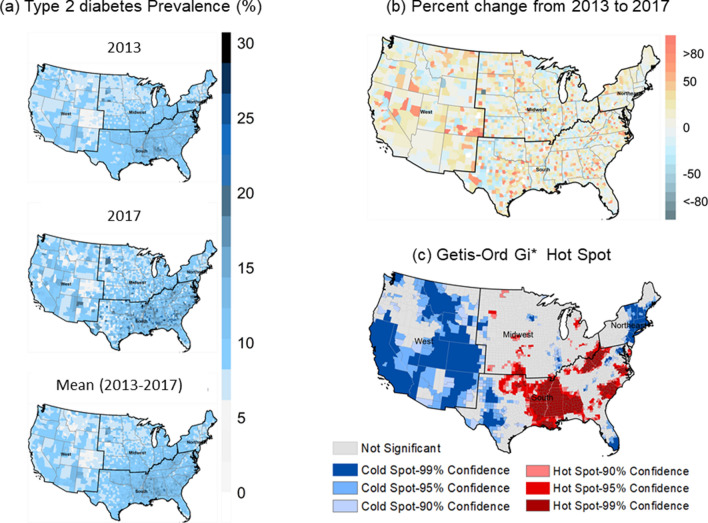
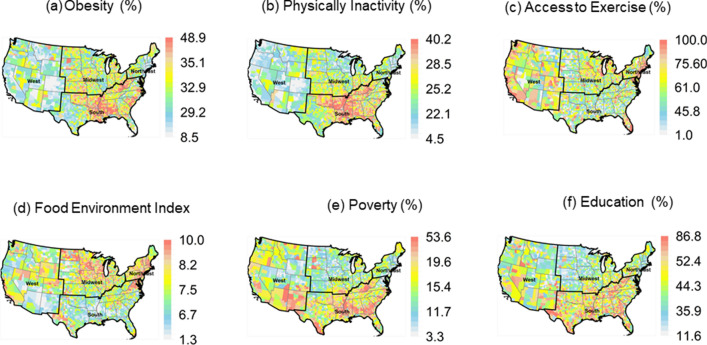
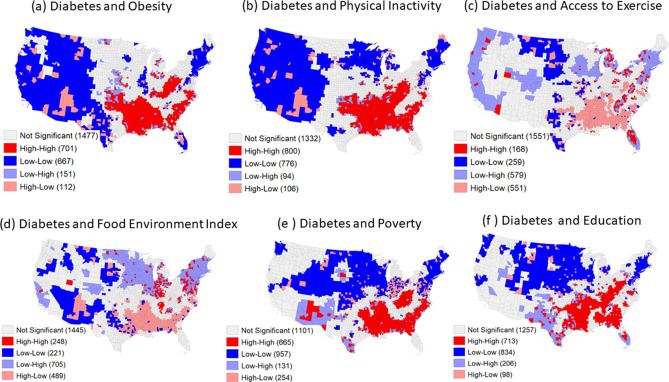
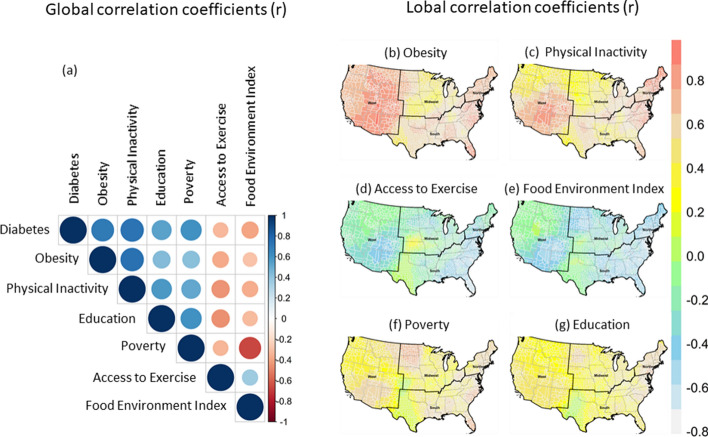
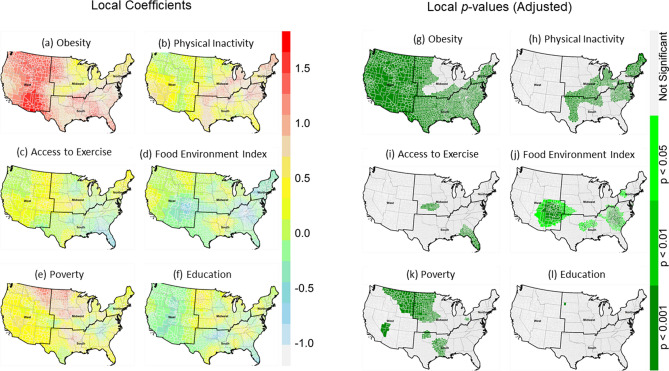
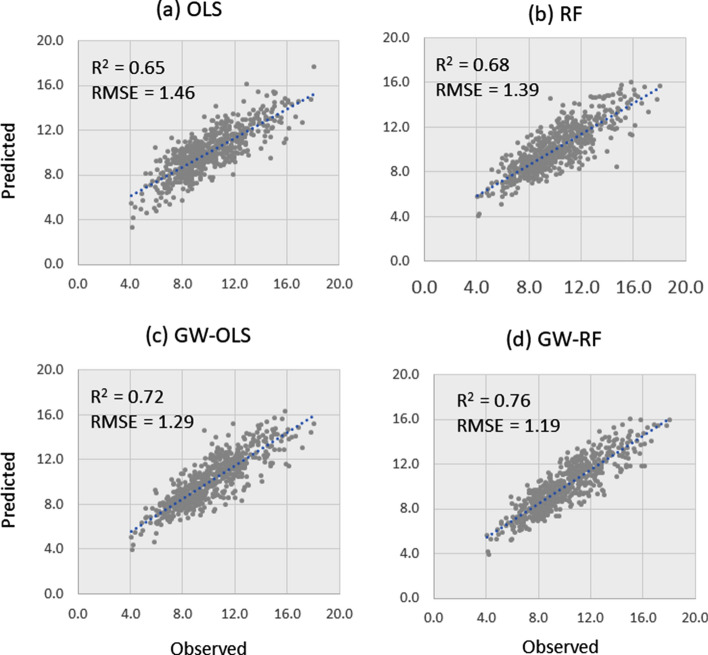
Type 2 diabetes mellitus (T2D) prevalence in the United States varies substantially across spatial and temporal scales, attributable to variations of socioeconomic and lifestyle risk factors. Understanding these variations in risk factors contributions to T2D would be of great benefit to intervention and treatment approaches to reduce or prevent T2D. Geographically-weighted random forest (GW-RF), a tree-based non-parametric machine learning model, may help explore and visualize the relationships between T2D and risk factors at the county-level. GW-RF outputs are compared to global (RF and OLS) and local (GW-OLS) models between the years of 2013-2017 using low education, poverty, obesity, physical inactivity, access to exercise, and food environment as inputs. Our results indicate that a non-parametric GW-RF model shows a high potential for explaining spatial heterogeneity of, and predicting, T2D prevalence over traditional local and global models when inputting six major risk factors. Some of these predictions, however, are marginal. These findings of spatial heterogeneity using GW-RF demonstrate the need to consider local factors in prevention approaches. Spatial analysis of T2D and associated risk factor prevalence offers useful information for targeting the geographic area for prevention and disease interventions.


Conflict of interest statement

The authors declare no competing interests.

Figures

Figure 1
Figure 1
County-level prevalence maps of (a) T2D for the years 2013–2017 and 5-year average (2013–2017); (b) percent change from years 2013–2017; and (c) the geographical clusters of counties from Getis-Ord Gi* statistics of T2D. Maps in (a) and (b) were created in the R (4.0.0) Statistical Computing Environment. Getis-Ord Gi* Hot Spot map was created in ArcGIS Desktop version 10.6.1.
Figure 2
Figure 2
County-level 5-year averages (2013–2017) of six risk factors. (a) obesity; (b) physical inactivity; (c) access to exercise; (d) food environment index; (e) poverty; and (f) education. Maps were created in the R (version 4.0.0) Statistical Computing Environment.
Figure 3
Figure 3
Bivariate LMI cluster of diabetes and (a) obesity; (b) physical inactivity; (c) access to exercise; (d) food environment index; (e) poverty; and (f) education. Maps were generated in GeoDa (version 1.14), an open source software for geodata analysis.
Figure 4
Figure 4
Global (a) and local Pearson correlation coefficients (r-values) of T2D prevalence and six risk factors. (b) obesity; (c) physical inactivity; (d) access to exercise; (e) food environment index; (f) poverty; and (g) education. Maps were created in the R (version 4.0.0) Statistical Computing Environment.
Figure 5
Figure 5
Spatial variation of local coefficients and p-values (adjusted) of geographically weighted OLS (GW-OLS) regression models. (af) local coefficients of obesity, physical inactivity, access to exercise, food environment index, poverty and education, and (gl) corresponding local p-values of all predictors. Maps were created in the R (version 4.0.0) Statistical Computing Environment.
Figure 6
Figure 6
(a) Permutation-based feature importance from global random forest, (b,c) partial dependency profiles of the first four important variables of global random forest model, and (fl) spatial variation of local feature importance (%incMSE) of obesity, physical inactivity, access to exercise, food environment index, poverty, and education in geographically weighted random forest regression models. Higher values imply increased importance. The random forest model was trained with 5 years of mean data (2013–2017) of 3108 counties. Maps were created in the R (version 4.0.0) Statistical Computing Environment.
Figure 7
Figure 7
1:1 plot of observed versus predicted T2D prevalence (%) in 624 test counties for the (a) OLS, (b) RF, (c) GW-OLS, and (d) GW-RF regression models. All models were trained with data from 2484 counties (see supplementary information and Figure S2).

References

    1. Cunningham SA, et al. County-level contextual factors associated with diabetes incidence in the United States. Ann. Epidemiol. 2018;28:20–25.e22. doi: 10.1016/j.annepidem.2017.11.002. - DOI - PMC - PubMed
    1. Centers for Disease Control and Prevention. National diabetes statistics report. 2020 (2020).
    1. Centers for Disease Control and Prevention. National diabetes statistics report. 2017 (2017).
    1. Lin J, et al. Projection of the future diabetes burden in the United States through 2060. Popul. Health Metrics. 2018;16:9. doi: 10.1186/s12963-018-0166-4. - DOI - PMC - PubMed
    1. Centers for Disease Control and Prevention. US Diabetes Surveillance System. https://gis.cdc.gov/grasp/diabetes/DiabetesAtlas.html (2020).