. 2021 Mar 26;11(1):6973.
doi: 10.1038/s41598-021-86160-y.

Natural recovery of a marine foundation species emerges decades after landscape-scale mortality

Affiliations

Natural recovery of a marine foundation species emerges decades after landscape-scale mortality

Margaret O Hall et al. Sci Rep. .

Abstract

Globally, the conditions and time scales underlying coastal ecosystem recovery following disturbance remain poorly understood, and post-disturbance examples of resilience based on long-term studies are particularly rare. Here, we documented the recovery of a marine foundation species (turtlegrass) following a hypersalinity-associated die-off in Florida Bay, USA, one of the most spatially extensive mortality events for seagrass ecosystems on record. Based upon annual sampling over two decades, foundation species recovery across the landscape was demonstrated by two ecosystem responses: the range of turtlegrass biomass met or exceeded levels present prior to the die-off, and turtlegrass regained dominance of seagrass community structure. Unlike reports for most marine taxa, recovery followed without human intervention or reduction to anthropogenic impacts. Our long-term study revealed previously uncharted resilience in subtropical seagrass landscapes but warns that future persistence of the foundation species in this iconic ecosystem will depend upon the frequency and severity of drought-associated perturbation.


Conflict of interest statement

The authors declare no competing interests.

Figures
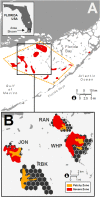
Figure 1
Figure 1
Delineation of seagrass die-off in Florida Bay, and location and die-off status of study sites. (A) Spatial extent of turtlegrass die-off 1987–1991 (yellow dashed line) and severely affected areas (red) as adapted from Robblee et al.. (B) Four basins were selected as study sites (RAN: Rankin Lake, JON: Johnson Key, WHP: Whipray, and RBK: Rabbit Key). Within each basin (hexagonal areas) die-off was categorized into zones: “severe” (red), “patchy” (orange) and “unaffected” (black) based upon patterns of seagrass cover and frequency of seagrass occurrence (see Materials and Methods).
Figure 2
Figure 2
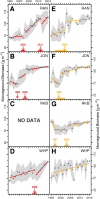
Temporal patterns of seagrass abundance identified by breakpoint analysis. Mean annual aboveground biomass of turtlegrass (circles) is presented for basins within which severe (red; AD) and patchy (orange; EH) die-off was recorded. Transitions between different phases of recovery were identified using breakpoint analysis (Materials and Methods). Colored horizontal lines along the biomass abscissa indicate 95% confidence intervals for each breakpoint (arrows). Solid lines are linear fits for each segment and standard deviation is shown as the gray shaded region.
Figure 3
Figure 3
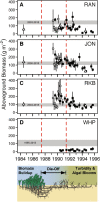
Turtlegrass biomass in die-off zones during the “recovered” phase of post die-off generally met or exceeded pre-die-off levels in all basins. The range in annual mean aboveground biomass of turtlegrass from the last segment of regression of each basin, interpreted as the “recovered” phase, and both die-off zones (shown as gray shaded region and taken from Fig. 2) is compared to unaffected areas. For each basin, years noted within the gray shaded region represent those spanning the last segment identified by breakpoint analyses (Fig. 2). Also presented are historical data for “pre-die-off” biomass of turtlegrass in west-central Florida Bay (open triangle) and values for turtlegrass biomass extracted from studies reporting data for turtlegrass collected from cores within healthy, unaffected turtlegrass beds contemporaneously with die-off (time period within red dashed lines; data sources: squares, triangles, circles). Pre-die-off information for WHP was only available from a nearby location outside sampling boundaries. Decreasing levels of seagrass biomass in unaffected areas from 1991–96 due to algal bloom effects are evident. Sequential changes from 1984–1996 in seagrass response post die-off and prior to recovery are illustrated below plots (see Supplementary Information A).
Figure 4
Figure 4
Following die-off, turtlegrass replaced early successional species of seagrass, becoming the dominant canopy former in all basins. Annual mean (± SE) percent cover of three seagrass species recorded over the recovery trajectory by die-off zone: (A) severe; n = 3, (B) patchy; n = 4, and (C) unaffected; n = 4. Basin means (JON, RAN, RKB and WHP) were treated as replicates for each year. Temporal patterns of seagrass coverage in areas of severe die-off exhibited initial colonization by the fast-growing seagrass, shoal grass (Halodule), followed by manatee grass (Syringodium), coincident with improved light conditions after several years of algal blooms. For patchy zones (B), turtlegrass (Thalassia) remaining after die-off was lost during the algal blooms. Recovery then exhibited a temporally compressed pattern of the same seagrass succession pathway as in (A), above. In contrast, unaffected areas (C) retained nominally high levels of cover over the entire 20-y sampling period.

References

    1. Pandolfi JM, et al. Global trajectories of long-term decline of coral reef ecosystems. Science. 2003;301:955–958. doi: 10.1126/science.1085706. - DOI - PubMed
    1. Halpern BS, et al. A global map of human impact on marine ecosystems. Science. 2008;319:948–952. doi: 10.1126/science.1149345. - DOI - PubMed
    1. Lotze HK, et al. Depletion, degradation, and recovery potential of estuaries and coastal seas. Science. 2006;312:1806–1809. doi: 10.1126/science.1128035. - DOI - PubMed
    1. Dayton PK, Tegner MJ, Parnell PE, Edwards PB. Temporal and spatial patterns of disturbance and recovery in a kelp forest community. Ecol. Monogr. 1992;62:421–445. doi: 10.2307/2937118. - DOI
    1. Gilmour JP, Smith LD, Heyward AJ, Baird AH, Pratchett MS. Recovery of an isolated coral reef system following severe disturbance. Science. 2013;340:69–71. doi: 10.1126/science.1232310. - DOI - PubMed

Publication types

Substances

LinkOut - more resources