. 2021 Mar 26;4(1):413.
doi: 10.1038/s42003-021-01918-4.

The metabolic network of the last bacterial common ancestor

Affiliations

The metabolic network of the last bacterial common ancestor

Joana C Xavier et al. Commun Biol. .

Abstract

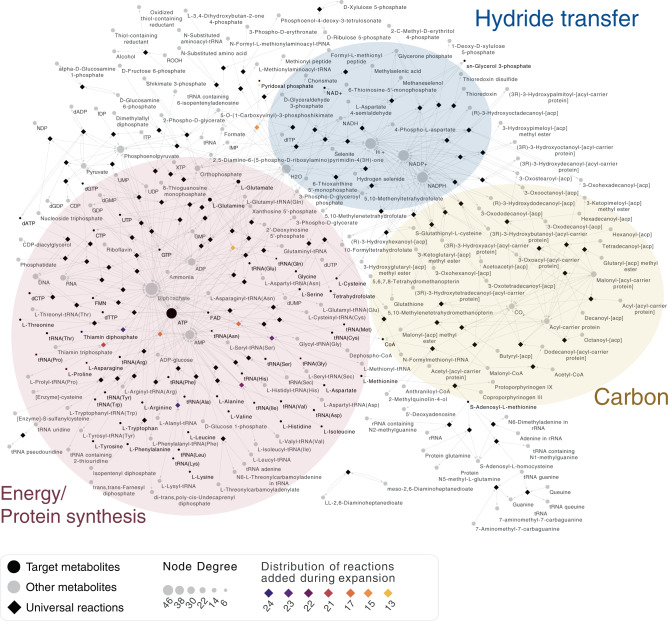
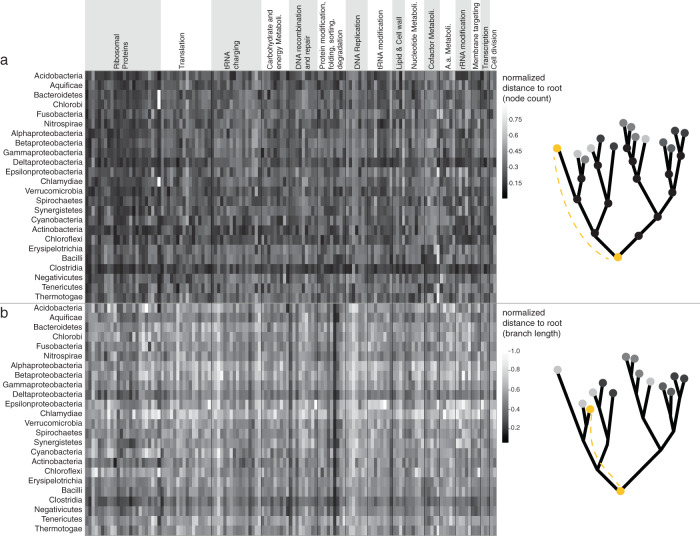
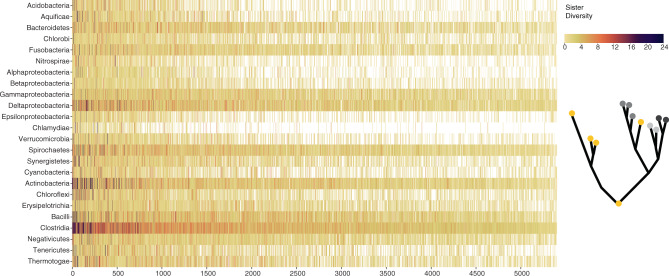
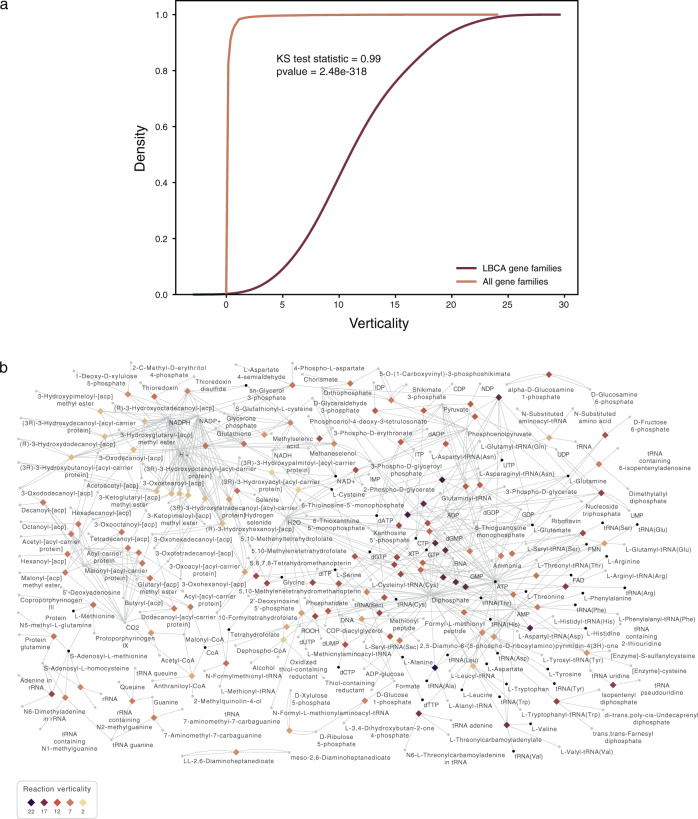
Bacteria are the most abundant cells on Earth. They are generally regarded as ancient, but due to striking diversity in their metabolic capacities and widespread lateral gene transfer, the physiology of the first bacteria is unknown. From 1089 reference genomes of bacterial anaerobes, we identified 146 protein families that trace to the last bacterial common ancestor, LBCA, and form the conserved predicted core of its metabolic network, which requires only nine genes to encompass all universal metabolites. Our results indicate that LBCA performed gluconeogenesis towards cell wall synthesis, and had numerous RNA modifications and multifunctional enzymes that permitted life with low gene content. In accordance with recent findings for LUCA and LACA, analyses of thousands of individual gene trees indicate that LBCA was rod-shaped and the first lineage to diverge from the ancestral bacterial stem was most similar to modern Clostridia, followed by other autotrophs that harbor the acetyl-CoA pathway.


Conflict of interest statement

The authors declare no competing interests.

Figures

Fig. 1
Fig. 1. Metabolic network of LBCA expanded with 9 genes to include 57 universal biomolecules.
Metabolic interconversions encoded by 146 LBCA genes plus 9 genes present in fewer groups are shown in a bipartite graph, with 243 metabolites (circular nodes) and 130 reactions (diamond nodes). Black circles represent the 57 universal target metabolites and gray circles represent the remaining metabolites. Note, however, that some of these are also universal (e.g., NADH), but directly connected to the chosen targets (e.g., in that case NAD+). Node sizes increase according to node degree. Diamonds (reactions) are colored according to the presence of genes encoding for those reactions in different taxonomic groups: in black, reactions present in all taxa; in a gradient from purple to orange reactions added during network expansion and distributed in fewer taxa (target compounds are highlighted with the same outline color if they were introduced with network expansion). Transparent colored ellipses highlight the core of energy (red) hydride transfer (blue) and carbon (yellow) metabolism.
Fig. 2
Fig. 2. Divergence analyses for 1089 anaerobic genomes using 131 universal trees reveal clostridial species are closer to the root.
Analysis of 131 rooted trees of genes universally present in bacterial anaerobic taxa spanning major functional categories (sorted horizontally according to curated classifications shown on top; order as in Supplementary Data 3). Illustrative trees on the side portray the metric used in each analysis and identify the group at the root in each with yellow nodes. a Root-to-tip distance measured as node depth (normalized by the largest distance in each tree). b Root-to-tip distance measured as branch length (normalized by the largest distance in each tree).
Fig. 3
Fig. 3. Sister diversity analysis of 5402 phylogenetic trees reveals Clostridia is the most ancestral group.
Sister diversity (maximum number of different groups in the sister clade) for each group (rows) for 5402 trees with at least six groups (columns). An illustrative tree portrays the question asked in the analyses, where the yellow group is the one with the highest sister diversity score and therefore inferred as most ancestral.
Fig. 4
Fig. 4. Analysis of verticality for LBCA gene families.
a Verticality for all prokaryotic gene families (light brown) and for LBCA gene families (dark brown) and Kolmogorov–Smirnov statistics between the two distributions. b LBCA metabolic network annotated with verticality value for each reaction node.

References

    1. Flemming HC, Wuertz S. Bacteria and archaea on Earth and their abundance in biofilms. Nat. Rev. Microbiol. 2019;17:247–260. doi: 10.1038/s41579-019-0158-9. - DOI - PubMed
    1. Madigan, M. T., Bender, K. S., Buckley, D. H., Sattley, W. M. & Stahl, D. A. Brock Biology of Microorganisms (Pearson, 2017).
    1. Sleep NH. Geological and geochemical constraints on the origin and evolution of life. Astrobiology. 2018;18:1199–1219. doi: 10.1089/ast.2017.1778. - DOI - PubMed
    1. Betts HC, et al. Integrated genomic and fossil evidence illuminates life’s early evolution and eukaryote origin. Nat. Ecol. Evol. 2018;2:1556–1562. doi: 10.1038/s41559-018-0644-x. - DOI - PMC - PubMed
    1. Javaux EJ. Challenges in evidencing the earliest traces of life. Nature. 2019;572:451–460. doi: 10.1038/s41586-019-1436-4. - DOI - PubMed

Publication types

MeSH terms

Substances

LinkOut - more resources