. 2021 Mar 16;11(3):jkab015.
doi: 10.1093/g3journal/jkab015.

Social network analysis of the genealogy of strawberry: retracing the wild roots of heirloom and modern cultivars

Affiliations

Social network analysis of the genealogy of strawberry: retracing the wild roots of heirloom and modern cultivars

Dominique D A Pincot et al. G3 (Bethesda). .

Erratum in

Abstract

The widely recounted story of the origin of cultivated strawberry (Fragaria × ananassa) oversimplifies the complex interspecific hybrid ancestry of the highly admixed populations from which heirloom and modern cultivars have emerged. To develop deeper insights into the three-century-long domestication history of strawberry, we reconstructed the genealogy as deeply as possible-pedigree records were assembled for 8,851 individuals, including 2,656 cultivars developed since 1775. The parents of individuals with unverified or missing pedigree records were accurately identified by applying an exclusion analysis to array-genotyped single-nucleotide polymorphisms. We identified 187 wild octoploid and 1,171 F. × ananassa founders in the genealogy, from the earliest hybrids to modern cultivars. The pedigree networks for cultivated strawberry are exceedingly complex labyrinths of ancestral interconnections formed by diverse hybrid ancestry, directional selection, migration, admixture, bottlenecks, overlapping generations, and recurrent hybridization with common ancestors that have unequally contributed allelic diversity to heirloom and modern cultivars. Fifteen to 333 ancestors were predicted to have transmitted 90% of the alleles found in country-, region-, and continent-specific populations. Using parent-offspring edges in the global pedigree network, we found that selection cycle lengths over the past 200 years of breeding have been extraordinarily long (16.0-16.9 years/generation), but decreased to a present-day range of 6.0-10.0 years/generation. Our analyses uncovered conspicuous differences in the ancestry and structure of North American and European populations, and shed light on forces that have shaped phenotypic diversity in F. × ananassa.

Keywords: DNA forensics; Fragaria; biodiversity; conservation genetics; domestication; kinship.


Figures

Figure 1
Figure 1
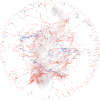
Global pedigree network for cultivated strawberry. Sociogram depicting ancestral interconnections among 8,851 accessions, including 8,424 F. × ananassa individuals originating as early as 1775, of which 2,656 are cultivars. The genealogy includes F. chiloensis and F. virginiana founders tracing to 1624 or later. Nodes and edges for 267 wild species founders are shown in blue, whereas nodes and edges for 1,171 F. × ananassa founders are shown in red. Founders are individuals with unknown parents. Nodes and edges for descendants (non-founders) are shown in light gray. The outer ring (halo of nodes and edges) are orphans or individuals in short dead-end pedigrees disconnected from the principal pedigree network or the so-called giant component.
Figure 2
Figure 2
Genealogy for California and Cosmopolitan populations of cultivated strawberry. (A) Sociogram depicting ancestral interconnections among 3,802 individuals in the “California” population. This population included 3,452 F. × ananassa individuals developed at the (UCD, from 1924 to 2012, in addition to 151 non-UCD F. × ananassa ascendants that originated between 1775 and 1924. Node and edge colors depict the year of origin of the individual in the pedigree network from oldest (red) to youngest (blue) with a continuous progression from warm to cool colors as a function of time (year of origin). Nodes and edges for individuals with unknown years of origin are shown in gray. (B) Sociogram depicting ancestral interconnections among 5,354 individuals in the “Cosmopolitan” population. This population included 5,106 F. × ananassa individuals developed across the globe between 1775 and 2018 and excluded UCD individuals other than UCD ancestors in the pedigrees of non-UCD individuals. Node and edge colors depict the continent where individuals in the pedigree network originated: Australia (orange), Asia (red), North America (blue), and Europe (green). Nodes and edges for individuals of unknown origin are shown in gray. (A and B) For both sociograms, node diameters are proportional to the betweenness centrality (B) metrics for individuals (nodes). Orphans and short dead-end pedigrees that were disconnected from the principal pedigree network (“giant component”) are not shown. (C) PCA of the pedigree–genomic relationship matrix (H) for the California population. The H matrix (8,851×8,851) was estimated from the coancestry matrix (A) for 8,851 individuals and the genomic relationship matrix (G) for 1,495 individuals genotyped with a 35-K SNP array. The PCA plot shows PC1 and PC2 coordinates for 3,802 individuals in the California population color-coded by year of origin. (D) PCA of the H matrix for the Cosmopolitan population. The PCA plot shows PC1 and PC2 coordinates for 5,354 individuals in the Cosmopolitan population color-coded by country, region, or continent of origin.
Figure 3
Figure 3
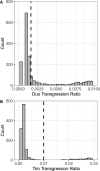
Lower tails of duo and trio transgression ratio distributions. DTRs and TTRs were estimated from the genotypes of 14,650 SNP markers among 1,235 individuals in the California population of strawberry. DTR and TTR thresholds for parent exclusion were empirically estimated by bootstrapping. Vertical dashed lines demarcate the bootstrap-estimated thresholds (DTR < 0.0016 and TTR < 0.01) applied in parent exclusion analyses. (A) Distribution of 2,708 DTR estimates in the lower tail (0.00 to 0.01) of the 0.00 to 1.00 distribution (DTR estimates > 0.01 are not shown). There were 761,995 possible PO duos (DTR estimates) among 1,235 individuals in the California population. (B) Distribution of 2,815 TTR estimates in the lower tail (0.00 to 0.03) of the 0.00 to 1.00 distribution (TTR estimates > 0.03 are not shown). There were 941,063,825 possible TTR estimates for trios among 1,235 individuals in the California population.
Figure 4
Figure 4
Pedigree for the heirloom cultivar “Madame Moutot” (circa 1906). Arrows indicate the flow of genes from parents to offspring. FV22 is an unknown F. virginiana ecotype, FC71 is an unknown F. chiloensis ecotype, and “Chili du Plougastel” is purportedly one of the original F. chiloensis individuals imported by Amédée-François Frézier from Chile to France in 1714. Unknown parents of individuals in the pedigree are identified by NA1, NA2,…, NA7. Terminal individuals in the pedigree are founders (individuals with unknown parents). The oldest F. × ananassa cultivar in the pedigree is “White Carolina” (PI551681), which originated sometime before 1775.
Figure 5
Figure 5
Relative founder equivalents, inbreeding coefficients, and wild founder genetic contributions over time. (A) Relative founder equivalent (Fe/n) estimates for California and Cosmopolitan cultivars over time, where Fe = founder equivalents and n = number of founders. The California population included 69 cultivars developed at the UCD, since the inception of the breeding program in 1924. The birth year (year of origin) was known for all of the UCD cultivars. The Cosmopolitan population included 2,140 cultivars with known birth years. (B) Wright’s coefficient of inbreeding (F) for individuals in the California and Cosmopolitan populations over time. F was estimated from the relationship matrix (A). (C) Estimates of the GCs of wild species founders to allelic diversity in the California and Cosmopolitan populations.
Figure 6
Figure 6
Genetic contributions of ancestors to cultivars. (A) The GCs of ancestors to the allelic diversity among k cultivars within a focal population were estimated from the mean coancestry between the ith ancestor and the k cultivars within the focal population. The GCs of the ancestors were ordered from largest to smallest to calculate the cumulative GCs of ancestors to cultivars in a focal population. (B) The proportion of ancestors needed to account for p% of the allelic diversity among cultivars within a focal population was estimated by dividing the cumulative GC by k.
Figure 7
Figure 7
Structural roles and betweenness centrality (B) and out-degree (do) statistics for individuals in cultivated strawberry sociograms. (A) B and do estimates for individuals in the California population. (B) B and do estimates for individuals in the Cosmopolitan population. (A) and (B) The red dashed lines delineate globally central (upper right; do > d¯oB > B¯), locally central (upper left; do > d¯oB < B¯), broker (lower right; do < d¯oB > B¯), and marginal (lower left; do < d¯oB < B¯) quadrants, where B¯ = the mean of B estimates and do¯ = the mean of do estimates. B¯ = 755.6 and d¯o = 1.8 for the California population, whereas B¯ = 315.2 and d¯o = 1.5 for the Cosmopolitan population. B and do estimate densities are plotted along the x- and y-axes.
Figure 8
Figure 8
Selection cycle length distributions by geography. Selection cycle length means (S¯ = mean number of years/generation) were estimated for k cultivars within continent-, region-, and country-specific focal populations of cultivated strawberry (k is shown in parentheses for each geographic group). S¯ was estimated from edge lengths (years/edge) for all possible paths (directed graphs with alleles flowing from parents to offspring, but not vice versa) in pedigrees connecting cultivars to founders, where the length of an edge = the birth year difference between parent and offspring. S¯ probability densities are shown for cultivars developed in different countries, regions, or continents. Only estimates in the zero to 30 year/generation range are shown because estimates exceeding 30 years/generation were extremely rare.
Figure 9
Figure 9
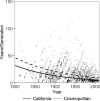
Breeding speed over time. Selection cycle lengths (S = years/generation) were estimated for 3,693 independent PO edges in the pedigree networks for the California and Cosmopolitan populations. S estimates were limited to parents and offspring with known birth years. Selection cycle lengths are plotted against the midpoint (m) between parent and offspring birth years for California (black points) and Cosmopolitan (gray points) populations. The plotted lines are exponential decay functions fitted by nonlinear regression of S on m. The function for the California population was y=35.06·e0.0090·(x1790.5) (Nagelkerke pseudo-R2 = 0.25; p <0.001). The function for the Cosmopolitan population was y=76.69·e0.0079·(x1736.5) (Nagelkerke pseudo-R2 = 0.08; p <0.001).

Similar articles

Cited by

References

    1. Affymetrix Inc. 2015. Axiom® Genotyping Solution Data Analysis Guide (P/N 702961 Rev. 3). Santa Clara, CA: Affymetrix, Inc..
    1. Ahmadi H, Bringhurst RS, Voth V.. 1990. Modes of inheritance of photoperiodism in Fragaria. J Am Soc Hortic Sci. 115:146–152.
    1. Barabási A-L. 2016. Network Science. Cambridge, UK: Cambridge University Press.
    1. Barabási A-L, Gulbahce N, Loscalzo J.. 2011. Network medicine: a network-based approach to human disease. Nat Rev Genet. 12:56–68. - PMC - PubMed
    1. Bassil NV, Davis TM, Zhang H, Ficklin S, Mittmann M. et al. 2015. Development and preliminary evaluation of a 90K Axiom® SNP array for the allo-octoploid cultivated strawberry Fragaria × ananassa. BMC Genomics. 16:155. - PMC - PubMed

Publication types