Review
. 2021 Dec;28(6):1755-1775.
doi: 10.3758/s13423-021-01908-x. Epub 2021 Mar 26.

Age differences in sustained attention tasks: A meta-analysis

Affiliations
Review

Age differences in sustained attention tasks: A meta-analysis

Antonino Vallesi et al. Psychon Bull Rev. 2021 Dec.

Abstract

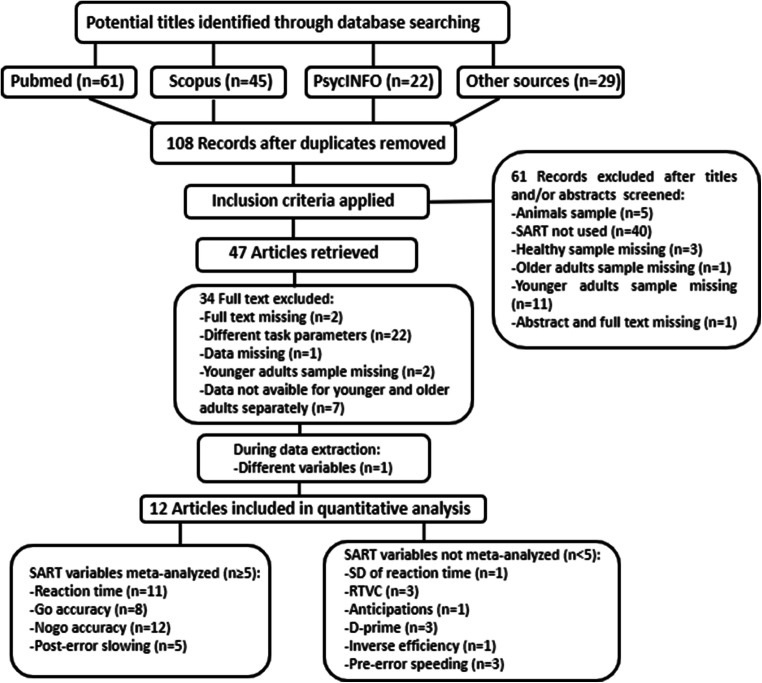
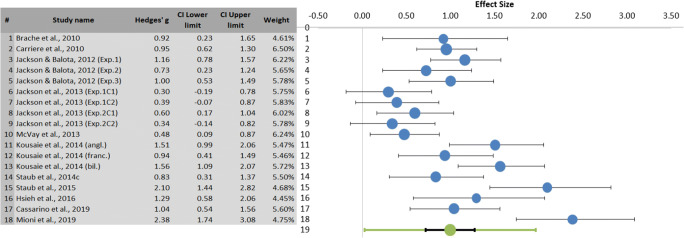
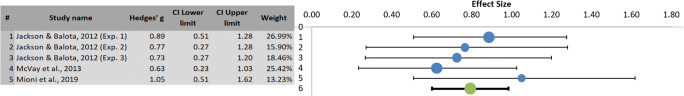
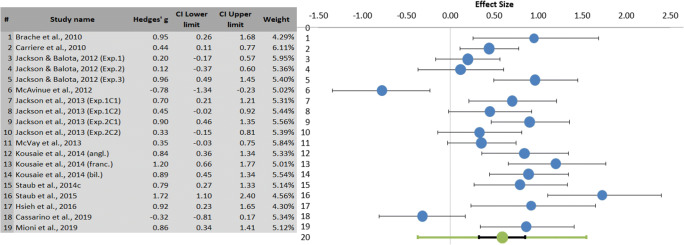
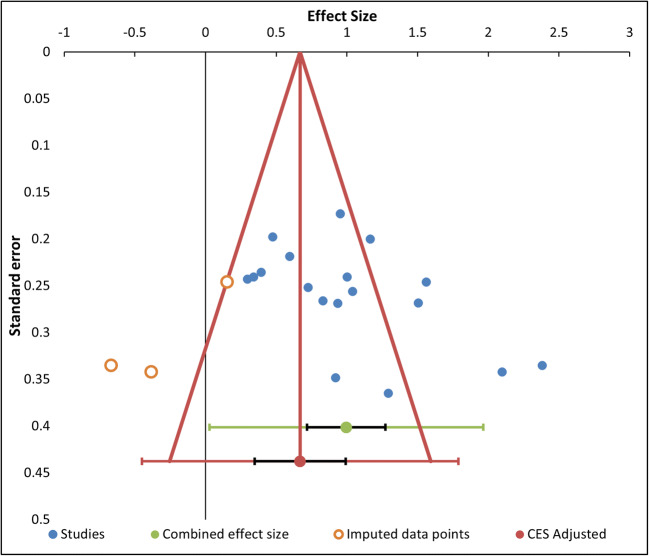
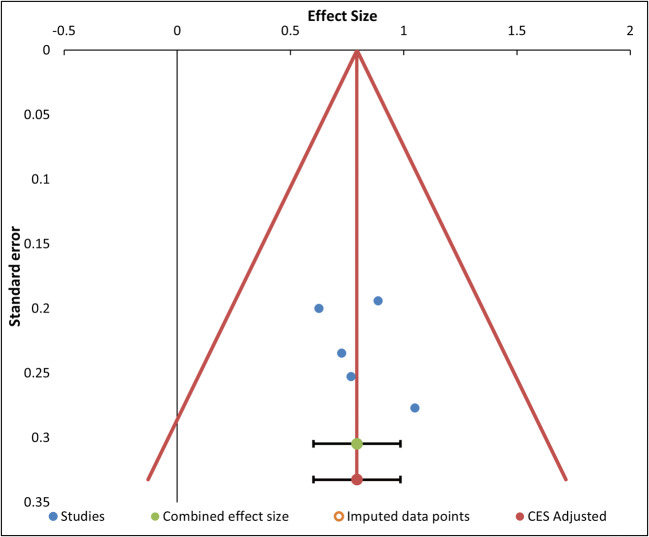
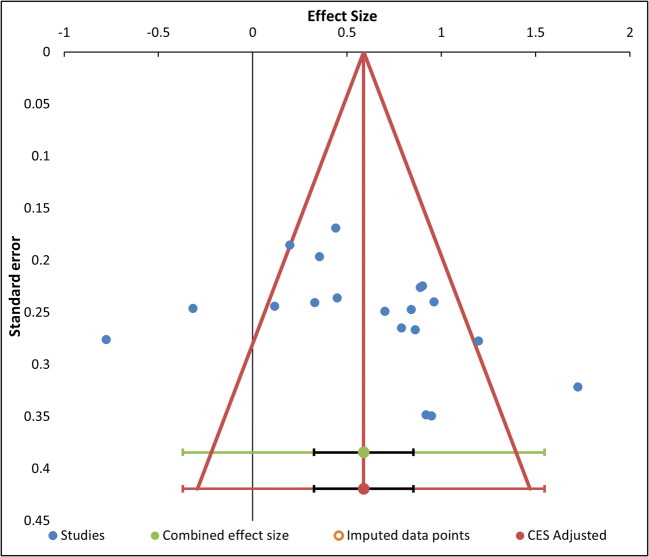
Many aspects of attention decline with aging. There is a current debate on how aging also affects sustained attention. In this study, we contribute to this debate by meta-analytically comparing performance on the go/no-go Sustained Attention to Response Task (SART) in younger and older adults. We included only studies in which the SART had a low proportion of no-go trials (5%-30%), there was a random or quasirandom stimulus presentation, and data on both healthy younger and older adults were available. A total of 12 studies were suitable with 832 younger adults and 690 older adults. Results showed that older adults were slower than younger adults on go trials (g = 1, 95% CI [.72, 1.27]) and more accurate than younger adults on no-go trials (g = .59, 95% CI [.32, .85]). Moreover, older adults were slower after a no-go error than younger adults (g = .79, 95% CI [.60, .99]). These results are compatible with an age-related processing speed deficit, mostly suggested by longer go RTs, but also with an increased preference for a prudent strategy, as demonstrated by fewer no-go errors and greater posterror slowing in older adults. An inhibitory deficit account could not explain these findings, as older adults actually outperformed younger adults by producing fewer false alarms to no-go stimuli. These findings point to a more prudent strategy when using attentional resources in aging that allows reducing the false-alarm rate in tasks producing a tendency for automatic responding.

Keywords: Cognitive aging; Go/no-go; Motor inhibition; SART; Sustained attention; Vigilance.


Figures

Fig. 1
Fig. 1
PRISMA flow diagram of the retrieved articles, evaluated according to the inclusion/exclusion criteria and included in the analysis
Fig. 2
Fig. 2
Left: Summary results of the meta-analysis regarding RT differences between younger and older adults, including Hedges’ g, confidence interval (CI), and relative weight of each study. The weight was computed as the inverse of the within-study variance with an additive estimate of the between-studies variance (T2) based on the DerSimonian-Laird method (Van Rhee et al., 2015), since a random effects model was used. Right: Forest plot showing the effect size (in blue) of each study with its confidence interval (in black) and the combined effect size (in green) with its confidence interval (in black) and its prediction interval (in green). The larger the blue dot, the higher the study weight. The positive effect size shows longer RTs in older adults than in younger adults. (Color figure online)
Fig. 3
Fig. 3
Left: Summary meta-analytical results regarding PES differences between younger and older adults, including Hedges’ g, confidence interval (CI), and relative weight of each study. Weight computation is explained in Fig. 2. Right: Forest plot showing the effect size (in blue) of each study with its confidence interval (in black) and the combined effect size (in green) with its confidence interval (in black) and its prediction interval (in green). The larger the blue dot, the higher the study weight. The positive effect size shows longer RTs after a commission error for older adults than for younger adults. (Color figure online)
Fig. 4
Fig. 4
Left: Summary results of meta-analysis regarding accuracy on no-go trial differences between younger and older adults, including Hedges’ g, confidence interval (CI), and relative weight of each study. Weight computation as in Fig. 2. Right: Forest plot showing the effect size (in blue) of each study with its confidence interval (in black) and the combined effect size (in green) with its confidence interval (in black) and its prediction interval (in green). The larger the blue dot, the higher the study weight. The positive effect size shows higher performance in older adults than in younger adults. (Color figure online)
Fig. 5
Fig. 5
Funnel plot of the studies in the RTs analysis, represented by blue dots, with effect size (x-axis) and standard error (y-axis). There is also the combined effect size (green dot) with its confidence interval (black) and prediction interval (green), and the adjusted effect size (red dot) for imputed data points with the corresponding intervals (black and red, respectively). The adjusted effect size is lower than the original one because it takes into account three missing studies located on the left of the mean effect. (Color figure online)
Fig. 6
Fig. 6
Funnel plot of the studies in the PES analysis, represented by blue dots, with effect size (x-axis) and standard error (y-axis). The plot also reports the combined effect size (green dot) and the adjusted effect size (red dot) with their confidence intervals (black) and prediction intervals (green and red, respectively). The original combined effect size is equal to the adjusted one since the “trim and fill” method found no missing studies. (Color figure online)
Fig. 7
Fig. 7
Funnel plot of the studies in the no-go accuracy analysis, represented by blue dots, with effect size (x-axis) and standard error (y-axis). The combined effect size (green dot) and its adjusted estimate (red dot) are also depicted, with their confidence intervals (black) and prediction intervals (green and red, respectively). The two combined effects are equal since the “trim and fill” algorithm found no evidence of publication bias. (Color figure online)

References

    1. Band GP, Kok A. Age effects on response monitoring in a mental-rotation task. Biological Psychology. 2000;51(2/3):201–221. doi: 10.1016/S0301-0511(99)00038-1. - DOI - PubMed
    1. Bogdanova Y, Yee MK, Ho VT, Cicerone KD. Computerized cognitive rehabilitation of attention and executive function in acquired brain injury: A systematic review. Journal of Head Trauma Rehabilitation. 2016;31(6):419–433. doi: 10.1097/HTR.0000000000000203. - DOI - PMC - PubMed
    1. Borenstein, M., Hedges, L. V., Higgins, J. P., & Rothstein, H. R. (2009). Introduction to meta-analysis. Wiley.
    1. Brache K, Scialfa C, Hudson C. Aging and vigilance: Who has the inhibition deficit? Experimental Aging Research. 2010;36(2):140–152. doi: 10.1080/03610731003613425. - DOI - PubMed
    1. Carriere JSA, Cheyne JA, Solman GJF, Smilek D. Age trends for failures of sustained attention. Psychology and Aging. 2010;25(3):569–574. doi: 10.1037/a0019363. - DOI - PubMed

LinkOut - more resources