. 2021 May 12;30(7):575-594.
doi: 10.1093/hmg/ddab081.

Transgenic mice with an R342X mutation in Phf6 display clinical features of Börjeson-Forssman-Lehmann Syndrome

Affiliations

Transgenic mice with an R342X mutation in Phf6 display clinical features of Börjeson-Forssman-Lehmann Syndrome

Raies Ahmed et al. Hum Mol Genet. .

Abstract

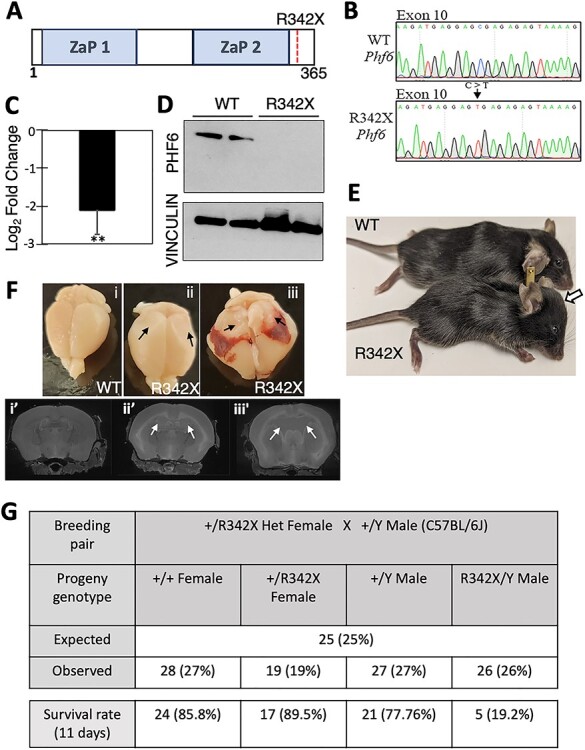
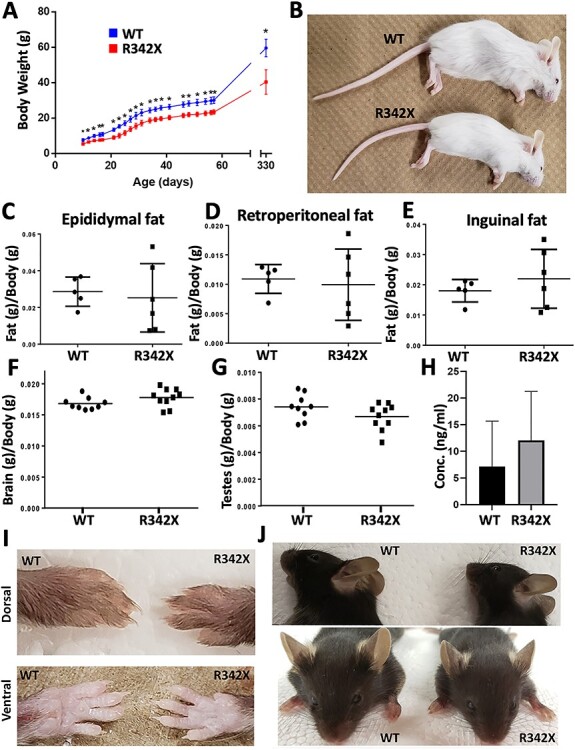
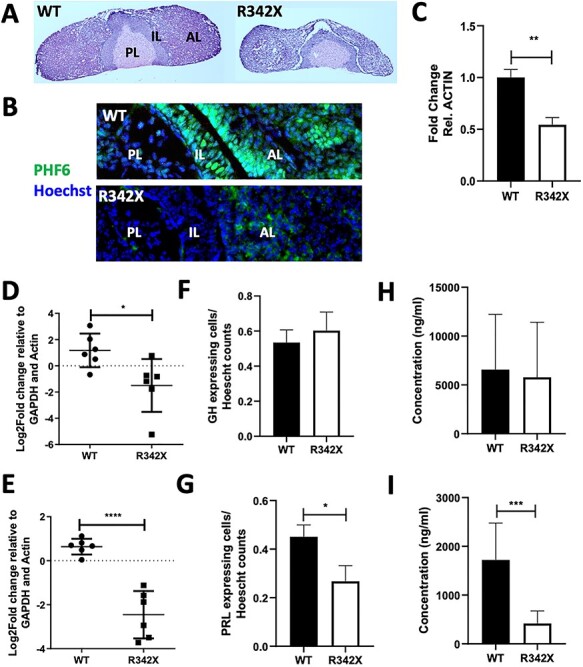
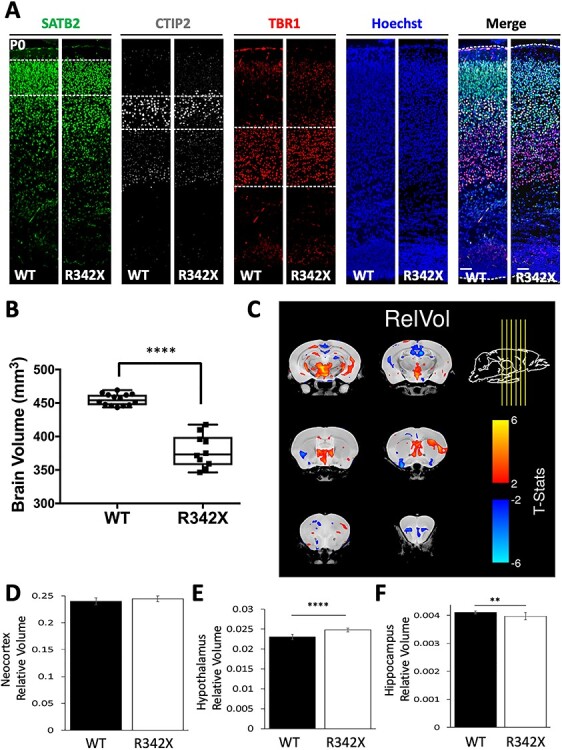
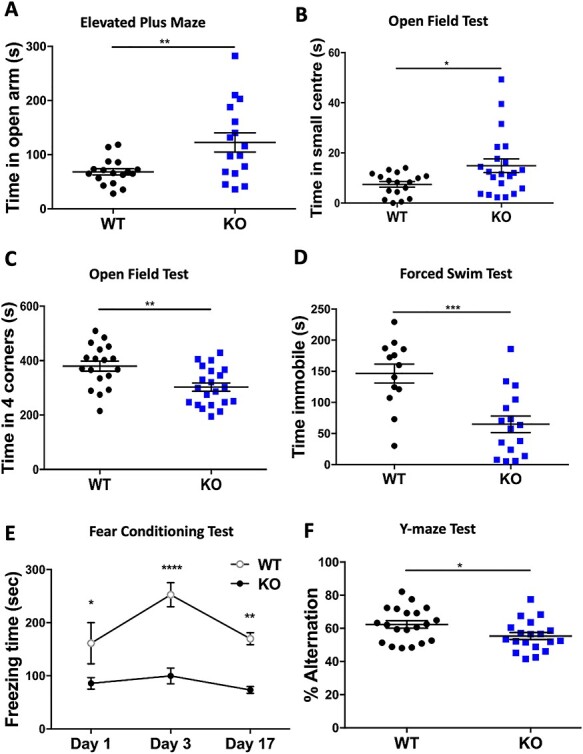
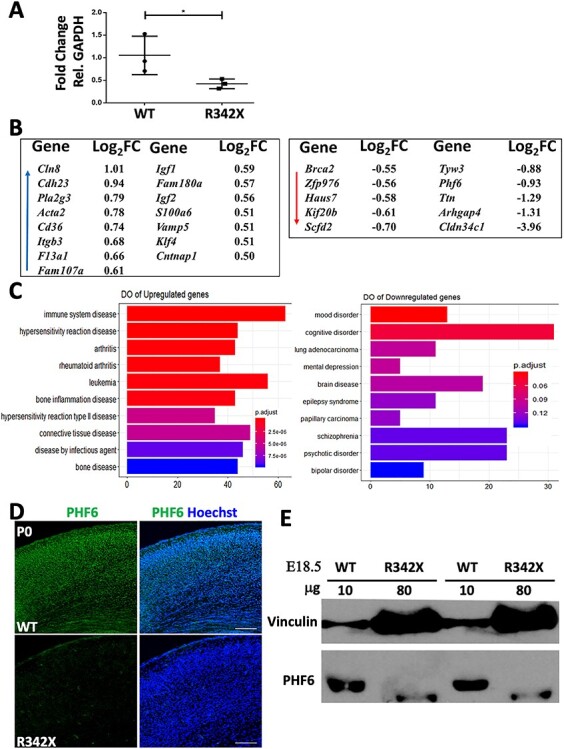
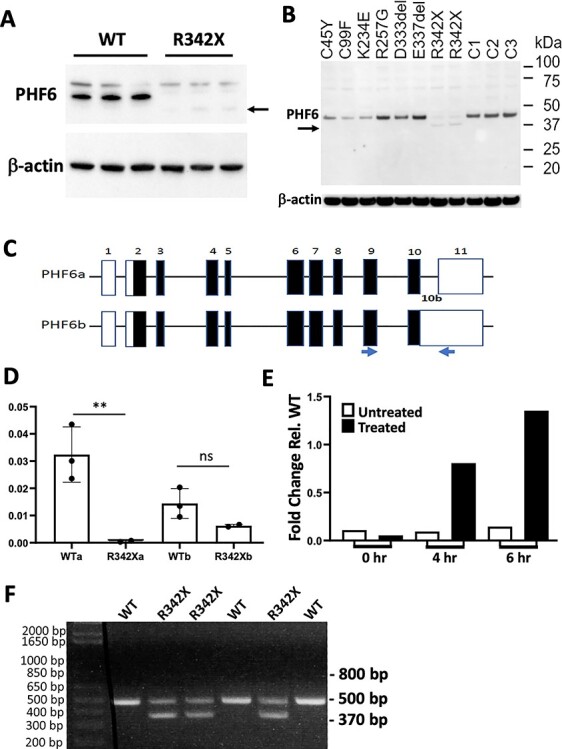
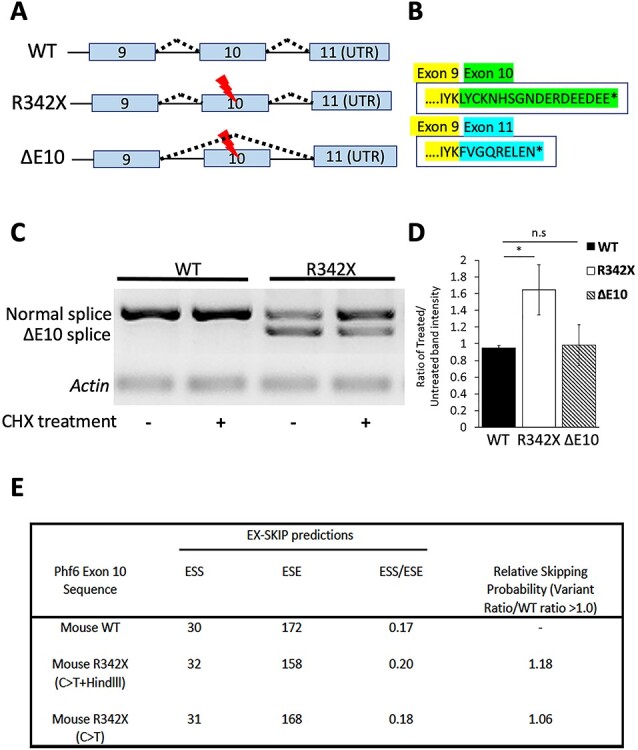
The PHF6 mutation c.1024C > T; p.R342X, is a recurrent cause of Börjeson-Forssman-Lehmann Syndrome (BFLS), a neurodevelopmental disorder characterized by moderate-severe intellectual disability, truncal obesity, gynecomastia, hypogonadism, long tapering fingers and large ears (MIM#301900). Here, we generated transgenic mice with the identical substitution (R342X mice) using CRISPR technology. We show that the p.R342X mutation causes a reduction in PHF6 protein levels, in both human and mice, from nonsense-mediated decay and nonsense-associated alternative splicing, respectively. Magnetic resonance imaging studies indicated that R342X mice had a reduced brain volume on a mixed genetic background but developed hydrocephaly and a high incidence of postnatal death on a C57BL/6 background. Cortical development proceeded normally, while hippocampus and hypothalamus relative brain volumes were altered. A hypoplastic anterior pituitary was also observed that likely contributes to the small size of the R342X mice. Behavior testing demonstrated deficits in associative learning, spatial memory and an anxiolytic phenotype. Taken together, the R342X mice represent a good preclinical model of BFLS that will allow further dissection of PHF6 function and disease pathogenesis.


Figures

Figure 1
Figure 1
Generation of the R342X mice. (A) Schematic diagram of the PHF6 protein highlighting the location of the ZaP domains and the R342X nonsense mutation. (B) DNA sequence traces from the WT and R342X mESCs showing the engineered C to T transition at nucleotide 1024 within exon 10 of the Phf6 gene. (C) Plot of RT-qPCR log2-fold change of Phf6 from the R342X mESCs relative to WT mESCs. **, P < 0.01. (D) Phf6 immunoblot of extracts from WT or R342X mESCs. Vinculin was used as a loading control. (E) Photo of P40 WT and R342X mice on a C57BL/6 background. Arrow indicates dome-shaped head in mutant animal. (F) Dissected brains (top) or MRI scans (bottom) from WT (i) or R342X mice with mild (ii) or severe (iii) hydrocephaly at P100. Black arrows indicate collapsed cortical tissue due to loss of CSF from the enlarged ventricles which are indicated by white arrows in the bottom panel. (G) R342X male mice (C57BL/6) were born at normal Mendelian ratios but only had a 20% survival rate by P11.
Figure 2
Figure 2
Analysis of R342X mice for clinical features of BFLS patients. (A) Weight measurements of a cohort of WT (Blue dots; n = 11) and R342X (Red dots; n = 12) mice were plotted beginning at P10 until P330. At all ages the R342X mice had a statistically significant (*, P < 0.05) reduction in body weight. (B) Image of WT and R342X mice (FVB/N) highlighting the difference in size at P25. (C-E) Plotted ratio of fat/body weight for WT and R342X mice from the epididymal (C), retroperitoneal (D) and inguinal (E) fat deposits. (F) Brain weight to body weight ratio, and (G) testes weight to body weight ratio show no difference between WT and R342X littermates. (H) Testosterone plasma concentration levels in WT and R342X mice. Images of forepaw digits (I) and ears (J) were assessed for morphological features of BFLS.
Figure 3
Figure 3
Pituitary defects observed in R342X mice. (A) H&E-stained sections of P35 pituitary gland isolated form WT and R342X mice. PL, posterior lobe, IL, intermediate lobe; AL, anterior lobe. (B) Immunostained pituitary sections stained for Phf6 (green) and counterstained with Hoechst. (C) RT-qPCR for Phf6 from RNA isolated from P35 pituitary samples of WT and R342X mice. Growth hormone (GH; D, F, H) and Prolactin (PRL; E, G, I) levels were quantified by RT-qPCR for transcript levels from whole pituitary extracts (D, E); for the proportion of immunopositive cells in the anterior pituitary (F, G); and for circulating protein levels in plasma by ELISA (H, I) from WT and R342X mice at P35. *, P < 0.05; ***, P < 0.001; ****, P < 0.0001.
Figure 4
Figure 4
Analysis of corticogenesis and brain volume differences in R342X mice. (A) P0 sections from WT and R342X mice stained for layers II–IV (SATB2, green), layer V (CTIP2) and layer VI (TBR1) neuronal markers demonstrate no differences in cortical lamination. Cell counts are presented in Supplementary Material, Fig. S4. Hoechst served as a nuclear counterstain. (B) Plot of absolute brain volume differences obtained by MRI between WT and R342X animals (P100). (C) Coronal images from six different rostral–caudal locations (indicated by yellow arrows) showing the relative changes in brain volume identified in R342X mice compared with control animals. (D) The neocortex showed no difference in relative volume while statistically significant differences were observed in the hypothalamic (E) and hippocampal (F) brain regions. **, P < 0.01; ****, P < 0.0001.
Figure 5
Figure 5
Behavioral testing of R342X mice. Cohorts of P60 control (WT, black dots) and R342X mice (KO, blue dots) were subjected to a battery of behavior tests. (A) Time spent in the open arms of the EPM. (B) OF test plot of time spent in the small center. (C) OF test plot of time spent in the four corners. (D) FST plot of the time spent immobile. (E) Plot of freezing time for mice in the contextual FC assay 1, 3 and 17 days after training. (F) Y-maze plot of the percentage of alternations between arms. Each dot (blue or black) represents data from a single animal. *, P < 0.05; **, P < 0.01; ***, P < 0.001; ****, P < 0.0001.
Figure 6
Figure 6
Analysis of PHF6 protein and gene expression differences in the P0 cortex. (A) RT-qPCR analysis shows that the R342X mice have reduced Phf6 transcript levels compared with WT littermates (n = 3). RNA levels were normalized to GAPDH expression. *, P < 0.05. (B) List of DEGs (± 0.5 log2 fold change; s-value < 0.005) identified in the R342X P0 cortex. Blue arrow indicates upregulated genes, while red arrow highlights downregulated genes. (C) DO plots of significant disease terms for upregulated (left) and downregulated gene lists (right). (D) Representative image of P0 coronal sections IF stained for PHF6 (green) from WT and R342X mice. Hoechst counterstained nuclei are blue. (E) Immunoblots of E18.5 cortical extracts for PHF6 from WT and R342X mice. Note the increased protein loading in the R342X lanes. Vinculin was used as a protein loading control.
Figure 7
Figure 7
The R342X mutation results in reduced protein levels from NMD of the PHF6a transcript in human samples. (A) Immunoblots of LCLs derived from normal individuals (WT) or BFLS patients with the R342X mutation (R342X) stained with an antibody to PHF6 or β-actin as a loading control. Arrow indicates the position of the truncated PHF6 protein from patients with the R342X mutation. (B) Immunoblot showing comparative protein levels of PHF6 (~ 41 kDa) in BFLS patients and unaffected individuals. Protein expression in BFLS patients carrying the C45Y, C99F, K234E and R342X mutations is reduced while the R257G, D333del and E337del mutations are expressed at a similar level to the three unaffected individuals (C1, C2 and C3). Arrow denotes the band running at approximately 38.5 kDa in the patients with the R342X mutation, which is also present at reduced levels. Antibodies were the same as in (A). (C) Schematic diagram of the PHF6 gene structure comprising the PHF6a and PHF6b transcripts. Blue arrows denote primers used to amplify similar transcripts from the mouse forebrain. (D) A significant reduction in the PHF6a isoform compared with expression in the controls is detected in patients with the p.R342X mutation by RT-qPCR on cDNA derived from RNA extracted from LCL. Expression of the PHF6b isoform is not affected. **, P < 0.01; ns, not significant. (E) Expression of PHF6a isoform with the p.R342X mutation is restored following inhibition of the NMD pathway by treatment of LCL for 6 h with 100 μM cycloheximide. (F) RT-PCR analysis of cDNA derived from mouse forebrain (P0) samples. The primers shown in (C) were used to amplify the murine equivalent of the Phf6a (500 bp) and Phf6b (expected at 800 bp) transcripts. The Phf6b transcript was not observed but a smaller band (370 bp) corresponded to the ΔE10 transcript that splices out exon 10.
Figure 8
Figure 8
Characterization of the novel ΔE10 transcript. (A) Schematic diagram detailing the splicing events that generate the ΔE10 transcript. (B) Skipping of exon 10 generates a distinct PHF6 protein C-terminal isoform (blue amino acids) compared with the expected protein sequence of the R342X mutant protein (green). (C) Primary cortical neurons were treated for 6 h with 100 μM cycloheximide and then analyzed by RT-PCR for the normal and ΔE10 spliced transcripts. Cycloheximide treatment (CHX) increased the level of the normal transcript in the R342X samples. (D) Quantification of the change in transcript levels from cycloheximide treated and untreated samples, as shown in (C). R342X refers to the normally spliced transcript that incudes exon 10 but also has the R342X mutation. *, P < 0.05; ns, not significant. (E) The EX_SKIP tool was used to calculate the ESS and ESE within the WT exon 10 sequence, or exon that contains the C > T transition corresponding to the R342X mutation alone, or the sequence from the R342X mice which also contains an additional mutation that creates a HindII site that was used for genotyping. The ESS/ESE ratios are shown for the three transcripts and the relative exon skipping potential (variant ratio/WT ratio) is also shown. Values > 1.0 indicate an increased potential for alternative splicing.

References

    1. Lower, K.M., Turner, G., Kerr, B.A., Mathews, K.D., Shaw, M.A., Gedeon, A.K., Schelley, S., Hoyme, H.E., White, S.M., Delatycki, M.B.et al. (2002) Mutations in PHF6 are associated with Borjeson-Forssman-Lehmann syndrome. Nat. Genet., 32, 661–665. - PubMed
    1. Borjeson, M., Forssman, H. and Lehmann, O. (1962) An X-linked, recessively inherited syndrome characterized by grave mental deficiency, epilepsy, and endocrine disorder. Acta Med. Scand., 171, 13–21. - PubMed
    1. Turner, G., Gedeon, A., Mulley, J., Sutherland, G., Rae, J., Power, K. and Arthur, I. (1989) Borjeson-Forssman-Lehmann syndrome: clinical manifestations and gene localization to Xq26-27. Am. J. Med. Genet., 34, 463–469. - PubMed
    1. Turner, G., Lower, K.M., White, S.M., Delatycki, M., Lampe, A.K., Wright, M., Smith, J.C., Kerr, B., Schelley, S., Hoyme, H.E.et al. (2004) The clinical picture of the Borjeson-Forssman-Lehmann syndrome in males and heterozygous females with PHF6 mutations. Clin. Genet., 65, 226–232. - PubMed
    1. Visootsak, J., Rosner, B., Dykens, E., Schwartz, C., Hahn, K., White, S.M., Szeftel, R. and Graham, J.M. (2004) Clinical and behavioral features of patients with Borjeson-Forssman-Lehmann syndrome with mutations in PHF6. J. Pediatr., 145, 819–825. - PubMed

Publication types

MeSH terms

Supplementary concepts

Grants and funding