. 2021 Oct;76(10):3028-3040.
doi: 10.1111/all.14832. Epub 2021 May 5.

CytoBas: Precision component-resolved diagnostics for allergy using flow cytometric staining of basophils with recombinant allergen tetramers

Affiliations

CytoBas: Precision component-resolved diagnostics for allergy using flow cytometric staining of basophils with recombinant allergen tetramers

Craig I McKenzie et al. Allergy. 2021 Oct.

Abstract

Background: Diagnostic tests for allergy rely on detecting allergen-specific IgE. Component-resolved diagnostics incorporate multiple defined allergen components to improve the quality of diagnosis and patient care.

Objective: To develop a new approach for determining sensitization to specific allergen components that utilizes fluorescent protein tetramers for direct staining of IgE on blood basophils by flow cytometry.

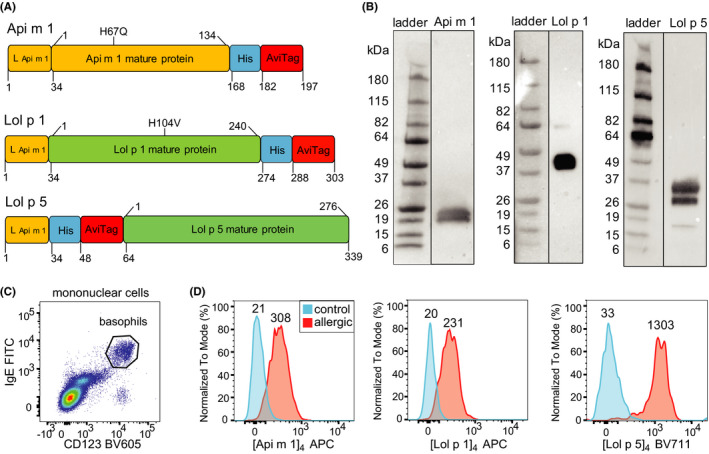
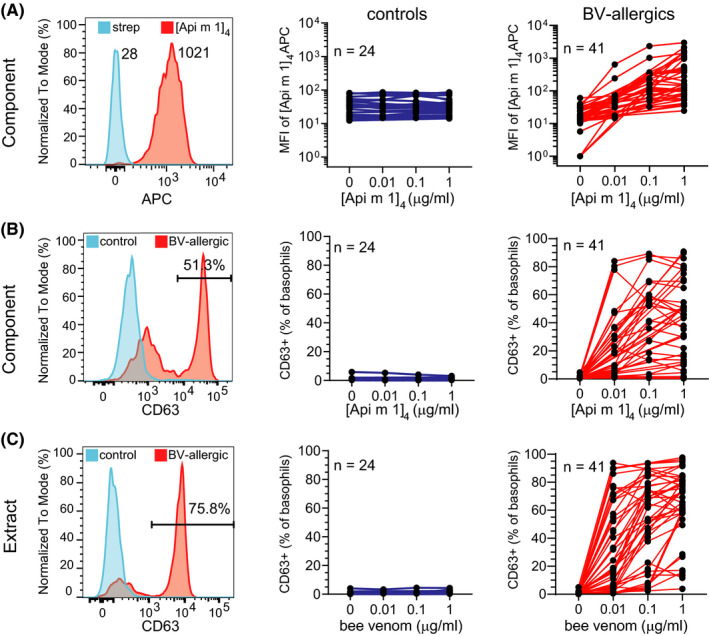
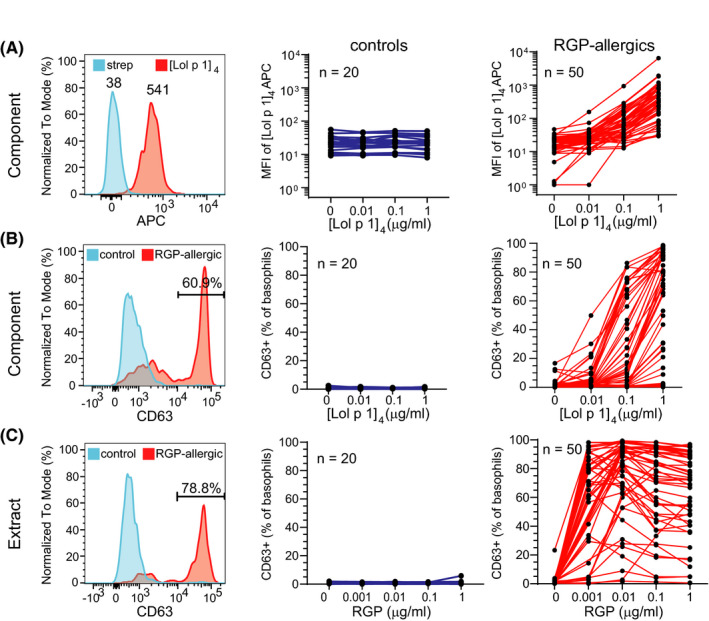
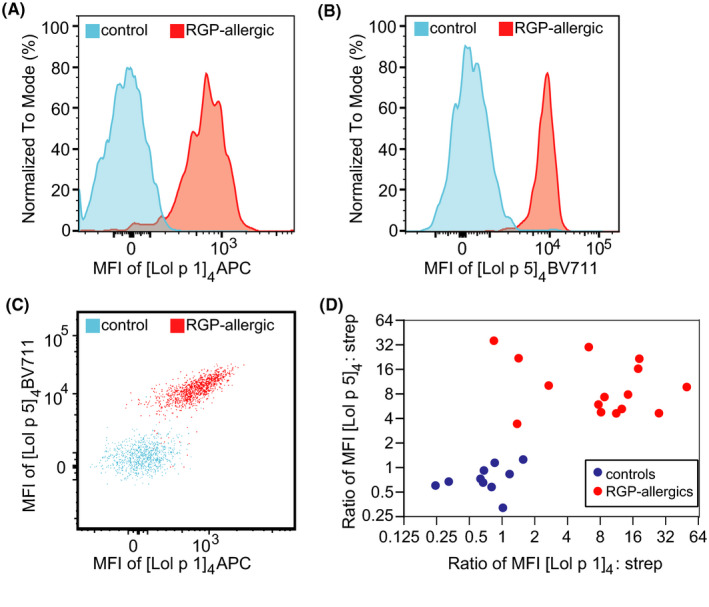
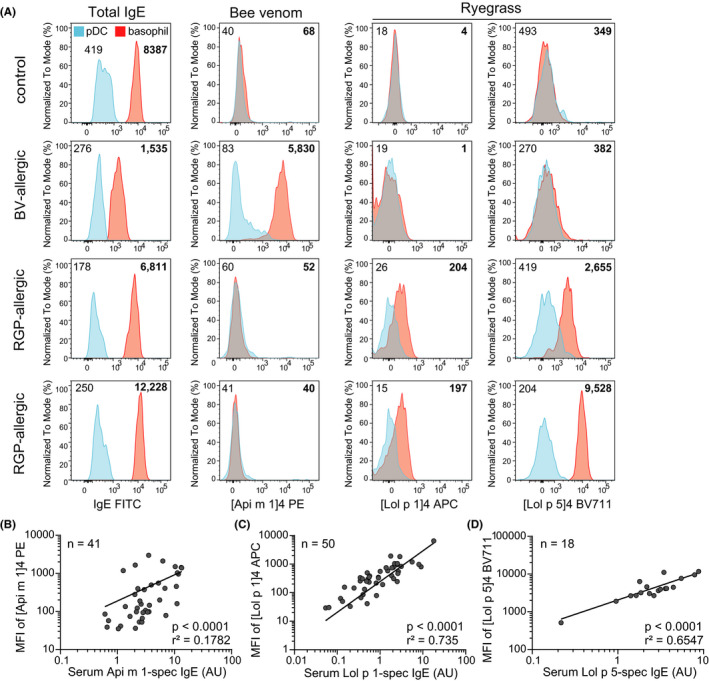
Methods: Recombinant forms of Lol p 1 and Lol p 5 proteins from ryegrass pollen (RGP) and Api m 1 from honeybee venom (BV) were produced, biotinylated, and tetramerized with streptavidin-fluorochrome conjugates. Blood samples from 50 RGP-allergic, 41 BV-allergic, and 26 controls were incubated with fluorescent protein tetramers for flow cytometric evaluation of basophil allergen binding and activation.

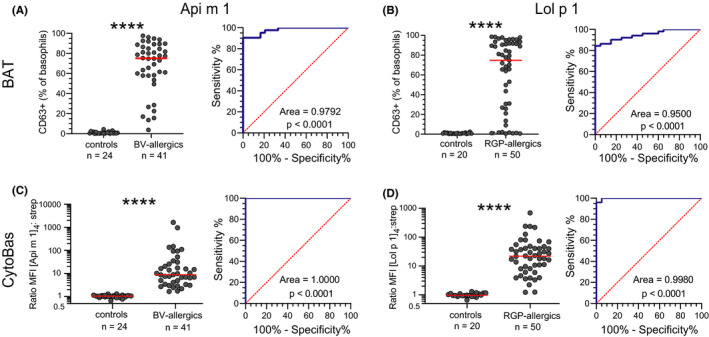
Results: Allergen tetramers bound to and activated basophils from relevant allergic patients but not controls. Direct fluorescence staining of Api m 1 and Lol p 1 tetramers had greater positive predictive values than basophil activation for BV and RGP allergy, respectively, as defined with receiver operator characteristics (ROC) curves. Staining intensities of allergen tetramers correlated with allergen-specific IgE levels in serum. Inclusion of multiple allergens coupled with distinct fluorochromes in a single-tube assay enabled rapid detection of sensitization to both Lol p 1 and Lol p 5 in RGP-allergic patients and discriminated between controls, BV-allergic, and RGP-allergic patients.

Conclusion: Our novel flow cytometric assay, termed CytoBas, enables rapid and reliable detection of clinically relevant allergic sensitization. The intensity of fluorescent allergen tetramer staining of basophils has a high positive predictive value for disease, and the assay can be multiplexed for a component-resolved and differential diagnostic test for allergy.

Keywords: allergen tetramers; basophils; component-resolved diagnostics; flow cytometry; surface IgE.


Conflict of interest statement

MCvZ, ROH, and PMH are inventors on a patent application related to this work. All the other authors declare that they have no relevant conflicts of interest.

Figures

FIGURE 1
FIGURE 1
Detection of allergen sensitization by quantifying binding of fluorescent allergen components of BV and RGP to basophils. A) Schematic diagram of DNA constructs for generation of the recombinant allergens Api m 1, Lol p 1, and Lol p 5. Recombinant allergens contained mutations to render the catalytic site inactive (Api m 1 H67Q, Lol p 1 H104V). Leader peptide and spacer (L); 6‐histidine tag (His); avidin tag (AviTag). B) Western blots of recombinant allergens detected with anti‐His antibody. C) Representative flow plot for detection of circulating basophils (CD123+IgE+) within gated mononuclear cells (Figure S1). D) Histograms depicting representative fluorescent staining of Api m 1, Lol p 1, and Lol p 5 tetramers on basophils from relevant allergic patients (red) and controls (blue). Values above the histograms represent median fluorescence intensity values of the population.
FIGURE 2
FIGURE 2
Recombinant Api m 1 binds basophils from BV‐allergic patients in a dose‐dependent manner and induces basophil activation. A) Representative staining of basophils from blood of a BV‐allergic patient stimulated with [Api m 1]4‐APC (red) or streptavidin‐APC (blue)—left plot. Median fluorescence intensity (MFI) of basophils from controls (blue; middle) and BV‐allergic subjects (red; right) following incubation with 1 µg/ml streptavidin‐APC (“0”) or 0.01, 0.1, and 1 µg/ml [Api m 1]4‐APC. B) Representative histogram of CD63 staining on basophils (left), and frequencies of basophils from controls (middle) and BV‐allergic patients (right) expressing CD63 following stimulation with streptavidin‐APC or increasing concentrations of [Api m 1]4‐APC. C) Representative histogram of CD63 staining on basophils (left), and frequencies of basophils from controls (middle) and BV‐allergic patients (right) expressing CD63 following stimulation with increasing concentrations of BV extract.
FIGURE 3
FIGURE 3
Recombinant Lol p 1 binds basophils from RGP‐allergic patients in a dose‐dependent manner and induces basophil activation. A) Left plot, representative staining of basophils from blood of a RGP‐allergic patient stimulated with [Lol p 1]4‐APC (red) or streptavidin‐APC (blue). Median fluorescence intensity (MFI) of basophils from controls (blue; middle) and RGP‐allergic subjects (red; right) following incubation with 1 µg/ml streptavidin‐APC (“0”) or 0.01, 0.1, and 1 µg/ml [Lol p 1]4‐APC.B) Representative histogram of CD63 staining on basophils (left), and frequencies of basophils from controls (middle) and RGP‐allergic patients (right) expressing CD63 following stimulation with streptavidin‐APC or increasing concentrations of [Lol p 1]4. C) Representative histogram of CD63 staining on basophils (left), and frequencies of basophils from controls (middle) and RGP‐allergic patients (right) expressing CD63 following stimulation with increasing concentrations of RGP extract.
FIGURE 4
FIGURE 4
Sensitivity and specificity of BAT and CytoBas for allergy. A) Frequencies of CD63+ basophils following in vitro stimulation with [Api m 1]4 (left) and receiver operator characteristics (ROC) curve of CD63 positivity (right). For each individual, the highest frequency was selected from the serial dilutions in Figure 2B. B) Frequencies of CD63+ basophils following in vitro stimulation with [Lol p 1]4 and ROC curve of CD63 positivity (right). For each individual, the highest frequency was selected from the serial dilutions in Figure 3B. C) Staining intensities as ratio of [Api m 1]4‐APC/streptavidin‐APC on basophils (left) and ROC curve of [Api m 1]4 staining intensity (right). D) Staining intensities as ratio of [Lol p 1]4‐APC/streptavidin‐APC on basophils (left) and ROC curve of [Lol p 1]4 staining intensity (right). Statistics for CD63+ frequencies and allergen tetramer stains, Mann‐Whitney U test; for ROC curves, Wilson/Brown method to test whether the confidence level of the outcome distribution is greater than 95%. **** p < 0.0001.
FIGURE 5
FIGURE 5
Multiplex flow cytometry using multiple allergen tetramers in a single tube as a component‐resolved diagnostic test for allergy. A, B) Representative histograms of basophils from thawed PBMC of a control (blue) or an RGP‐allergic patient (red) stained with Lol p 1 and Lol p 5 tetramers in a single tube. C) 2D dot plot of Lol p 1 and Lol p 5 tetramer staining of the basophils from the control and patient in panels A and B. D) Scatterplot depicting MFI ratios of allergen:streptavidin for [Lol p 1]4‐APC vs strep‐APC and [Lol p 5]4‐BV711 vs strep‐BV711 on basophils from controls (blue, n = 10) and RGP‐allergic subjects (red, n=15) stained with both allergen tetramers or both streptavidin conjugates in a single tube.
FIGURE 6
FIGURE 6
Multiplex flow cytometry distinguishes between different allergic sensitizations with a single tube. A) Representative histograms of [Lol p 1]4, [Lol p 5]4, or [Api m 1]4 MFI on pDCs (blue) and basophils (red) from thawed PBMC of controls, BV‐allergic and RGP‐allergic patients. Numbers accompanying histograms denote MFI (non‐bolded indicate pDCs; bolded indicate basophils). Scatterplots depicting correlation between serum levels of allergen‐specific IgE and MFI of allergen tetramers on basophils stained with B) Api m 1 C) Lol p 1 and D) Lol p 5 allergen tetramers. AU, arbitrary units. Significance and r‐squared (r2) of correlation determined by linear regression.

Similar articles

Cited by

References

    1. van Zelm MC, McKenzie CI, Varese N, Rolland JM, O'Hehir RE. Recent developments and highlights in immune monitoring of allergen immunotherapy. Allergy 2019;74(12):2342‐2354. - PubMed
    1. Valenta R, Karaulov A, Niederberger V, et al. Allergen extracts for in vivo diagnosis and treatment of allergy: is there a future? J Allergy Clin Immunol Pract. 2018;6(6):1845‐1855.e1842. - PMC - PubMed
    1. Carnés J, Iraola V, Cho SH, Esch RE. Mite allergen extracts and clinical practice. Ann Allergy Asthma Immunol 2017;118(3):249‐256. - PubMed
    1. Codina R, Lockey RF. Pollen used to produce allergen extracts. Ann Allergy Asthma Immunol 2017;118(2):148‐153. - PubMed
    1. Frick M, Fischer J, Helbling A, et al. Predominant Api m 10 sensitization as risk factor for treatment failure in honey bee venom immunotherapy. J Allergy Clin Immunol Pract. 2016;138(6):1663‐1671.e9. - PubMed

Publication types