. 2021 Dec;15(12):3280-3298.
doi: 10.1002/1878-0261.12953. Epub 2021 May 1.

Immune modulation underpins the anti-cancer activity of HDAC inhibitors

Affiliations

Immune modulation underpins the anti-cancer activity of HDAC inhibitors

Wiktoria Blaszczak et al. Mol Oncol. 2021 Dec.

Abstract

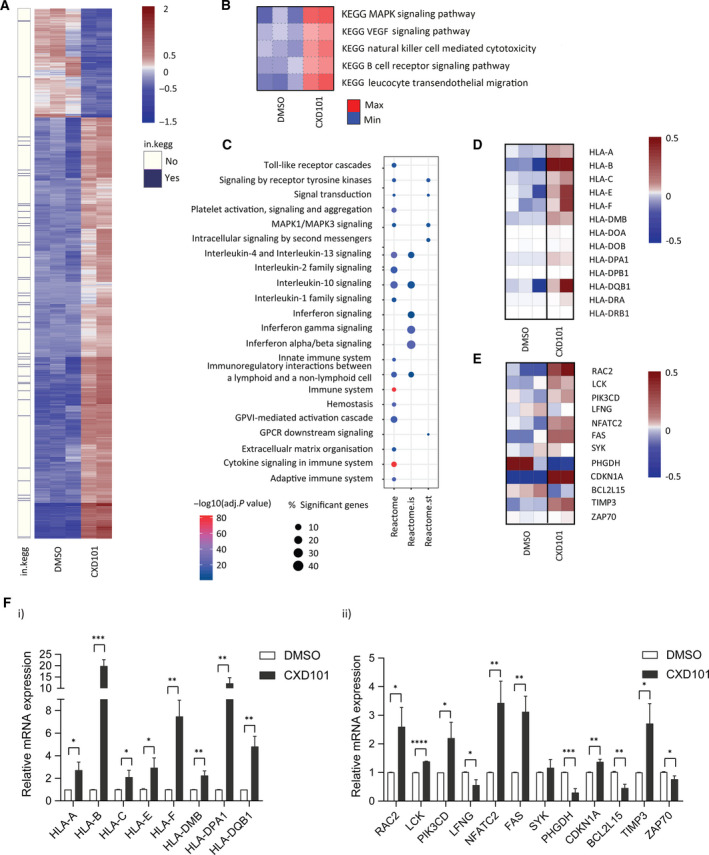
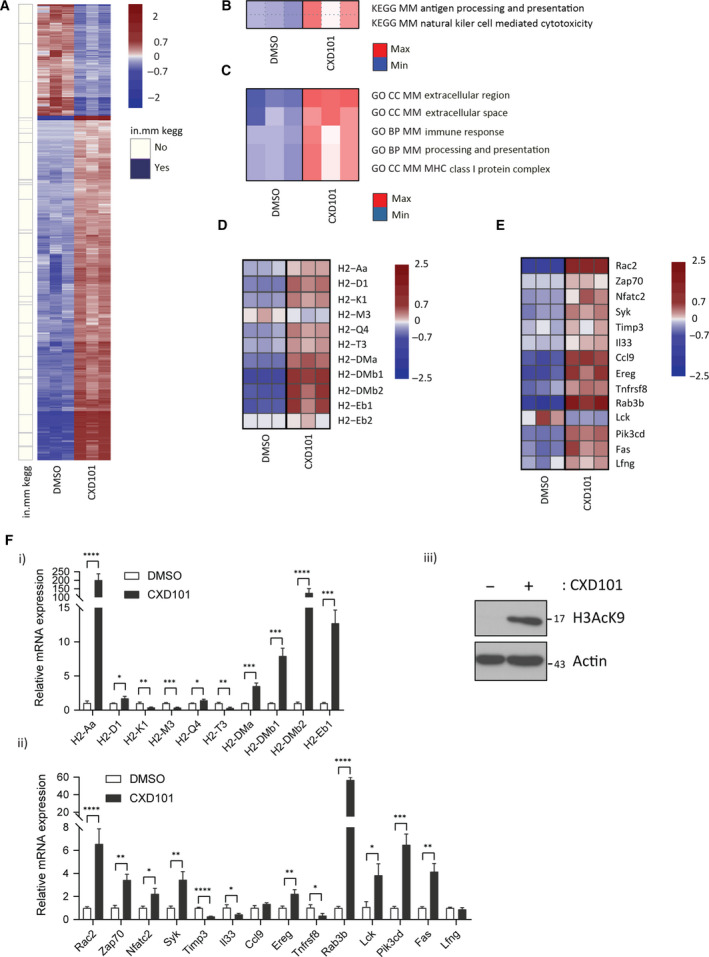
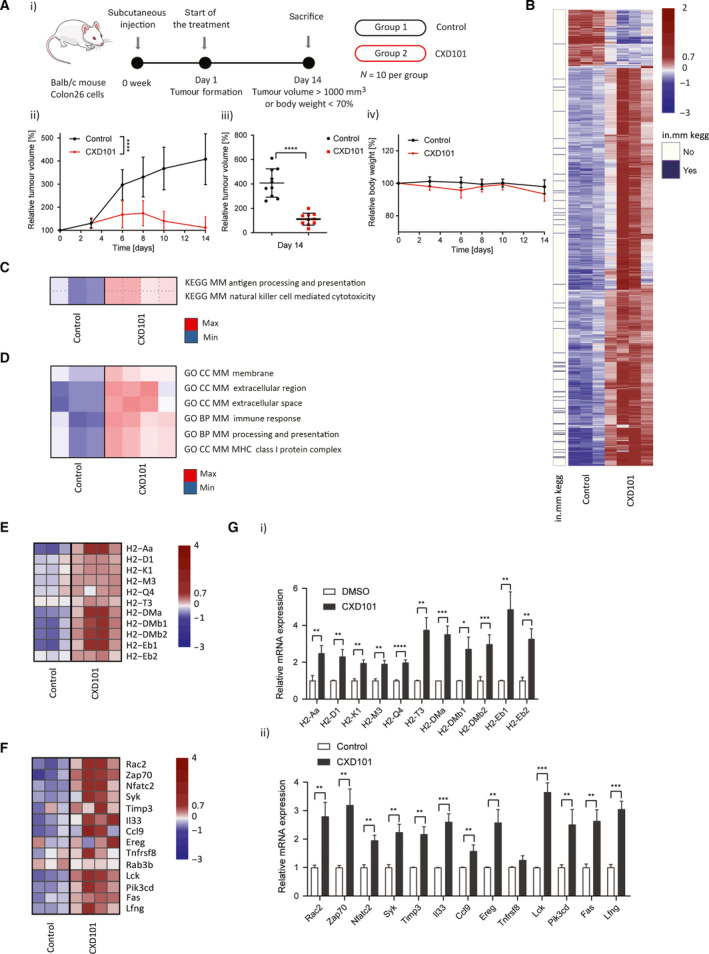
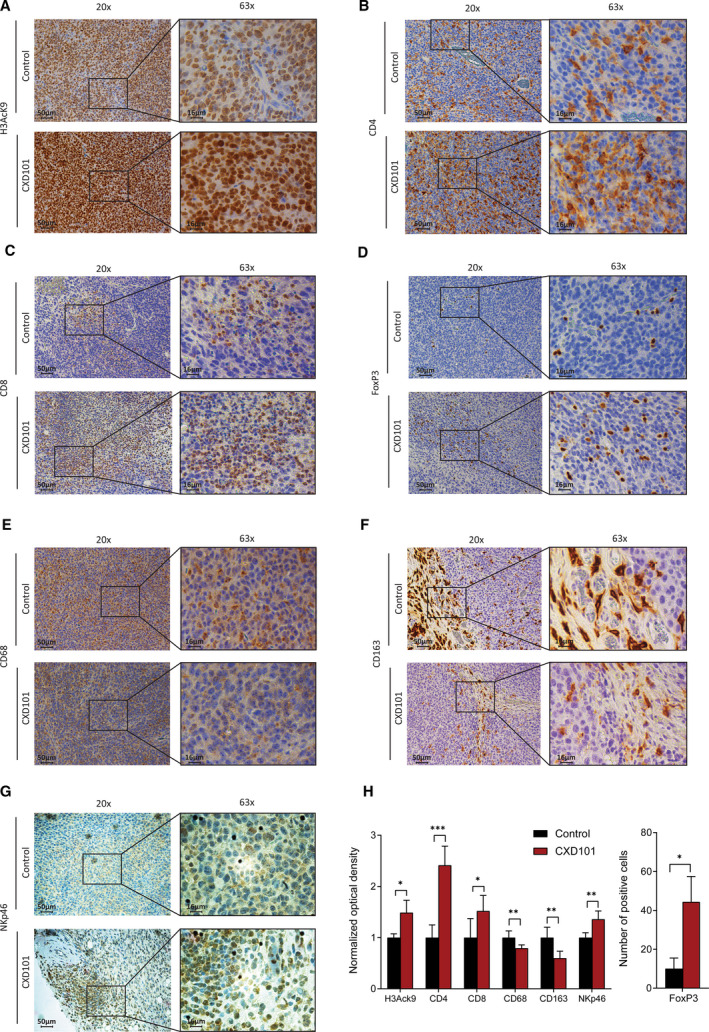
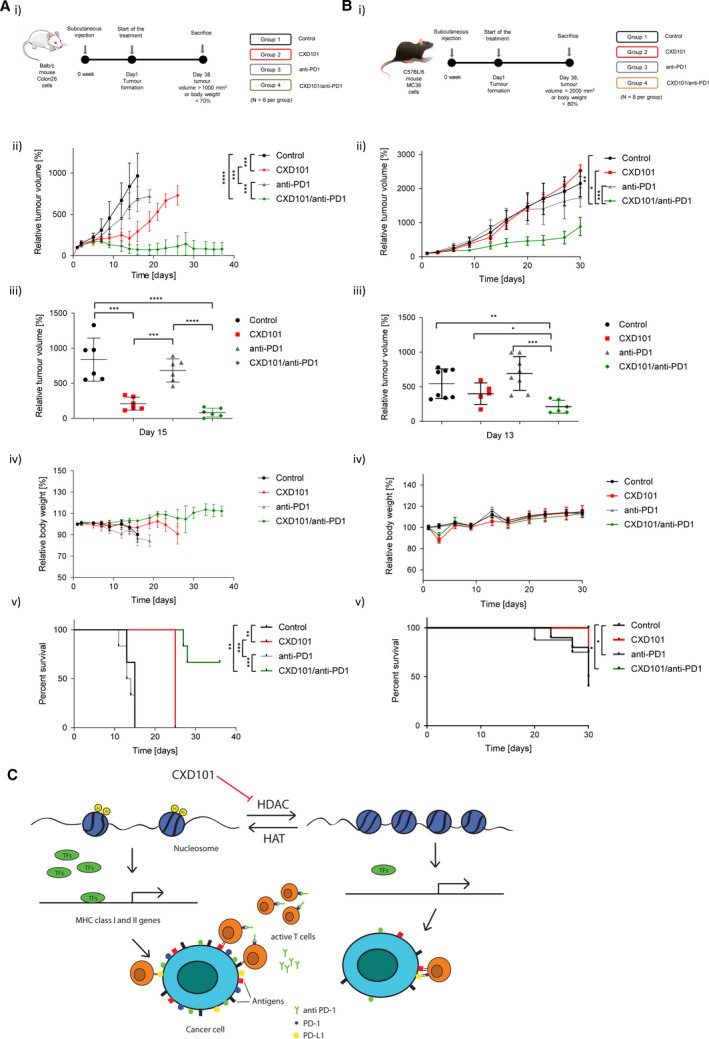
Aberrant protein acetylation is strongly linked to tumorigenesis, and modulating acetylation through targeting histone deacetylase (HDAC) with small-molecule inhibitors has been the focus of clinical trials. However, clinical success on solid tumours, such as colorectal cancer (CRC), has been limited, in part because the cancer-relevant mechanisms through which HDAC inhibitors act remain largely unknown. Here, we have explored, at the genome-wide expression level, the effects of a novel HDAC inhibitor CXD101. In human CRC cell lines, a diverse set of differentially expressed genes were up- and downregulated upon CXD101 treatment. Functional profiling of the expression data highlighted immune-relevant concepts related to antigen processing and natural killer cell-mediated cytotoxicity. Similar profiles were apparent when gene expression was investigated in murine colon26 CRC cells treated with CXD101. Significantly, these changes were also apparent in syngeneic colon26 tumours growing in vivo. The ability of CXD101 to affect immune-relevant gene expression coincided with changes in the tumour microenvironment (TME), especially in the subgroups of CD4 and CD8 tumour-infiltrating T lymphocytes. The altered TME reflected enhanced antitumour activity when CXD101 was combined with immune checkpoint inhibitors (ICIs), such as anti-PD-1 and anti-CTLA4. The ability of CXD101 to reinstate immune-relevant gene expression in the TME and act together with ICIs provides a powerful rationale for exploring the combination therapy in human cancers.

Keywords: HDAC inhibitors; checkpoints inhibitors; immunotherapy; tumour microenvironment.


Conflict of interest statement

The authors declare no conflict of interest.

Figures

Fig. 1
Fig. 1
Genome‐wide analysis on CXD101‐treated SW620 cells. (A) Heat map of differential gene expression. The heat map shows 1192 significantly DEGs between CXD101‐treated cells (1 µm for 48 h; n = 2) and DMSO control (n = 3). Normalised rlog‐transformed gene expression values corresponding to significantly expressed genes (FDR < 0.01 and |log2(FC)| > 1 were mean‐centred by rows. Each row of the heat map represents transformed expression values of one DEG across all samples (blue, low expression; red, high expression). Genes associated with immune system‐related KEGG (in.kegg), pathways revealed with PGSEA (see panel B) are indicated in violet on a separate panel on the left of the heat map (see also Dataset S1). (B) Immune system‐related KEGG concepts encompassing pathways associated with significant differences in expression change upon CXD101 treatment in SW620 cell line. Heat maps show PGSEA statistic (Z‐score), which characterises how much the mean of the fold changes for genes in a certain pathway deviates from the mean observed in all the genes between CXD101 treatment (n = 2) and the control (DMSO, n = 3) groups. Blue indicates gene sets with decreased expression, while red corresponds to those with increased. (C) Gene enrichment analyses (pi/xgr r package) on preranked significantly DEG lists showing enriched Reactome pathways, and specifically Reactome immune system (reactome.is) and Reactome signal transduction (reactome.st) pathways. Gene ranking was performed using data sets provided and strategies implemented in xgr package. (D) Heat map showing significantly DEGs associated with Reactome immune system, referred to as the AP signature. Gene expression values were calculated as described above (see panel C). (E) Heat map of differential expression showing significantly DEGs associated with ‘Natural Killer Cell‐Mediated Cytotoxicity’ KEGG pathway. Gene expression values were transformed as described above (see panel A). (F) qRT‐PCR validation of genes identified in panels D and E (i and ii, respectively) in SW620 cells treated for 2 days with 1 µm CXD101 or DMSO control (Student's t‐test; *P < 0.05, error bars indicate SD); an immunoblot of SW620 cells showing the acetylation mark (H3K14) is shown in Fig. S1A(i).
Fig. 2
Fig. 2
Genome‐wide analysis on CXD101‐treated colon26 cells. (A) Heat map of differential gene expression observed in colon26 cells. The heat map shows 2514 significantly DEGs between CXD101‐treated (2.7 µm for 72 h) and control (DMSO) colon26 cells. Normalised rlog‐transformed gene expression values corresponding to significantly expressed genes (FDR < 0.01 and |log2(FC)| > 1 were mean‐centred by rows. Each row of the heat map represents transformed expression values of one DEG across all samples (blue, low expression; red, high expression). Genes associated with immune system‐related KEGG pathways (see panel (B)) are indicated in violet on a separate panel (in.mm kegg) on the left of the heat map (see also Dataset S2); n = 3. (B) Significantly over‐represented KEGG concepts encompassing pathways associated with significant differences in expression change upon CXD101 treatment in colon26 cells. Heat maps show PGSEA statistic (Z‐score), which characterises how much the mean of the fold changes for genes in a certain pathway deviates from the mean observed in all the genes between CXD101 treatment and the control (DMSO) groups. Blue indicates gene sets with decreased expression, while red corresponds to those with increased; n = 3. (C) Significantly over‐represented GO terms encompassing biological processes or cellular components associated with significant differences in expression change upon CXD101 treatment in colon26 cells. Heat maps show PGSEA statistic (Z‐score), which characterises how much the mean of the fold changes for genes in a certain pathway deviates from the mean observed in all the genes between CXD101 treatment and the control (DMSO) groups. Blue indicates gene sets with decreased expression, while red corresponds to those with increased; n = 3. (D) Gene expression heat map showing significantly DEGs associated with ‘Antigen processing and presentation’ KEGG pathway, referred to as AP signature. Gene expression values were transformed using approach outlined above (see panel A). (E) Heat map of differential expression showing significantly DEGs associated with ‘Natural Killer Cell‐Mediated Cytotoxicity’ KEGG pathway, referred to as NK signature. Gene expression values were transformed using approach outlined above (see panel A). (F) qRT‐PCR of genes identified in panels D and E (i and ii, respectively) in colon26 cells treated for 3 days with 2.7 µm CXD101 or DMSO control (Student's t‐test; *P < 0.05, error bars indicate SD); (iii) an immunoblot of colon26 cells is included to demonstrate input protein levels for H3acK9; actin included as a loading control; n = 3.
Fig. 3
Fig. 3
Genome‐wide analysis on CXD101‐treated colon26 tumours. (A) Schematic representation of the experiment with CXD101 in colon26 tumours (i). Balb/c mice were treated with orally administrated CXD101 at 50 mg·kg−1 for 14 days with respect to vehicle‐only control; n = 10 per group; (ii) relative tumour growth volume in CXD101‐treated and nontreated Balb/c mice presented as a mean value (Student's t‐test of the values at day 14; *P < 0.05); (iii) scatter plots of relative tumour volume of individual mouse at day 14 (t‐test; *P < 0.05); (iv) relative body weight representation of CXD101‐treated and nontreated Balb/c mice presented as a mean value. (B) Heat map of differential expression. The heat map shows 1036 significantly DEGs between CXD101‐treated (n = 4) and control (n = 3) colon26 syngeneic tumour samples. Normalised rlog‐transformed gene expression values corresponding to significantly expressed genes (FDR < 0.01 and |log2(FC)| > 1 were mean‐centred by rows). Each row of the heat map represents transformed expression values of one DEG across all samples (blue, low expression; red, high expression). Genes associated with immune system‐related KEGG pathways (see panel (C)) are indicated in violet on a separate panel (in.mm kegg) on the left of the heat map (see also Dataset S3). (C) Significantly over‐represented KEGG concepts encompassing pathways associated with significant differences in expression change upon CXD101 treatment of the tumours. Heat maps show PGSEA statistic (Z‐score), which characterises how much the mean of the fold changes for genes in a certain pathway deviates from the mean observed in all the genes between CXD101 treatment (n = 4) and the control (DMSO, n = 3) groups. Blue indicates gene sets with decreased expression, while red corresponds to those which were increased. (D) Significantly over‐represented GO terms encompassing biological processes or cellular components associated with significant differences in expression change upon CXD101 treatment of the tumours. Heat maps show PGSEA statistic (Z‐score), which characterises how much the mean of the fold changes for genes in a certain pathway deviates from the mean observed in all the genes between CXD101 treatment (n = 4) and the control (DMSO, n = 3) groups. Blue indicates gene sets with decreased expression, while red corresponds to those with increased. (E) Gene expression heat map showing significantly DEGs associated with ‘Antigen processing and presentation’ KEGG pathway, the AP signature. Gene expression values were transformed using approach outlined above (see panel B). (F) Heat map of differential expression showing significantly DEGs associated with ‘Natural Killer Cell‐Mediated Cytotoxicity’ KEGG pathway, the NK signature. Gene expression values were transformed using approach outlined above (see panel B). (G) qRT‐PCR validation of genes identified in panels E and F (i and ii, respectively) in colon26 syngeneic tumour RNA treated for 14 days with 50 mg·kg−1 CXD101 or DMSO control; n = 3 (Student's t‐test; *P < 0.05, error bars indicate SD).
Fig. 4
Fig. 4
CXD101 affects the TME of colon26 tumours. (A) Representative examples of immunohistochemical staining of H3AcK9 in colon26 tumours collected from Balb/c mice at 14 days treated with 50 mg·kg−1 CXD101 and nontreated control (see experiment in Fig. 3A). Original magnification: 20×, scale bar, 50 μm; and 63×; scale bar, 16 μm. n = 4. (B) As above, but immunohistochemical staining was performed with anti‐CD4. (C) As above, but immunohistochemical staining was performed with anti‐CD8. (D) As above, but immunohistochemical staining was performed with anti‐FoxP3. (E) As above, but immunohistochemical staining was performed with anti‐CD68 gene. (F) As above, but immunohistochemical staining was performed with anti‐CD163. (G) As above, but immunohistochemical staining was performed with anti‐NKp46. (H) Results were quantified by imagej fiji software, and normalised optical density was presented as a mean ± SD. In case of Tregs (FoxP3), results were presented as an absolute number of positive cells. Statistical analysis was performed using two‐tailed, unpaired Student's t‐test with graphpad prism 8 software, n = 4.
Fig. 5
Fig. 5
Treatment of colon26 tumours with CXD101 and anti‐PD‐1. (A) Schematic representation of the experiment with CXD101 in colon26 tumours (i). Balb/c mice were treated with orally administrated CXD101 (50 mg·kg−1; 5‐day on/2‐day off schedule) for 38 days or the vehicle‐only control. Additionally, group 3 was treated with anti‐mPD‐1 monotherapy administered intraperitoneally, twice weekly at a dose level of 5 mg·kg−1. Group 4 received a combination of CXD101 with anti‐mPD‐1; n = 6; (ii) scatter plots of relative tumour volume of individual mice at day 15 (Student's t‐test; *P < 0.05); n = 6; (iii) relative growth analysis of treated and nontreated tumours (Student's t‐test of the values at day 15; *P < 0.05); n = 8 (iv) relative body weight representation of treated and nontreated mice; n = 6; (v) survival curves of treated and nontreated mice (log‐rank [Mantel–Cox] test; *P < 0.05); n = 6. (B) Schematic representation of mouse experiment with CXD101 in MC38 tumours (i). C57BL/6 mice were treated with orally administrated CXD101 (50 mg·kg−1; 5‐day on/2‐day off schedule) for 38 days (n = 6) or the vehicle‐only control (n = 8). Group 3 mice were treated with anti‐mPD‐1 monotherapy (n = 8), administered intraperitoneally twice per week (10 mg·kg−1; days 1, 6, 11, 16, 21 and 26). Group 4 received a combination of CXD101 and anti‐mPD‐1; n = 6; (ii) scatter plots of relative tumour volume of individual mouse at day 13 (Student's t‐test; *P < 0.05); (iii) relative tumour growth analysis of treated and nontreated mice presented as a mean value (Student's t‐test of the values at day 13; *P < 0.05); (iv) relative body weight of treated and nontreated mice presented as a mean value; (v) survival curves of treated and nontreated mice (log‐rank (Mantel–Cox) test; *P < 0.05). (C) Model hypothesis for the effect of HDAC inhibition in regulating the immune response to tumours. It is proposed that inhibition of histone deacetylases induces expression of MHC genes and thereby increases antigen presentation, which together with the release of T cells from immune checkpoint inhibition with anti‐PD‐1 contributes to improved T‐cell engagement via MHC class I and improved tumour cell killing.

Similar articles

Cited by

References

    1. Roth SY, Denu JM & Allis CD (2001) Histone acetyltransferases. Annu Rev Biochem 70, 81–120. - PubMed
    1. Seto E & Yoshida M (2014) Erasers of histone acetylation: the histone deacetylase enzymes. Cold Spring Harb Perspect Biol 6, a018713. - PMC - PubMed
    1. Marmorstein R & Zhou MM (2014) Writers and readers of histone acetylation: structure, mechanism, and inhibition. Cold Spring Harb Perspect Biol 6, a018762. 10.1101/cshperspect.a018762 - DOI - PMC - PubMed
    1. Dawson MA & Kouzarides T (2012) Cancer epigenetics: from mechanism to therapy. Cell 150, 12–27. - PubMed
    1. West AC & Johnstone RW (2014) New and emerging HDAC inhibitors for cancer treatment. J Clin Invest 124, 30–39. - PMC - PubMed

Publication types

Substances