. 2021 May;41(5):389-403.
doi: 10.1002/cac2.12137. Epub 2021 Mar 27.

Macrophage inhibitory cytokine-1 induced by a high-fat diet promotes prostate cancer progression by stimulating tumor-promoting cytokine production from tumor stromal cells

Affiliations

Macrophage inhibitory cytokine-1 induced by a high-fat diet promotes prostate cancer progression by stimulating tumor-promoting cytokine production from tumor stromal cells

Mingguo Huang et al. Cancer Commun (Lond). 2021 May.

Abstract

Background: Recent studies have indicated that a high-fat diet (HFD) and/or HFD-induced obesity may influence prostate cancer (PCa) progression, but the role of HFD in PCa microenvironment is unclear. This study aimed to delineate the molecular mechanisms of PCa progression under HFD milieus and define the stromal microenvironment focusing on macrophage inhibitory cytokine-1 (MIC-1) activation.

Methods: We investigated the effects of HFD on PCa stromal microenvironment and MIC-1 signaling activation using PC-3M-luc-C6 PCa model mice fed with HFD or control diet. Further, we explored the effect of periprostatic adipocytes derived from primary PCa patients on activation and cytokine secretion of prostate stromal fibroblasts. Expression patterns and roles of MIC-1 signaling on human PCa stroma activation and progression were also investigated.

Results: HFD stimulated PCa cell growth and invasion as a result of upregulated MIC-1 signaling and subsequently increased the secretion of interleukin (IL)-8 and IL-6 from prostate stromal fibroblasts in PC-3M-luc-C6 PCa mouse model. In addition, periprostatic adipocytes directly stimulated MIC-1 production from PC-3 cells and IL-8 secretion in prostate stromal fibroblasts through the upregulation of adipose lipolysis and free fatty acid release. The increased serum MIC-1 was significantly correlated with human PCa stroma activation, high serum IL-8, IL-6, and lipase activity, advanced PCa progression, and high body mass index of the patients. Glial-derived neurotrophic factor receptor α-like (GFRAL), a specific receptor of MIC-1, was highly expressed in both cytoplasm and membrane of PCa cells and surrounding stromal fibroblasts, and the expression level was decreased by androgen deprivation therapy and chemotherapy.

Conclusion: HFD-mediated activation of the PCa stromal microenvironment through metabolically upregulated MIC-1 signaling by increased available free fatty acids may be a critical mechanism of HFD and/or obesity-induced PCa progression.

Keywords: high-fat diet; macrophage inhibitory cytokine-1; metabolism; prostate cancer; tumor microenvironment.


Conflict of interest statement

The authors declare that they have no competing interests.

Figures

FIGURE 1
FIGURE 1
HFD influenced PCa progression and enhanced adipocyte infiltration and adipose lipolysis in the PCa microenvironment. PC‐3M‐luc‐C6 cells were intraperitoneally injected into mice which were randomly assigned to the CD group or the HFD group (5 mice per group). A. Tumor burden and the total flux were measured by the Xenogen IVIS™ imaging system with an intraperitoneal injection of luciferin 4 weeks after injection of the cells. B. Xenograft tumor sections from mice in the HFD and CD groups were subjected to immunohistological staining with an anti‐Ki67 antibody (bar, 100 μm). C. The slides of mouse xenograft tumor tissue were stained with hematoxylin and eosin. The mouse peritoneal tumors in the HFD group showed higher transmigration of PCa cells into the peritoneal stroma (middle panel, arrow) and stimulated adipocyte infiltration in the tumor microenvironment (right panel, arrow). D and E. Lipase activity in the xenograft tumors and the sera of mice were measured using a Lipase activity assay kit. G and F. FFA concentration in the tumor extract and sera of the xenograft mice was measured with a FFA quantification kit. *P < 0.05, **P < 0.01. Abbreviations: PCa, prostate cancer; HFD, high‐fat diet; CD, control diet; FFA, free fatty acid.
FIGURE 2
FIGURE 2
HFD and exogenous FFAs stimulated the expression and secretion of MIC‐1. A. The xenograft tumors were stained with antibodies to MIC‐1 and GFRAL, and the staining intensity was semi‐quantitatively evaluated. The staining level of MIC‐1 was significantly higher in the HFD group than in the CD group, but there was no significant difference in the staining level of GFRAL between the two groups. B. The mean serum level of MIC‐1 was significantly higher in the HFD group than in the CD group as measured by an MIC‐1 ELISA kit. C and D. PC‐3 cells were cultured with 0.125 mmol/L of PA, 0.25 mmol/l of OA, 0.15 mmol/l of LA, or 2% BSA (as the control) for 24 h. Cells were harvested, total RNA was extracted, and quantitative RT‐PCR was performed to detect MIC‐1, TGF‐β, GFRAL, and β‐actin. Proteins from equal volumes of the CM in these cells were subjected to Western blotting analysis using an anti‐human MIC‐1 antibody, and the expression of monomeric and dimeric MIC‐1 was markedly increased in the CM of PC‐3 cells treated with FFAs than that of the PC‐3 cells cultured with 2% BSA. *P < 0.05. Abbreviations: ns, not significant; MIC‐1, macrophage inhibitory cytokine‐1; GFRAL, glial‐derived neurotrophic factor receptor α‐like; PA, palmitic acid; OA, oleic acid; LA, linoleic acid; BSA, bovine serum albumin; CM, conditioned medium, ns: not significant.
FIGURE 3
FIGURE 3
Activation and cytokine secretion in PCa stromal fibroblasts by the upregulation of MIC‐1 under a HFD conditions. A. The xenograft tumors were stained with an αSMA antibody, and the staining level was semi‐quantitatively evaluated. B. The serum IL‐8 level of mice was measured by a cytometric bead array kit. C. Cytokine secretion in PrSC cells stimulated by MIC‐1. PrSC cells were treated with 50 ng/mL rMIC‐1 or co‐cultured with PC‐3 cells for 24 h. Some of the PC‐3 cells were pretreated with 50 nmol/L siMIC‐1 or siCtrl for 12 h. D and E. PrSC cells were cultured in the presence or absence of 1 μmol/L U0126 for 1 h before treatment with 50 ng/mL rMIC‐1 for 3 h. D. Equal amounts of proteins (10 μg) from the cells were subjected to anti‐pERK1/2, anti‐ERK1/2, anti‐αSMA, and anti‐β‐actin antibodies. E.IL‐8 and IL‐6 mRNA levels were measured by quantitative RT‐PCR, normalized to the mRNA levels of β‐actin. *P < 0.05, and ** P < 0.01. Abbreviations: PrSC, prostate stromal fibroblasts; αSMA, α smooth muscle actin; siMIC‐1, MIC‐1 siRNA; siGFRAL, GFRAL siRNA; siCtrl, control siRNA; PrSC, prostate stromal fibroblast; rMIC‐1, recombinant MIC‐1.
FIGURE 4
FIGURE 4
PrAC stimulates MIC‐1 secretion in PC‐3 cells and IL‐8 secretion in PrSC cells by upregulating adipose lipolysis and FFA release. The isolated PrAC from 13 patients who underwent radical prostatectomy were directly incubated with PC‐3 cells pretreated with 50 nmol/L siMIC‐1, and cultured in the presence or absence of PrSC for 48 h. A and B. The levels of adipose lipolysis and FFA release were significantly higher in the co‐culture of PrAC and PC‐3 cells than in PrAC cultured alone. C. The MIC‐1 level, as measured by an MIC‐1 ELISA kit, was significantly increased in the co‐culture of PC‐3 cells and PrAC, but decreased in the CM of the PC‐3 cells treated with siMIC‐1. D. The IL‐8 levels, as measured by an IL‐8 ELISA kit, were significantly higher in the CM of PrSC cells co‐cultured with PrAC and further in the presence of PC‐3 cells compared to those cultured alone or co‐cultured with PrAC only, but was significantly decreased in the CM of PrSC cells by co‐culture with PrAC and PC‐3 cells pretreated with siMIC‐1. *P < 0.05, ** P < 0.01. Abbreviations: ns, not significant; PrAC, periprostatic adipocytes; PrSC, prostate stromal fibroblasts; CM; conditioned medium.
FIGURE 5
FIGURE 5
Overexpression and secretion of MIC‐1 was significantly correlated with cancer stroma activation and advanced PCa progression. The serum MIC‐1 levels in 67 patients with localized PCa were measured using an MIC‐1‐specific ELISA kit. A. The αSMA is expressed in the stroma of the PCa tumor section. B. The 51.5%, 36.4%, and 12.1% patients in the MIC‐1‐low group and 29.4%, 38.2%, and 32.4% in the MIC‐1‐high group were classified as having low, moderate, and high αSMA staining, respectively (P = 0.011). C and D. The serum cytokine concentration was measured by a cytometric bead array kit. E‐H The associations of serum MIC‐1 levels with clinicopathological characteristics of PCa patients were analyzed. High serum MIC‐1 levels were associated with high PSA levels (P = 0.009; E), high GS (P = 0.074; F), high BMI (P = 0.037; G), and high serum lipase activity (P = 0.001; H). Abbreviations: αSMA, α smooth muscle actin; PSA, prostate‐specific antigen; GS, Gleason score; BMI, body mass index.
FIGURE 6
FIGURE 6
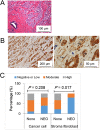
GFRAL is expressed in prostate cancer cells and the surrounding stromal fibroblasts. A. A representative image of hematoxylin and eosin staining of a high‐grade tumor. B. GFRAL immunostaining shows that GFRAL was predominantly expressed in the cytoplasm and membrane of cancer cells and stromal fibroblasts (arrow). C. The association of GFRAL expression with neoadjuvant treatment. Of the 19 patients, 10 did not receive neoadjuvant treatment (None), and 9 received NEO therapy. The GFRAL staining level in stromal fibroblasts was lower in the NEO group than in the None group (P = 0.017). Abbreviations: None, not receive neoadjuvant treatment; NEO, neoadjuvant androgen deprivation therapy and/or chemotherapy.
FIGURE 7
FIGURE 7
Schematic role of MIC‐1 signaling in the prostate cancer microenvironment under a HFD milieu. MIC‐1 production was increased in PCa cells, which was affected by adipocyte infiltration and adipose lipolysis. MIC‐1 directly stimulated surrounding PrSC cells to secrete protumorigenic cytokines such as IL‐8 and IL‐6 in the PCa stromal microenvironment, especially under a HFD condition. These upregulated functional cytokines directly and/or indirectly stimulated PCa cell proliferation, invasion, and metastasis. Abbreviations: MIC‐1, macrophage inhibitory cytokine‐1.

Similar articles

Cited by

References

    1. Divella R, Daniele A, Savino E, Paradiso A. Anticancer Effects of Nutraceuticals in the Mediterranean Diet: An Epigenetic Diet Model. Cancer Genomics Proteomics. 2020;17(4):335‐50. - PMC - PubMed
    1. Matsushita M, Fujita K, Nonomura N. Influence of Diet and Nutrition on Prostate Cancer. Int J Mol Sci. 2020;21(4). - PMC - PubMed
    1. Calle EE, Rodriguez C, Walker‐Thurmond K, Thun MJ. Overweight, obesity, and mortality from cancer in a prospectively studied cohort of U.S. adults. N Engl J Med. 2003;348(17):1625‐38. - PubMed
    1. Wu S, Powers S, Zhu W, Hannun YA. Substantial contribution of extrinsic risk factors to cancer development. Nature. 2016;529(7584):43‐7. - PMC - PubMed
    1. Narita S, Tsuchiya N, Saito M, Inoue T, Kumazawa T, Yuasa T, et al. Candidate genes involved in enhanced growth of human prostate cancer under high fat feeding identified by microarray analysis. The Prostate. 2008;68(3):321‐35. - PubMed

Publication types