. 2021 Apr 29;184(9):2316-2331.e15.
doi: 10.1016/j.cell.2021.03.029. Epub 2021 Mar 16.

Neutralizing and protective human monoclonal antibodies recognizing the N-terminal domain of the SARS-CoV-2 spike protein

Affiliations

Neutralizing and protective human monoclonal antibodies recognizing the N-terminal domain of the SARS-CoV-2 spike protein

Naveenchandra Suryadevara et al. Cell. .

Abstract

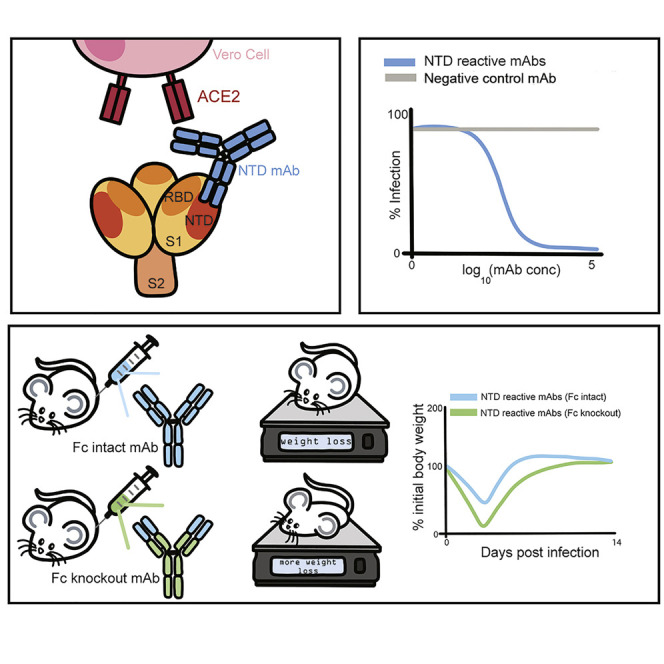
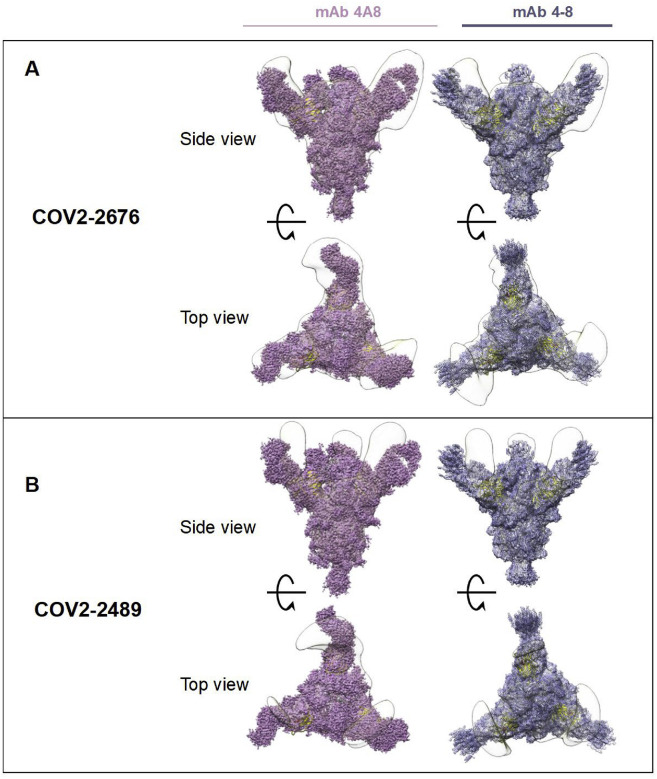
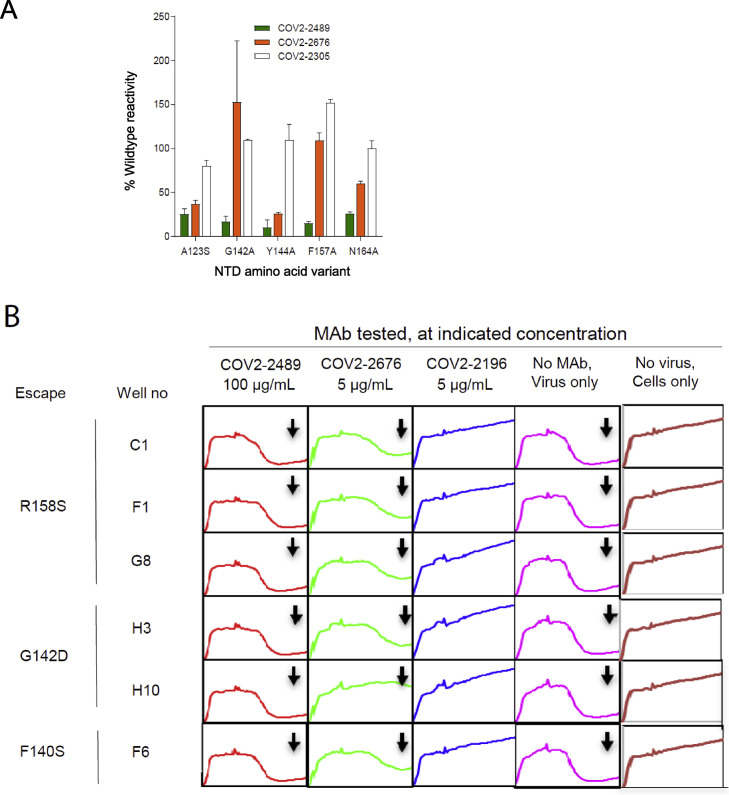
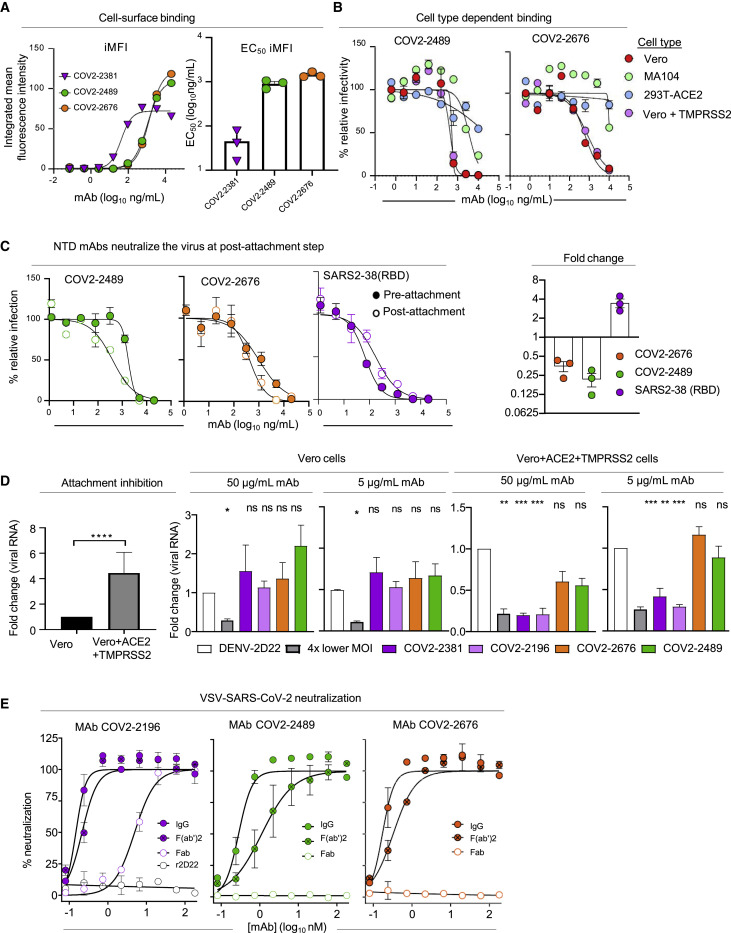
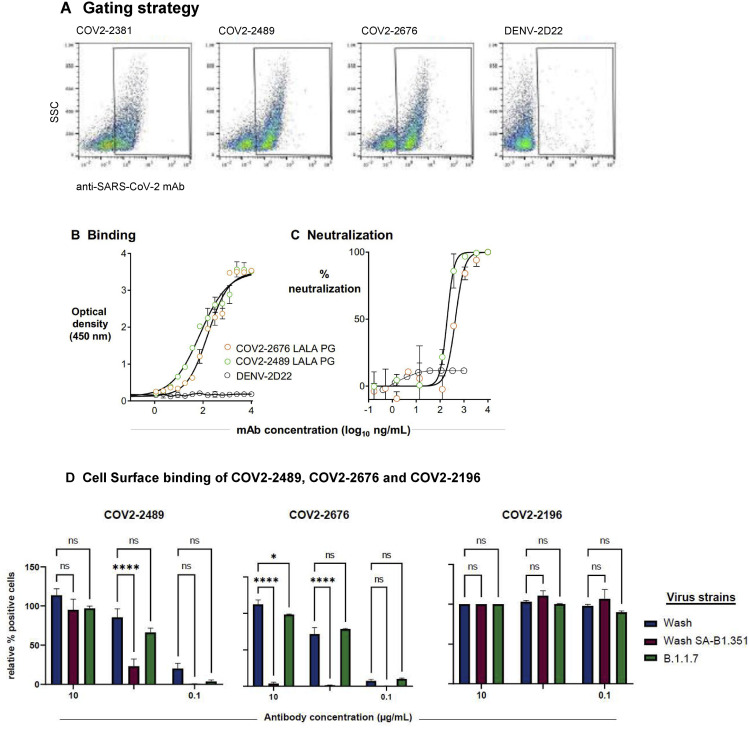
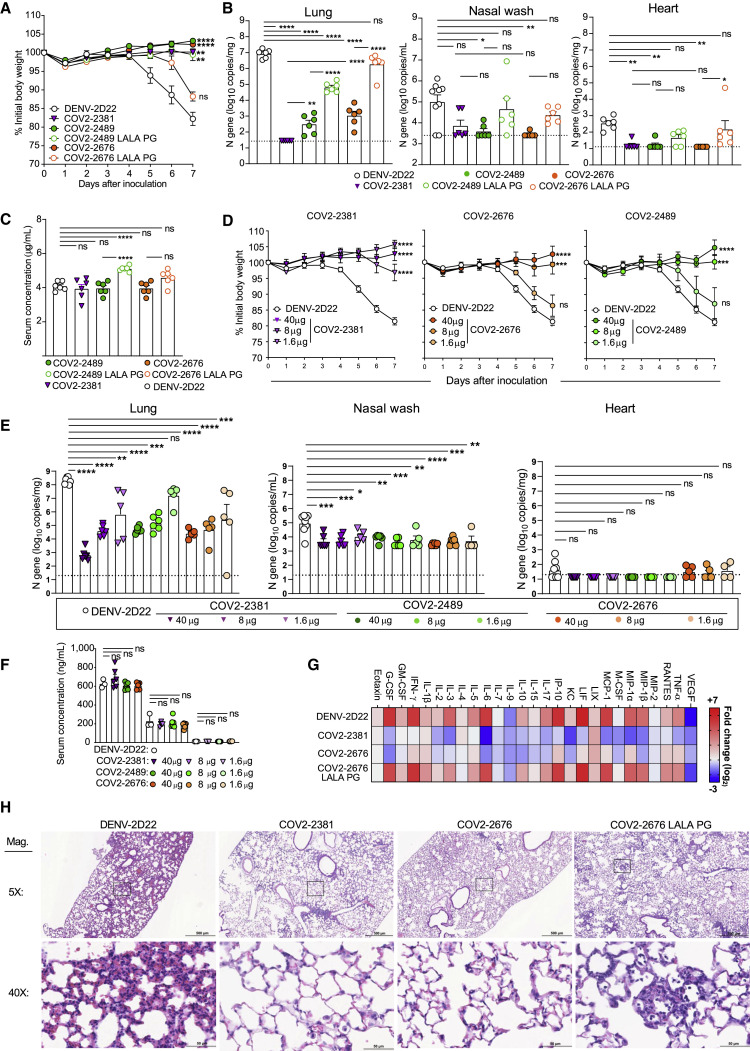
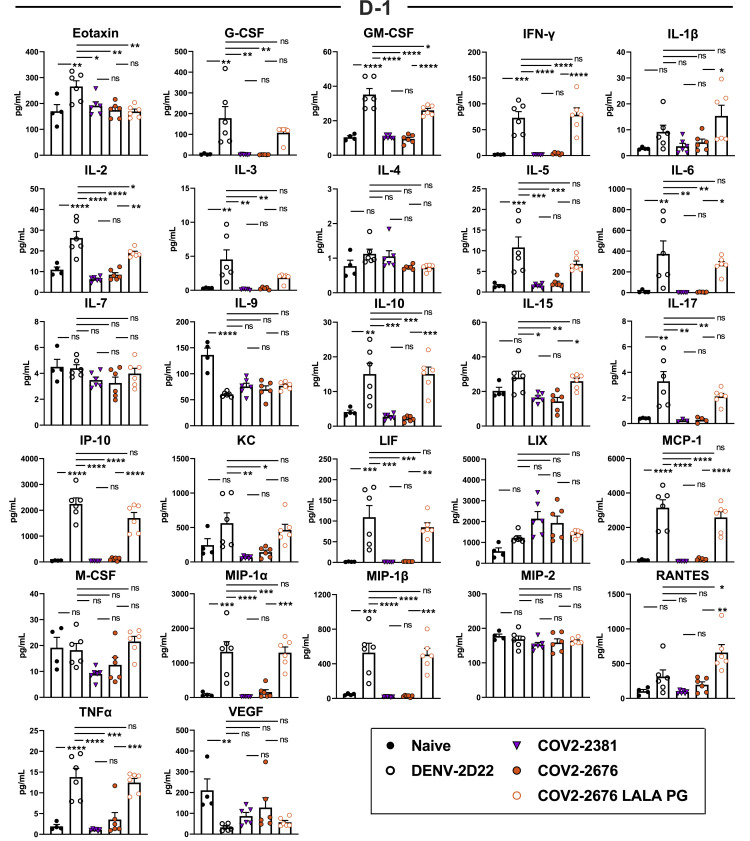
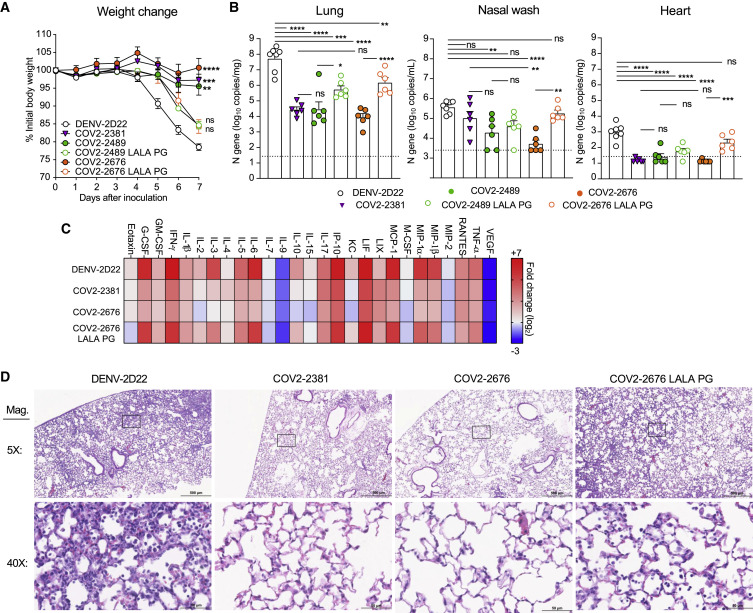
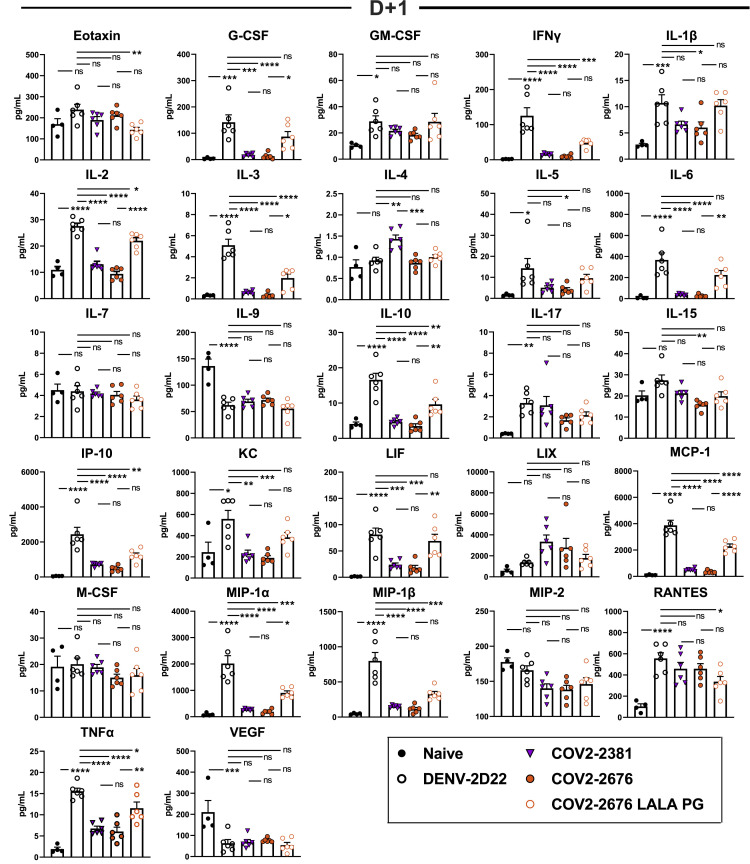
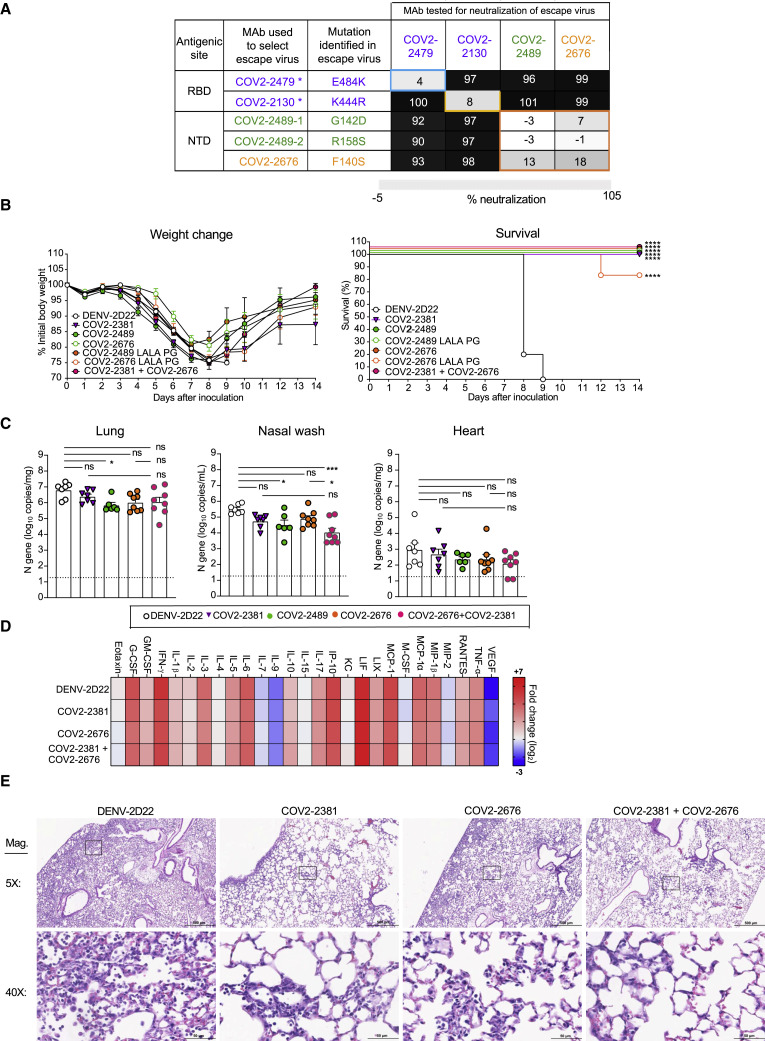
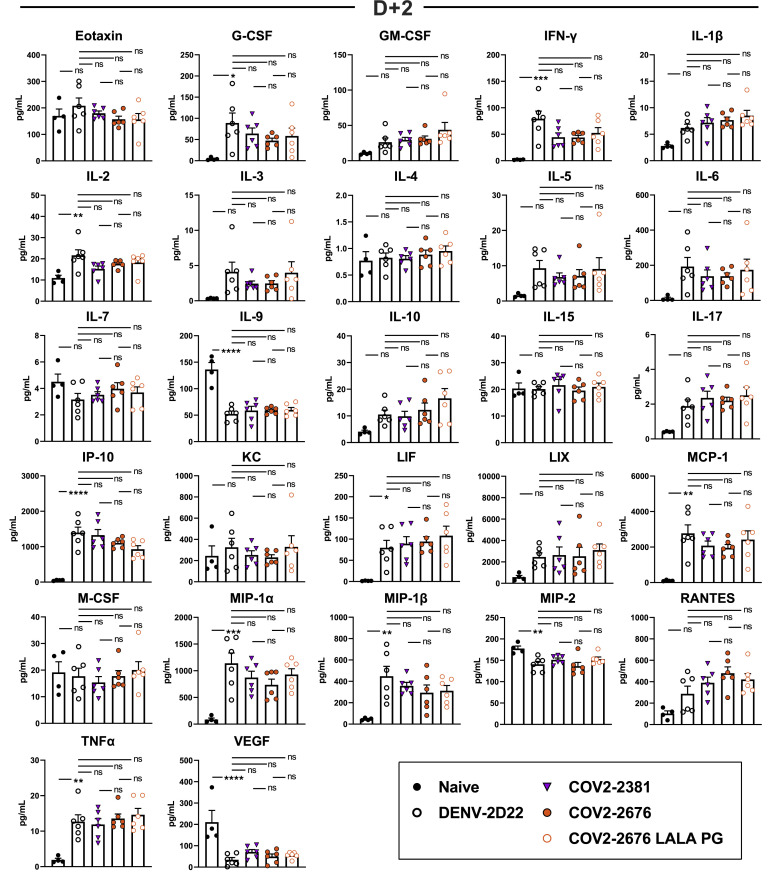
Most human monoclonal antibodies (mAbs) neutralizing SARS-CoV-2 recognize the spike (S) protein receptor-binding domain and block virus interactions with the cellular receptor angiotensin-converting enzyme 2. We describe a panel of human mAbs binding to diverse epitopes on the N-terminal domain (NTD) of S protein from SARS-CoV-2 convalescent donors and found a minority of these possessed neutralizing activity. Two mAbs (COV2-2676 and COV2-2489) inhibited infection of authentic SARS-CoV-2 and recombinant VSV/SARS-CoV-2 viruses. We mapped their binding epitopes by alanine-scanning mutagenesis and selection of functional SARS-CoV-2 S neutralization escape variants. Mechanistic studies showed that these antibodies neutralize in part by inhibiting a post-attachment step in the infection cycle. COV2-2676 and COV2-2489 offered protection either as prophylaxis or therapy, and Fc effector functions were required for optimal protection. Thus, natural infection induces a subset of potent NTD-specific mAbs that leverage neutralizing and Fc-mediated activities to protect against SARS-CoV-2 infection using multiple functional attributes.

Keywords: N-terminal domain; SARS-CoV-2; coronavirus; monoclonal antibodies; neutralizing antibodies; viral antibodies.


Conflict of interest statement

Declaration of interests M.E.F., E.D., and B.J.D. are employees of Integral Molecular. B.J.D. is a shareholder of Integral Molecular. M.S.D. is a consultant for Inbios, Vir Biotechnology, NGM Biopharmaceuticals, and Carnival Corporation and is on the Scientific Advisory Boards of Moderna and Immunome, and the Diamond laboratory at Washington University School of Medicine has received sponsored research agreements from Emergent BioSolutions, Moderna, and Vir Biotechnology. J.E.C. has served as a consultant for Eli Lilly, GlaxoSmithKline, and Luna Biologics, is a member of the Scientific Advisory Boards of CompuVax and Meissa Vaccines, and is founder of IDBiologics. The Crowe laboratory at Vanderbilt University Medical Center has received unrelated sponsored research agreements from IDBiologics and AstraZeneca.

Figures

None
Graphical abstract
Figure 1
Figure 1
Two non-RBD-reactive mAbs specific to SARS-CoV-2 S protein neutralize the virus (A) ELISA binding of COV2-2196, COV2-2263, COV2-2489, COV2-2490, COV2-2676, or rDENV-2D22 to trimeric S-6Pecto. Data are mean ± standard deviations (SD) of technical triplicates from a representative experiment repeated twice. (B) ELISA binding of COV2-2196, COV2-2263, COV2-2489, COV2-2490, COV2-2676, or rDENV-2D22 to rNTD protein. Data are mean ± SD of technical triplicates from a representative experiment repeated twice. (C) Neutralization curves for COV2-2196, COV2-2489, COV2-2676, or rDENV-2D22 using wild-type SARS-CoV-2 in a FRNT assay. Error bars indicate SD; data represent at least two independent experiments performed in technical duplicate. (D) Neutralization curves for COV2-2196, COV2-2489, COV2-2490, COV2-2676, or rDENV-2D22 in a SARS-CoV-2-rVSV neutralization assay using RTCA. Error bars indicate SD; data are representative of at least two independent experiments performed in technical duplicate. (E) Competition binding of the panel of neutralizing mAbs with reference mAbs COV2-2130, COV2-2196, COV2-2263, COV2-2489, COV2-2676, or rCR3022. Binding of reference mAbs to trimeric S-6Pecto protein was measured in the presence of saturating concentration of competitor mAb in a competition ELISA and normalized to binding in the presence of rDENV-2D22. Black indicates full competition (<25% binding of reference antibody), gray indicates partial competition (25% to 60% binding of reference antibody), and white indicates no competition (>60% binding of reference antibody). (F) Human-ACE2-blocking curves for COV2-2196, COV2-2263, COV2-2489, COV2-2490, COV2-2676, and rDENV-2D22 in a human-ACE2-blocking ELISA. Data are mean ± SD of technical triplicates from a representative experiment repeated twice.
Figure S1
Figure S1
Competition binding of NTD-reactive MAbs, related to Figure 1 (A) Competition of the panel of neutralizing mAbs with reference mAbs COV2-2676 and COV2-2263. Binding of reference mAbs to trimeric S6Pecto was measured in the presence of a saturating concentration of competitor mAb in a competition ELISA and normalized to binding in the presence of rDENV-2D22. Black indicates full competition (< 25% binding of reference antibody); gray indicates partial competition (25 to 60% binding of reference antibody); white indicates no competition (> 60% binding of reference antibody). (B) Inhibition of mAb COV2-2676 (left) or COV2-2489 (right) binding in ELISA to SARS-CoV-2 S6Pecto by serum or plasma of nine SARS-CoV-2 immune individual or one non-immune control individual. Data are mean ± SD of triplicates and are representative of two experiments with similar results. Dotted line indicates the percentage of self-competition of mAbs COV2-2676 and-2489 on the SARS-CoV-2 S6Pecto antigen.
Figure 2
Figure 2
COV2-2676 and COV2-2489 binding map to the NTD of SARS-COV-2 S protein (A) Top row (side view) and bottom row (top view) of Fab-S6Pecto closed trimer (S protein model PDB: 7JJI) complexes visualized by negative-stain electron microscopy for COV2-2676 Fab model in pink, COV2-2489 Fab model in blue, and superimpose 3D volume of CoV2-S-Fab 2676 complex in gray and CoV2-S-Fab 2489 in mesh. The S-NTD is shown in yellow and electron density in gray. Representative two-dimensional (2D) class averages for each complex are shown at the bottom (box size is 128 pixels, with 4.36 Å per pixel). Data are from a single experiment; detailed collection statistics are provided in Table S2. (B) Identification of critical contact residues by alanine-scanning mutagenesis. Top (side view) with loss of binding residues (cyan) for COV2-2489 or COV2-2676 to mutant S-NTD constructs, normalized to the wild type. Bottom, escape mutations mapped to the NTD region for COV2-2489 (green G142D, R158S) or COV2-2676 (orange F140S). (C) Results of viral selections with COV2-2489 or COV2-2676 individual mAbs. The number of replicates in which escape variants were selected is indicated. Mutations present in the NTD of the selected escape variants are indicated.
Figure S2
Figure S2
Superimposed Fab-spike negative stain EM, related to Figure 2 (A) COV2-2676 with mAb on the top is shown in side view superimposed with 4A8 (left) or mAb 4-8 (right) and on the bottom is shown in top view of the same. (B) COV2-2489 with mAb on the top is shown in side view superimposed with 4A8 (left) or mAb 4-8 (right) and on the bottom is shown in top view of the same.
Figure S3
Figure S3
A. Identification of critical contact residues by alanine mutagenesis, related to Figures 2B and 2C Binding values for mAbs COV2-2489, −2676, and −2305. The binding values are shown as a percentage of mAb binding to wild-type (WT) SARS-CoV-2 spike protein and are plotted with the range (highest-minus lowest binding value) of at least two measurements. (B) Real-time cell analysis (RTCA) to select for spike-protein-expressing VSV viruses that escape antibody neutralization, related to Figures 2B and 2C. Example sensograms from individual wells of 96-well E-plate analysis showing viruses that escaped neutralization (noted with arrow) by indicated antibodies. Cytopathic effect (CPE) was monitored kinetically in Vero E6 cells inoculated with virus in the presence of a saturating concentration of antibody COV2-2489 at 100 μg/mL (red), COV2-2676 at 5 μg/mL (green) or lack of escape using RBD-specific mAb COV2-2196-blue at 5 μg/mL (blue) are shown. Uninfected cells (brown) or cells inoculated with virus without antibody (magenta) serve as controls. All curves represented show a mean of technical duplicates.
Figure 3
Figure 3
Virus neutralization and binding of infected cells by anti-SARS-CoV-2 mAbs targeting the NTD (A) SARS-CoV-2-infected Vero cells were stained with serial dilutions of COV2-2489, COV2-2676, COV2-2381, or DENV2-2D22 (isotype control) prior to analysis of staining intensity by flow cytometry. The positively stained cells were gated using uninfected and isotype control mAb-stained infected cells, and the integrated mean fluorescence intensity (iMFI) was determined by MFI of positive cells multiplied by the percent of total positive cells. The left panel shows representative dose response curves for the staining intensity of infected cells by each mAb. The right panel shows the mean EC50 values for infected cell staining, determined from three independent experiments. Error bars represent SEM. (B–D) The neutralization potency of COV2-2489 and COV2-2676 against SARS-CoV-2 was assessed by FRNT using (B) Vero, MA104, 293T+ACE2, and Vero+TMPRSS2 cells. Results are representative of three independent experiments performed in duplicate. (C) COV2-2489 and COV2-2676 were assayed for neutralization potency by modified FRNT in which mAb was added to SARS-CoV-2 before (pre-attachment, filled circles) or after (post-attachment, open circles) virus was absorbed to Vero E6 cells. (C) Error bars represent the range from two technical replicates. Data shown are representative of three independent experiments. (D) Attachment inhibition. (Left panel) Vero or Vero+hACE2+TMPRSS2 cells were incubated with SARS-CoV-2 at 4°C for 1 h. After extensive washing, cell-bound viral RNA was measured by qRT-PCR. (Right four panels) SARS-CoV-2 was pre-incubated with 5 or 50 μg/mL of indicated anti-RBD or anti-NTD mAbs for 1 h prior to addition to Vero or Vero+hACE2+TMPRSS2 cells. Cell-bound viral RNA was measured by qRT-PCR. Data are pooled from three independent experiments. (Left) t test: ∗∗∗∗p < 0.0001; (Right) one-way ANOVA with Dunnett’s multiple comparisons test compared to isotype control mAb treatment: p < 0.05, ∗∗p < 0.01, ∗∗∗p < 0.001. (E) Neutralization curves for COV2-2196 IgG, F(ab′)2, F(ab), or rDENV-2D22; COV2-2489 IgG, F(ab′)2, or F(ab); or COV2-2676 IgG, F(ab′)2, or F(ab) in a SARS-CoV2-rVSV assay using RTCA. Error bars indicate SD; data represent at least two independent experiments performed in technical triplicates.
Figure S4
Figure S4
Gating strategy of Vero E6 cells infected with SARS-CoV-2 for cell-surface displayed spike protein binding assay, ELISA, and FRNT for COV2-2676 and COV2-2489 mAbs made with LALA-PG Fc variants, related to Figures 3, 4, and 5 (A) A representative gating strategy illustrating stained with primary COV2-2381, COV2-2676, COV2-2489 or DENV-2D22 mAb. (B) ELISA binding of COV2-2676-LALA-PG, COV2-2489-LALA-PG or DENV-2D22 to trimeric S-6Pecto. Data are mean ± SD of technical triplicates from a representative experiment repeated twice. (C) Neutralization curves for COV2-2676-LALA-PG, 2489-LALA-PG or DENV-2D22 using wild-type authentic SARS-CoV-2 in a FRNT assay. Error bars indicate S.D.; data represent at least two independent experiments performed in technical duplicate. (D) Cell Surface binding of COV2-2489, COV2-2676 and COV2-2196 to spike protein expressed after infection with SARS-CoV-2 variant strains, Related to Figure 3. Vero cells ectopically expressing TMPRSS2 were inoculated with the indicated SARS-CoV-2 strains: the Washington strain (Wash), a B.1.1.7 isolate, (B.1.1.7), or a chimeric SARS-CoV-2 strain with a South African spike gene (Wash SA-B.1.351). Intact infected cells were stained with COV2-2489, COV2-2676 or COV2-2196 at a concentration of 10, 1 or 0.1 μg/mL prior to analysis by flow cytometry. The percent of positively stained cells was determined by gating on staining with DENV2-2D22 (isotype control) and normalized for each variant to 100, based on staining by COV2-2196 at 10 μg/mL. Shown is the of positively-stained cells (normalized for total infection) from three independent experiments (two-way ANOVA with Dunnett’s multiple comparisons test, p < 0.05; ∗∗∗∗p < 0.0001; ns, p > 0.05, not significant). Error bars represent SEM.
Figure 4
Figure 4
Prophylaxis with COV2-2676 or COV2-2489 confers protection against SARS-CoV-2 in mice Eight- to nine-week-old male and female K18 hACE2 transgenic mice were administered by intraperitoneal (i.p.) injection 200, 40, 8, or 1.6 μg of COV2-2676, COV2-2489, COV2-2676 LALA-PG, COV2-2489 LALA-PG, COV2-2381 (a positive control), or DENV-2D22, an isotype control, mAb a day before virus inoculation (D-1). One day later, mice were inoculated intranasally (i.n.) with 103 PFU of SARS-CoV-2. (A) Body weight change of mice over time. Data show the mean ± SEM compared to the isotype control mAb for two independent experiments (n = 6 to 11 for each experimental group; one-way ANOVA with Dunnett’s post hoc test of area under the curve from 4 to 7 dpi: ns, not significant, ∗∗p < 0.01, ∗∗∗∗p < 0.0001). (B) Tissues were harvested at 7 dpi from a subset of mice in (A). Viral burden in the lung, nasal wash, and heart was assessed by qRT-PCR of the N gene. Data show the mean ± SEM compared between all groups for two independent experiments (n = 6 for each experimental group; one-way ANOVA with Tukey’s post hoc test: ns, not significant, p < 0.05, ∗∗p < 0.01, ∗∗∗p < 0.001, ∗∗∗∗p < 0.0001). Dashed line represents limit of detection of assay. (C) Serum concentration (ng/mL) of human mAbs at the time of SARS-CoV-2 infection of the mice in (B). Data show the mean ± SEM compared between all groups for two independent experiments (n = 6 for each experimental group; one-way ANOVA with Tukey’s post hoc test: ns, not significant, ∗∗∗∗p < 0.0001). (D) Body weight change of mice over time. Data show the mean ± SEM compared to isotype control mAb for two independent experiments (n = 4 to 8 for each experimental group; one-way ANOVA with Dunnett’s post hoc test of area under the curve from 4 to 7 dpi: ns, not significant, ∗∗∗p < 0.001, ∗∗∗∗p < 0.0001). (E) Tissues were harvested at 7 dpi from mice in (D). Viral burden in the lung, nasal wash, and heart was assessed by qRT-PCR of the N gene. Data show the mean ± SEM compared between all groups for two independent experiments (n = 4 to 8 for each experimental group; one-way ANOVA with Tukey’s post hoc test: ns, not significant, p < 0.05, ∗∗p < 0.01, ∗∗∗p < 0.001, ∗∗∗∗p < 0.0001). (F) Serum concentration (ng/mL) of human mAbs at the time of SARS-CoV-2 infection of the mice in (D). Data show the mean ± SEM compared to isotype control mAb at various doses of mAb for two independent experiments (n = 6; one-way ANOVA with Dunnett’s post hoc test: ns, not significant). (G) Heatmap of cytokine and chemokine levels in lung tissue homogenates harvested in (B) as measured by a multiplex platform. Log2 fold change compared to lungs from mock-infected animals was plotted in the corresponding heatmap (associated statistics are reported in Figure S6A). (H) Hematoxylin and eosin staining of lung sections harvested at 7 dpi from mice in (B). Images are low (top; scale bars, 500 μm) and high power (bottom; scale bars, 50 μm). Representative images are shown from two independent experiments (n = 3).
Figure S5
Figure S5
Cytokine and chemokine levels in the lungs of SARS-CoV-2-infected mice, related to Figure 4 Cytokine and chemokine levels in the lungs of SARS-CoV-2 infected mice at 7 dpi following d-1 treatment with isotype, COV2-2381, COV2-2676, and COV2-2676 LALA PG as measured by a multiplex platform (two independent experiments, n = 6 per group. One-way ANOVA with Tukey’s post hoc test: ns, not significant, p < 0.05, ∗∗p < 0.01, ∗∗∗p < 0.001, ∗∗∗∗p < 0.0001.)
Figure 5
Figure 5
Therapeutic activity of COV2-2676 or COV-2489 after SARS-CoV-2 challenge Eight- to nine-week-old male and female K18 hACE2 transgenic mice were inoculated with 103 PFU of SARS-COV2. One day later (D+1), mice were given an i.p. administration of 200 μg of COV2-2676, COV2-2489, COV2-2676 LALA PG, COV2-2489 LALA PG, COV2-2381 (a positive control), or DENV-2D22, an isotype control, mAb. (A) Body weight change of mice over time. Data show the mean ± SEM compared to isotype control mAb for two independent experiments (n = 6 to 11 for each experimental group; one-way ANOVA with Dunnett’s post hoc test of area under the curve from 4 to 7 dpi: ns, not significant, ∗∗p < 0.01, ∗∗∗p < 0.001, ∗∗∗∗p < 0.0001). (B) Tissues were harvested at 7 dpi from a subset of mice in (A). Viral burden in the lung, nasal wash, and heart was assessed by qRT-PCR of the N gene. Data show the mean ± SEM compared between all groups for two independent experiments (n = 6 to 7 for each experimental group; one-way ANOVA with Tukey’s post hoc test: ns, not significant, p < 0.05, ∗∗p < 0.01, ∗∗∗p < 0.001, ∗∗∗∗p < 0.0001). (C) Heatmap of cytokine and chemokine levels in lung homogenates harvested in (B) as measured by a multiplex platform. Log2 fold change compared to lungs from mock-infected animals was plotted in the corresponding heatmap (associated statistics are reported in Figure S6B). (D) Hematoxylin and eosin staining of lung sections harvested at 7 dpi from mice in (B). Images are low (top; scale bars, 500 μm) and high power (bottom; scale bars, 50 μm). Representative images are shown from two independent experiments (n = 3).
Figure S6
Figure S6
Cytokine and chemokine levels in the lungs of SARS-CoV-2-infected mice, related to Figure 5 Cytokine and chemokine levels in the lungs of SARS-CoV-2 infected mice at 7 dpi following d+1 treatment with isotype, COV2-2381, COV2-2676, and COV2-2676 LALA PG as measured by a multiplex platform (two independent experiments, n = 6 per group. One-way ANOVA with Tukey’s post hoc test: ns, not significant, p < 0.05, ∗∗p < 0.01, ∗∗∗p < 0.001, ∗∗∗∗p < 0.0001.)
Figure 6
Figure 6
Rationale for design of an antibody cocktail targeting both RBD and NTD (A) Neutralization matrix of RBD mAbs (COV2-2479 and COV2-2130 shown in purple) and NTD mAb (COV2-2676 in orange and COV2-2489 in green) escape viruses. Black, full neutralization; gray, partial neutralization; white, no neutralization; and indicates escape viruses that were isolated in previously published study. Eight- to nine-week-old male or female K18 hACE2 transgenic mice were inoculated intranasally with 103 PFU of SARS-CoV2. Two days later (D+2), mice were given an i.p. administration of 200 μg of COV2-2676, COV2-2489, COV2-2676 LALA-PG, COV2-2489 LALA-PG, COV2-2381 (a positive control), or DENV-2D22, an isotype control, mAb for monotherapy or 100 μg each of COV2-2381 and COV2-2676 for combination therapy. (B) (Left panel) body weight change of mice over time. Data show the mean ± SEM compared to isotype control mAb for two independent experiments (n = 6 to 14 for each experimental group: one-way ANOVA with Dunnett’s post hoc test of area under the curve from 4 to 7 dpi. Significant differences were not detected. (Right panel) percent survival of mice over time. Survival was compared to isotype control for two independent experiments (n = 6 to 14 for each experimental group; log-rank Mantel-Cox test; ∗∗∗∗p < 0.0001). (C) Tissues were harvested at 7 dpi mice from a subset of mice in (B). Viral burden in the lung, nasal wash, and heart was assessed by qRT-PCR of the N gene. Data show the mean ± SEM compared between all groups for two independent experiments: n = 6 to 8 for each experimental group; one-way ANOVA with Tukey’s post hoc test: ns, not significant, p < 0.05, ∗∗∗p < 0.001). (D) Heatmap of cytokine and chemokine levels in lung homogenates harvested in (C) as measured by a multiplex platform. Log2 fold change compared to lungs from mock-infected animals was plotted in the corresponding heatmap (associated statistics are reported in Figure S6C.) (E) Hematoxylin and eosin staining of lung sections harvested at 7 dpi from mice in (B). Images are low (top; scale bars, 500 μm) and high power (bottom; scale bars, 50 μm). Representative images are shown from two independent experiments (n = 3).
Figure S7
Figure S7
Cytokine and chemokine levels in the lungs of SARS-CoV-2-infected mice, related to Figures 5 and 6 Cytokine and chemokine levels in the lungs of SARS-CoV-2 infected mice at 7 dpi following d+1 treatment with isotype, COV2-2381, COV2-2676, and COV2-2676 LALA PG as measured by a multiplex platform (two independent experiments, n = 6 per group. One-way ANOVA with Tukey’s post hoc test: ns, not significant, p < 0.05, ∗∗p < 0.01, ∗∗∗p < 0.001, ∗∗∗∗p < 0.0001.)

Update of

Comment in

  • An NTD supersite of attack.
    Lok SM. Lok SM. Cell Host Microbe. 2021 May 12;29(5):744-746. doi: 10.1016/j.chom.2021.04.010. Cell Host Microbe. 2021. PMID: 33984277 Free PMC article.

References

    1. Alsoussi W.B., Turner J.S., Case J.B., Zhao H., Schmitz A.J., Zhou J.Q., Chen R.E., Lei T., Rizk A.A., McIntire K.M., et al. A potently neutralizing antibody protects mice against SARS-CoV-2 onfection. J. Immunol. 2020;205:915–922. - PMC - PubMed
    1. Atyeo C., Fischinger S., Zohar T., Slein M.D., Burke J., Loos C., McCulloch D.J., Newman K.L., Wolf C., Yu J., et al. Distinct early serological signatures track with SARS-CoV-2 survival. Immunity. 2020;53:524–532.e4. - PMC - PubMed
    1. Avanzato V.A., Matson M.J., Seifert S.N., Pryce R., Williamson B.N., Anzick S.L., Barbian K., Judson S.D., Fischer E.R., Martens C., et al. Case study: Prolonged infectious SARS-CoV-2 shedding from an asymptomatic immunocompromised individual with cancer. Cell. 2020;183:1901–1912.e9. - PMC - PubMed
    1. Barnes C.O., West A.P., Jr., Huey-Tubman K.E., Hoffmann M.A.G., Sharaf N.G., Hoffman P.R., Koranda N., Gristick H.B., Gaebler C., Muecksch F., et al. Structures of human antibodies bound to SARS-CoV-2 spike reveal common epitopes and recurrent features of antibodies. Cell. 2020;182:828–842.e16. - PMC - PubMed
    1. Baum A., Ajithdoss D., Copin R., Zhou A., Lanza K., Negron N., Ni M., Wei Y., Mohammadi K., Musser B., et al. REGN-COV2 antibodies prevent and treat SARS-CoV-2 infection in rhesus macaques and hamsters. Science. 2020;370:1110–1115. - PMC - PubMed

MeSH terms