Virus transport from drywells under constant head conditions: A modeling study
- PMID: 33774462
- PMCID: PMC9126062
- DOI: 10.1016/j.watres.2021.117040
Virus transport from drywells under constant head conditions: A modeling study
Abstract
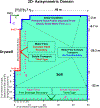
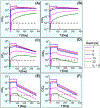
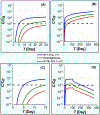
Many arid and semi-arid regions of the world face challenges in maintaining the water quantity and quality needs of growing populations. A drywell is an engineered vadose zone infiltration device widely used for stormwater capture and managed aquifer recharge. To our knowledge, no prior studies have quantitatively examined virus transport from a drywell, especially in the presence of subsurface heterogeneity. Axisymmetric numerical experiments were conducted to systematically study virus fate from a drywell for various virus removal and subsurface heterogeneity scenarios under steady-state flow conditions from a constant head reservoir. Subsurface domains were homogeneous or had stochastic heterogeneity with selected standard deviation (σ) of lognormal distribution in saturated hydraulic conductivity and horizontal (X) and vertical (Z) correlation lengths. Low levels of virus concentration tailing can occur even at a separation distance of 22 m from the bottom of the drywell, and 6-log10 virus removal was not achieved when a small detachment rate (kd1=1 × 10⁻⁵ min⁻¹) is present in a homogeneous domain. Improved virus removal was achieved at a depth of 22 m in the presence of horizontal lenses (e.g., X=10 m, Z=0.1 m, σ=1) that enhanced the lateral movement and distribution of the virus. In contrast, faster downward movement of the virus with an early arrival time at a depth of 22 m occurred when considering a vertical correlation in permeability (X=1 m, Z=2 m, σ=1). Therefore, the general assumption of a 1.5-12 m separation distance to protect water quality may not be adequate in some instances, and site-specific microbial risk assessment is essential to minimize risk. Microbial water quality can potentially be improved by using an in situ soil treatment with iron oxides to increase irreversible attachment and solid-phase inactivation.
Keywords: Drywell; HYDRUS (2D/3D); Managed aquifer recharge; Vadose zone; Virus; Water Quality.
Copyright © 2021. Published by Elsevier Ltd.
Conflict of interest statement
Declaration of Competing Interest None.
Figures


References
-
- Abdalla CW, Roach BA and Epp DJ (1992) Valuing environmental quality changes using averting expenditures: an application to groundwater contamination. Land Economics, 163–169.
-
- Abu-Ashour J, Joy DM, Lee H, Whiteley HR and Zelin S, (1994) Transport of microorganisms through soil. Water, Air, and Soil Pollution 75(1–2), 141–158.
-
- Ahammed MM and Meera V. (2010) Metal oxide/hydroxide-coated dual-media filter for simultaneous removal of bacteria and heavy metals from natural waters. Journal of Hazardous Materials 181(1–3), 788–793. - PubMed
-
- Alam S, Gebremichael M, Li R, Dozier J. and Lettenmaier DP (2020) Can Managed Aquifer Recharge Mitigate the Groundwater Overdraft in California’s Central Valley? Water Resources Research 56(8), e2020WR027244.
-
- Anders R. and Chrysikopoulos CV (2008) Transport of Viruses Through Saturated and Unsaturated Columns Packed with Sand. Transport in Porous Media 76(1), 121–138.
MeSH terms
Substances
Grants and funding
LinkOut - more resources
Full Text Sources
Other Literature Sources
Miscellaneous

