. 2021 May:41:101947.
doi: 10.1016/j.redox.2021.101947. Epub 2021 Mar 19.

NOX4 promotes ferroptosis of astrocytes by oxidative stress-induced lipid peroxidation via the impairment of mitochondrial metabolism in Alzheimer's diseases

Affiliations

NOX4 promotes ferroptosis of astrocytes by oxidative stress-induced lipid peroxidation via the impairment of mitochondrial metabolism in Alzheimer's diseases

Min Woo Park et al. Redox Biol. 2021 May.

Abstract

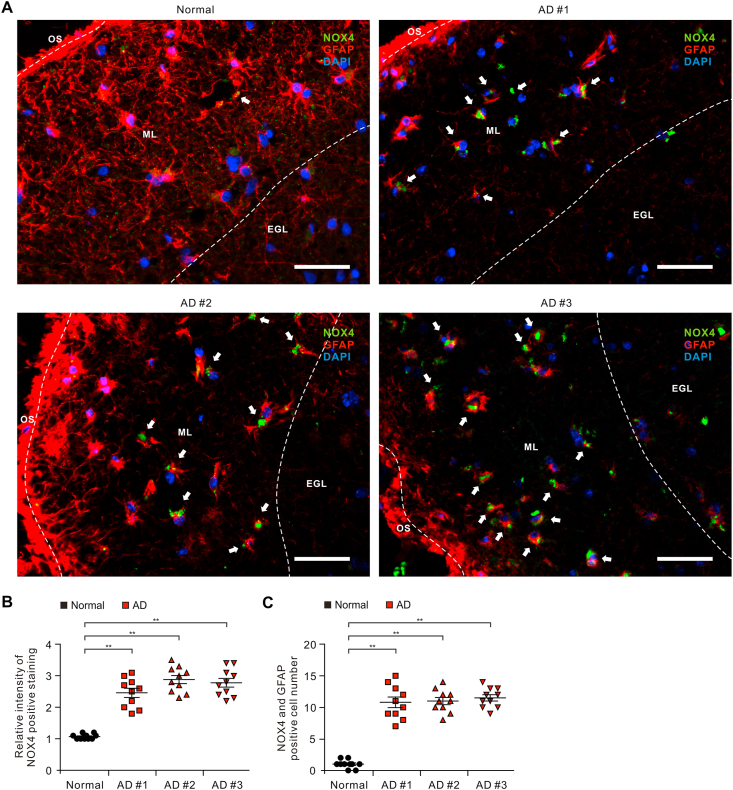
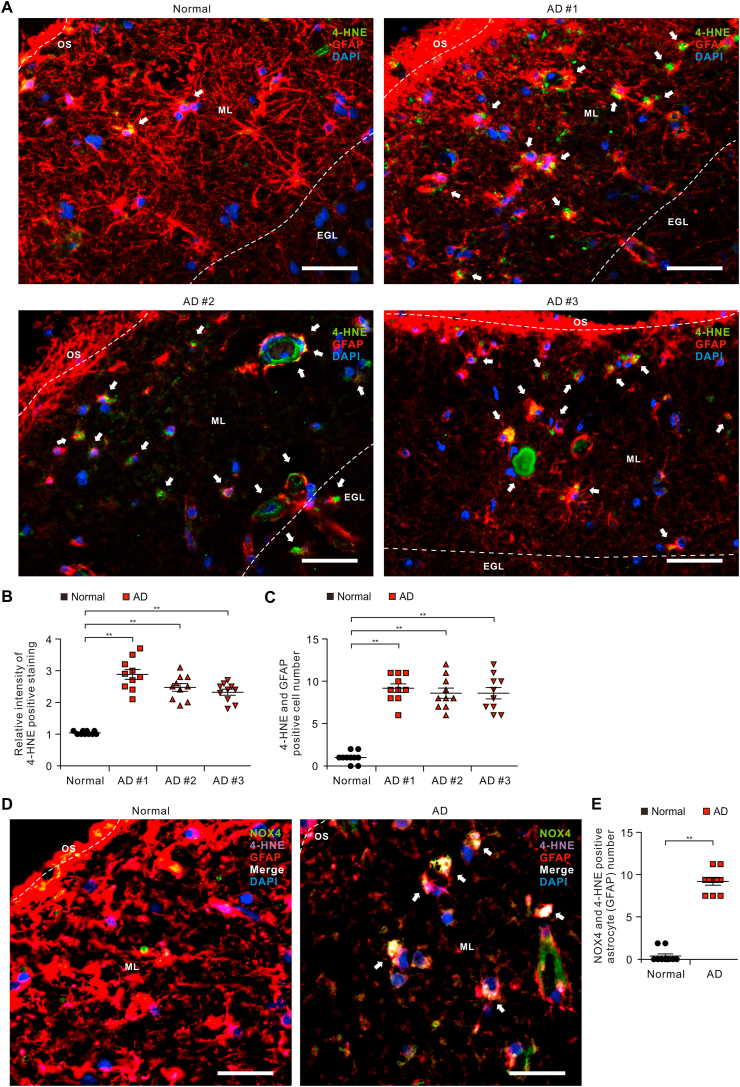
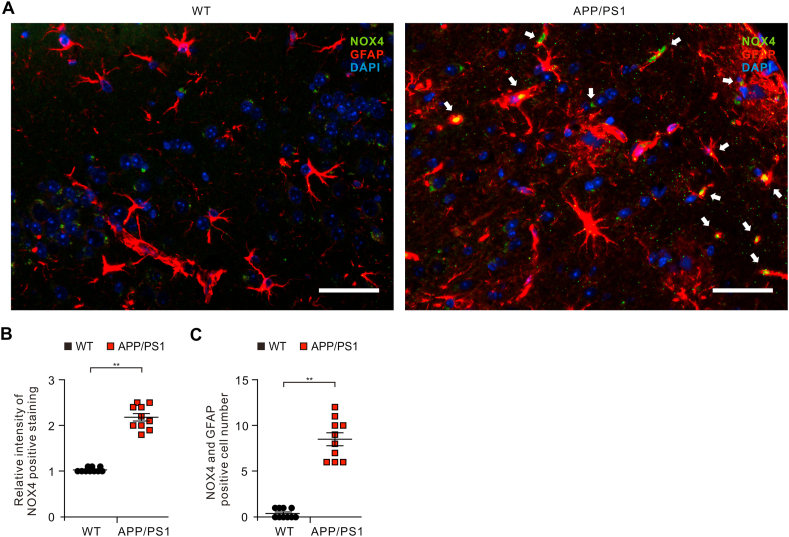
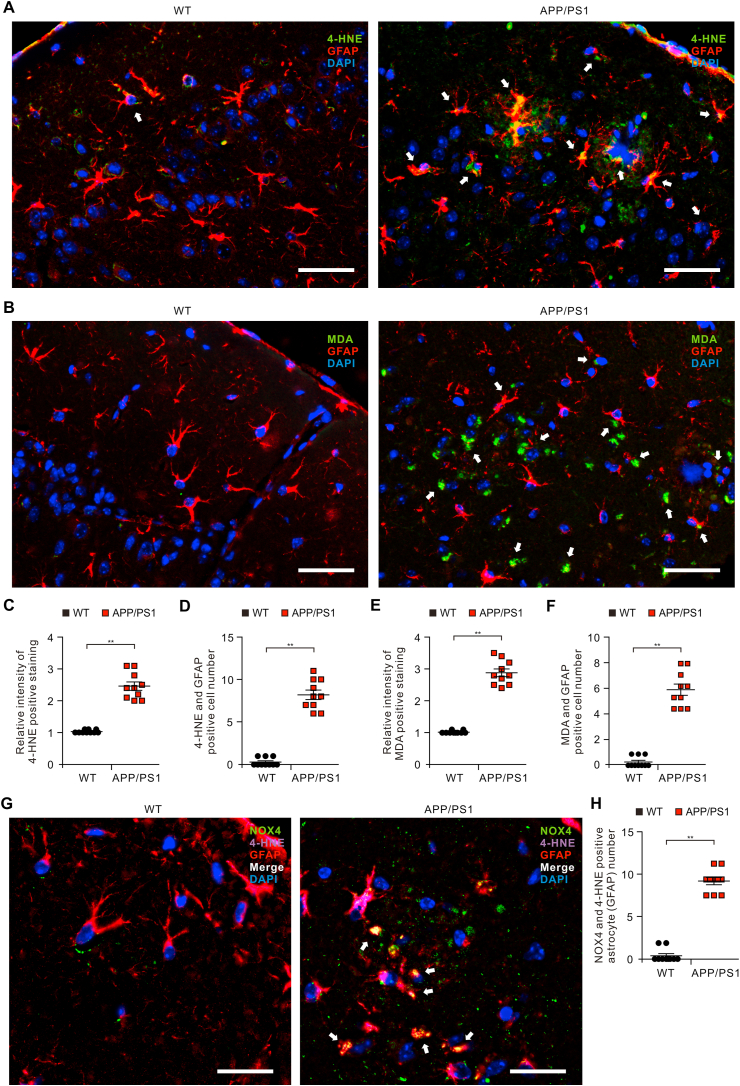
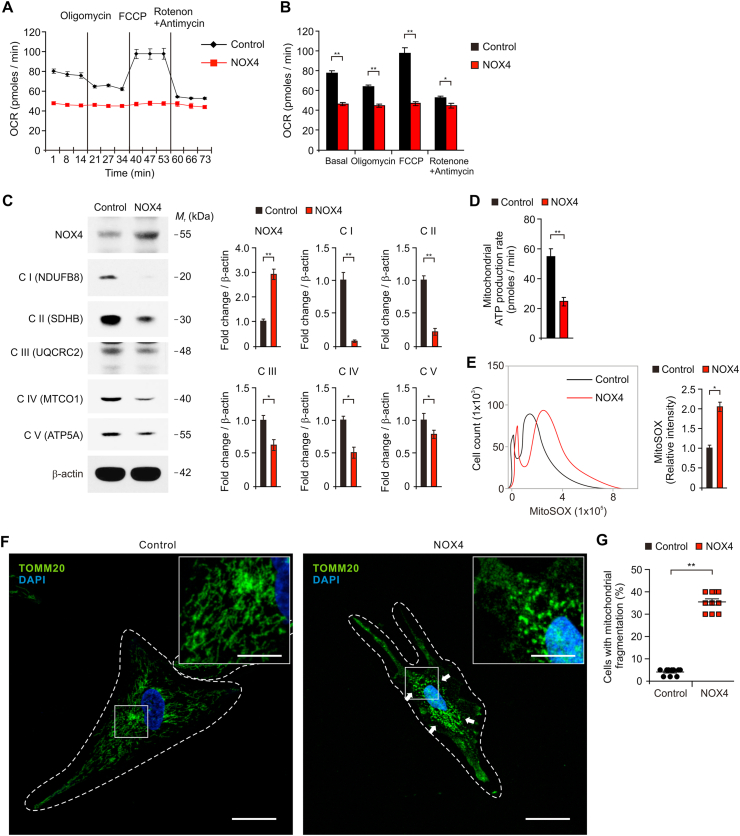
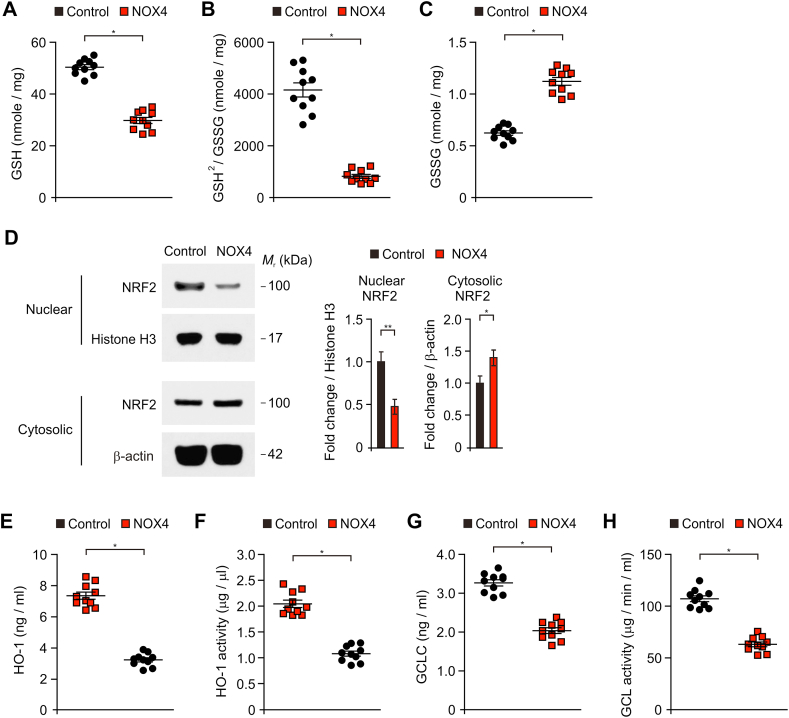
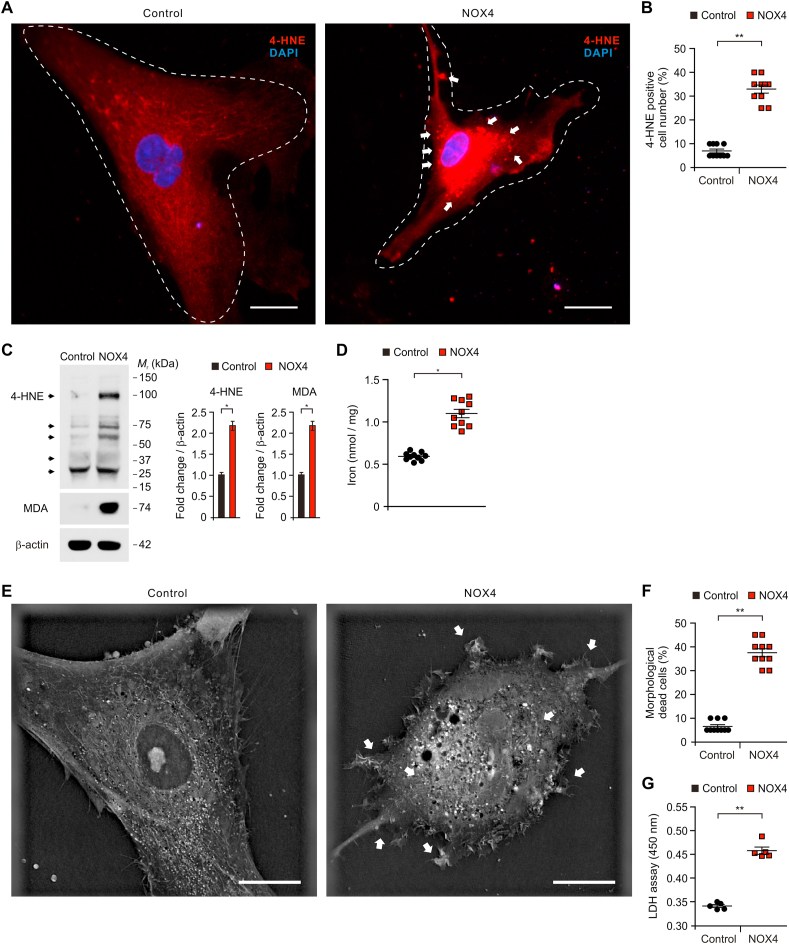
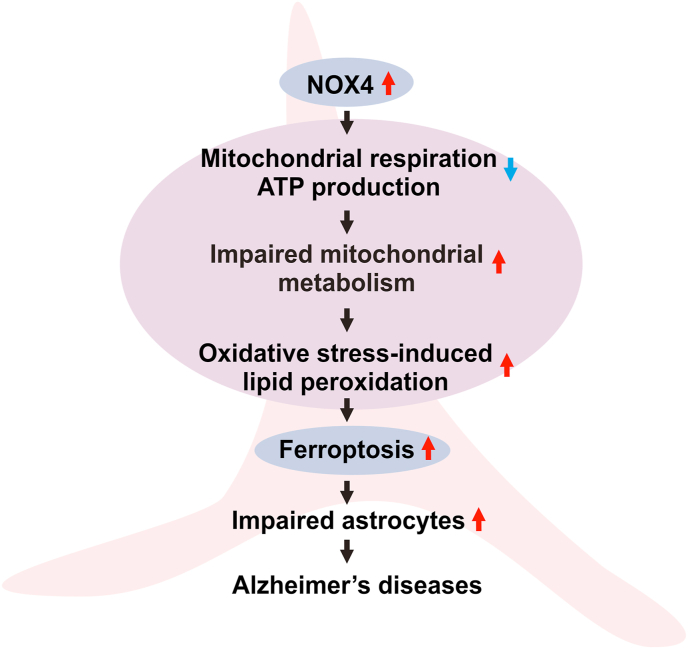
Oxidative stress has been implicated in the pathogenesis of Alzheimer's disease (AD). Mitochondrial dysfunction is linked to oxidative stress and reactive oxygen species (ROS) in neurotoxicity during AD. Impaired mitochondrial metabolism has been associated with mitochondrial dysfunction in brain damage of AD. While the role of NADPH oxidase 4 (NOX4), a major source of ROS, has been identified in brain damage, the mechanism by which NOX4 regulates ferroptosis of astrocytes in AD remains unclear. Here, we show that the protein levels of NOX4 were significantly elevated in impaired astrocytes of cerebral cortex from patients with AD and APP/PS1 double-transgenic mouse model of AD. The levels of 4-hydroxynonenal (4-HNE) and malondialdehyde (MDA), a marker of oxidative stress-induced lipid peroxidation, were significantly also elevated in impaired astrocytes of patients with AD and mouse AD. We demonstrate that the over-expression of NOX4 significantly increases the impairment of mitochondrial metabolism by inhibition of mitochondrial respiration and ATP production via the reduction of five protein complexes in the mitochondrial ETC in human astrocytes. Moreover, the elevation of NOX4 induces oxidative stress by mitochondrial ROS (mtROS) production, mitochondrial fragmentation, and inhibition of cellular antioxidant process in human astrocytes. Furthermore, the elevation of NOX4 increased ferroptosis-dependent cytotoxicity by the activation of oxidative stress-induced lipid peroxidation in human astrocytes. These results suggest that NOX4 promotes ferroptosis of astrocytes by oxidative stress-induced lipid peroxidation via the impairment of mitochondrial metabolism in AD.

Keywords: Alzheimer's disease; Ferroptosis; Mitochondrial metabolism; NOX4; Oxidative stress.


Conflict of interest statement

The authors declare that they have no known competing financial interests or personal relationships that could have appeared to influence the work reported in this paper.

Figures

Fig. 1
Fig. 1
The levels of NOX4 are elevated in impaired astrocytes of the cortex region from patients with Alzheimer's diseases. (A) Representative immunofluorescence images of NOX4 protein expression in cerebral cortex region from patients with AD (AD #1, AD #2, AD #3) or non-AD (normal) showing NOX4 (green) in astrocytes expressing astrocytes marker GFAP (red) around molecular layer (ML) (n = 3 per group, n = 10 images per individual subject). DAPI-stained nuclei are shown in blue. OS, Outer surface; ML, Molecular layer; EGL, External granular layer. Scale bars, 20 μm. White arrows indicate NOX4 and GFAP positive cells. Symbols, which are expressed by white dotted line, indicate the distinct area among OS, ML, and EGL. (B) Quantification of intensity for NOX4 positive staining in astrocytes from immunofluorescence images in the cerebral cortex region from patients with AD (AD #1, AD #2, AD #3) or non-AD (normal) (n = 3 per group, n = 10 images per individual subject). Data are mean ± standard deviation (SD). **, p < 0.01 by Student's two-tailed t-test. (C) Quantification of NOX4 positive astrocytes from immunofluorescence images in the cerebral cortex region from patients with AD (AD #1, AD #2, AD #3) or non-AD (normal) (n = 3 per group, n = 10 images per individual subject). Data are mean ± standard deviation (SD). **, p < 0.01 by Student's two-tailed t-test. (For interpretation of the references to colour in this figure legend, the reader is referred to the Web version of this article.)
Fig. 2
Fig. 2
The levels of oxidative stress-induced lipid peroxidation are elevated in impaired astrocytes of the cortex region from patients with Alzheimer's diseases. (A) Representative immunofluorescence images of 4-HNE protein expression in cerebral cortex region from patients with AD (AD #1, AD #2, AD #3) or non-AD (normal) showing 4-HNE (green) in astrocytes expressing astrocytes marker GFAP (red) around molecular layer (ML) (n = 3 per group, n = 10 images per individual subject). DAPI-stained nuclei are shown in blue. OS, Outer surface; ML, Molecular layer; EGL, External granular layer. Scale bars, 20 μm. White arrows indicate 4-HNE and GFAP positive cells. Symbols, which are expressed by white dotted line, indicate the distinct area among OS, ML, and EGL. (B) Quantification of intensity of 4-HNE positive staining in astrocytes from immunofluorescence images in the cerebral cortex region from patients with AD (AD #1, AD #2, AD #3) or non-AD (normal) (n = 3 per group, n = 10 images per individual subject). Data are mean ± standard deviation (SD). **, p < 0.01 by Student's two-tailed t-test. (C) Quantification of 4-HNE positive astrocytes from immunofluorescence images in the cerebral cortex region from patients with AD (AD #1, AD #2, AD #3) or non-AD (normal) (n = 3 per group, n = 10 images per individual subject). Data are mean ± standard deviation (SD). **, p < 0.01 by Student's two-tailed t-test. (D) Representative immunofluorescence images of 4-HNE protein expression in NOX4-positive astrocytes of patients with AD (AD) or non-AD (normal) showing 4-HNE (purple) in NOX4 (green)-positive astrocytes expressing astrocytes marker GFAP (red) around molecular layer (ML) (n = 10 images per individual subject). DAPI-stained nuclei are shown in blue. Scale bars, 10 μm. White arrows indicate the co-localization of 4-HNE in NOX4-positive astrocytes. (E) Quantification of NOX4 and 4-HNE positive astrocytes from immunofluorescence images in the cerebral cortex region from patients with AD (AD) or non-AD (normal) (n = 10 images per individual subject). Data are mean ± standard deviation (SD). **, p < 0.01 by Student's two-tailed t-test. (For interpretation of the references to colour in this figure legend, the reader is referred to the Web version of this article.)
Fig. 3
Fig. 3
The levels of NOX4 are elevated in impaired astrocytes of the cortex region from brain of APP/PS1 mice. (A) Representative immunofluorescence images of NOX4 protein expression in cortex region from brain of APP/PS1 mice (APP/PS1) or wild-type mice (WT) showing NOX4 (green) in astrocytes expressing astrocytes marker GFAP (red) (n = 5 per group, n = 10 images per individual subject). DAPI-stained nuclei are shown in blue. Scale bars, 20 μm. White arrows indicate NOX4 and GFAP positive cells. (B) Quantification of intensity for NOX4 positive staining in astrocytes from immunofluorescence images in the cortex region from brains of APP/PS1 mice (APP/PS1) or wild-type mice (WT) (n = 5 per group, n = 10 images per individual subject). Data are mean ± standard deviation (SD). **, p < 0.01 by Student's two-tailed t-test. (C) Quantification of NOX4 positive astrocytes from immunofluorescence images in the cortex region from brains of APP/PS1 mice (APP/PS1) or wild-type mice (WT) (n = 5 per group, n = 10 images per individual subject). Data are mean ± standard deviation (SD). **, p < 0.01 by Student's two-tailed t-test. (For interpretation of the references to colour in this figure legend, the reader is referred to the Web version of this article.)
Fig. 4
Fig. 4
The levels of oxidative stress-induced lipid peroxidation are elevated in impaired astrocytes of the cortex region from brains of APP/PS1 mice. (A) Representative immunofluorescence images of 4-HNE protein expression in cortex region from brain of APP/PS1 mice (APP/PS1) or wild-type mice (WT) showing 4-HNE (green) in astrocytes expressing astrocytes marker GFAP (red) (n = 5 per group, n = 10 images per individual subject). DAPI-stained nuclei are shown in blue. Scale bars, 20 μm. White arrows indicate 4-HNE and GFAP positive cells. (B) Quantification of 4-HNE positive staining in astrocytes from immunofluorescence images in the cortex region from brains of APP/PS1 mice (APP/PS1) or wild-type mice (WT) (n = 5 per group, n = 10 images per individual subject). Data are mean ± standard deviation (SD). **, p < 0.01 by Student's two-tailed t-test. (C) Quantification of 4-HNE positive astrocytes from immunofluorescence images of the cortex region from brains of APP/PS1 mice (APP/PS1) or wild-type mice (WT) (n = 5 per group, n = 10 images per individual subject). Data are mean ± standard deviation (SD). **, p < 0.01 by Student's two-tailed t-test. (D) Representative immunofluorescence images of 4-HNE protein expression in NOX4-positive astrocytes of APP/PS1 mice (APP/PS1) or wild-type mice (WT) showing 4-HNE (purple) in NOX4 (green)-positive astrocytes expressing astrocytes marker GFAP (red) (n = 10 images per individual subject). DAPI-stained nuclei are shown in blue. Scale bars, 10 μm. White arrows indicate the co-localization of 4-HNE in NOX4-positive astrocytes. (E) Quantification of NOX4 and 4-HNE positive astrocytes from immunofluorescence images in the cortex region from APP/PS1 mice (APP/PS1) or wild-type mice (WT) (n = 10 images per individual subject). Data are mean ± standard deviation (SD). **, p < 0.01 by Student's two-tailed t-test. (For interpretation of the references to colour in this figure legend, the reader is referred to the Web version of this article.)
Fig. 5
Fig. 5
The elevation of NOX4 promotes oxidative stress by impairment of mitochondrial metabolism via inhibition of mitochondrial respiration and ATP production in human astrocytes. (A) The levels of oxygen consumption rate (OCR) as the parameter of mitochondrial respiration activity and (B) quantification of OCR levels in control (Control) and NOX4 overexpressing (NOX4) human astrocytes. Data are representative of three independent experiments. Data are mean ± SEM. **p < 0.01; *p < 0.05 using two-tailed Student's t-test. (C) Representative immunoblot analysis for five mitochondrial ETC protein levels (left) including NDUFB8 for Complex I (C I (NDUFB8)), SDHB for Complex II (C II (SDHB)), UQCRC2 for Complex III (C III (UQCRC2)), MTCO1 for Complex IV (C IV (MTCO1)) and ATP5F1A for Complex V (C V (ATP5F1A)) in control (Control) and NOX4 overexpressing (NOX4) human astrocytes. Quantification for protein levels of C I (NDUFB8, C II (SDHB), C III (UQCRC2), C IV (MTCO1) and C V (ATP5F1A) (right) in control (Control) and NOX4 overexpressing (NOX4) human astrocytes. For immunoblots, β-actin was used as a loading control. Data are representatives of three independent experiments. Data are mean ± standard deviation (SD). **p < 0.01; *p < 0.05 using two-tailed Student's t-test. (D) Quantification of mitochondrial ATP production rate in control (Control) and NOX4 overexpressing (NOX4) human astrocytes. Data are mean ± SD. **p < 0.01 using two-tailed Student's t-test. (E) Quantification of mtROS levels using MitoSOX staining in control (Control) and NOX4 overexpressing (NOX4) human astrocytes. Data are mean ± SD. *p < 0.05 using two-tailed Student's t-test. (F) Representative immunofluorescence images of mitochondrial morphology for mitochondria fragmentation by Tomm20 staining in control (Control) and NOX4 overexpressing (NOX4) human astrocytes showing Tomm20 (green) (n = 10 per group). DAPI-stained nuclei are shown in blue. The fragmentation of mitochondria is indicated (white arrows). Scale bars, 20 μm. Magnified views of the selected regions (upper right); scale bars, 5 μm. (G) Quantification of cells with mitochondrial fragmentation from immunofluorescence images of mitochondrial morphology in control (Control) and NOX4 overexpressing (NOX4) human astrocytes (n = 10 per group). (The percent of morphological dead cells in a total of 100 cells of 10 individual images per group was calculated). Symbols expressed by white dotted line indicate the shape of cells. Data are mean ± SD. **, p < 0.01 by Student's two-tailed t-test. (For interpretation of the references to colour in this figure legend, the reader is referred to the Web version of this article.)
Fig. 6
Fig. 6
NOX4-induced mitochondrial metabolic impairment induces oxidative stress by inhibition of cellular antioxidant process in human astrocytes. (A-C) Quantification of (A) reduced GSH levels, (B) ratio of GSH2/GSSG, and (C) GSSG levels in control (Control) and NOX4 overexpressing (NOX4) human astrocytes (n = 10 per group). Data are mean ± SD. *, p < 0.01 by Student's two-tailed t-test. (D) Representative immunoblot analysis for nuclear and cytosolic NRF2 in control (Control) and NOX4 overexpressing (NOX4) human astrocytes. For immunoblots, Histone H3 (nuclear) and β-actin (cytosolic) was used as a loading control. Data are representative of three independent experiments. Data are mean ± SD. **, p < 0.01; *, p < 0.05 using the two-tailed Student's t-test. (E–F) Quantification of (E) HO-1 protein levels, (F) HO-1 activity, (G) GCLC protein levels and (F) GCL activity in control (Control) and NOX4 overexpressing (NOX4) human astrocytes (n = 10 per group). Data are mean ± SD. *, p < 0.01 by Student's two-tailed t-test.
Fig. 7
Fig. 7
NOX4 promotes ferroptosis by oxidative stress-induced lipid peroxidation in human astrocytes. (A) Representative immunofluorescence images of 4-HNE expression in control (Control) and NOX4 overexpressing (NOX4) human astrocytes showing 4-HNE (red) (n = 10 per group). DAPI-stained nuclei are shown in blue. The shape of cells showed shrinkage and lipid peroxidation-derived droplets in the plasma membrane were indicated (white arrows). Symbols expressed by white dotted line indicate the shape of cells. Scale bars, 20 μm. (B) Quantification of 4-HNE positive astrocytes from immunofluorescence images in control (Control) and NOX4 overexpressing (NOX4) human astrocytes (n = 10 per group) (The percent of morphological dead cells in a total of 100 cells of 10 individual images per group was calculated). Data are mean ± standard deviation (SD). **, p < 0.01 by Student's two-tailed t-test. (C) Representative immunoblot analysis for 4-HNE and MDA protein levels (left) and quantification for 4-HNE and MDA protein levels in control (Control) and NOX4 overexpressing (NOX4) human astrocytes. For immunoblots, β-actin was used as a loading control. Data are representative of three independent experiments. Data are mean ± SD. *p < 0.05 using the two-tailed Student's t-test. (D) Quantification of iron levels in control (Control) and NOX4 overexpressing (NOX4) human astrocytes (n = 10 per group). Data are mean ± standard deviation (SD). *, p < 0.05 by Student's two-tailed t-test. (E) Representative 3D images of control (Control) and NOX4 overexpressing (NOX4) human astrocytes (n = 10 images per group). The morphological features of cytotoxicity were indicated (white arrows). Scale bars, 20 μm. (F) Quantification of the morphological dead cells in control (Control) and NOX4 overexpressing (NOX4) human astrocytes (n = 10 per group) (The percent of morphological dead cells in total 100 cells in 10 individual images per group). Data are mean ± SD. **, p < 0.01 using the two-tailed Student's t-test. (G) Cytotoxicity assay in control (Control) and NOX4 overexpressing (NOX4) human astrocytes was determined by lactate dehydrogenase (LDH) levels. Data are representatives of three independent experiments. Each experiment was done in triplicate. Data are mean ± SD. **, p < 0.01 using two-tailed Student's t-test. (For interpretation of the references to colour in this figure legend, the reader is referred to the Web version of this article.)
Fig. 8
Fig. 8
A schematic diagram to summarize our new findings. Red arrow means an increase. Blue arrow means a decrease in the diagram. (For interpretation of the references to colour in this figure legend, the reader is referred to the Web version of this article.)

References

    1. Selkoe D.J. Alzheimer's disease: genes, proteins, and therapy. Physiol. Rev. 2001;81(2):741–766. doi: 10.1152/physrev.2001.81.2.741. - DOI - PubMed
    1. Butterfield D.A., Halliwell B. Oxidative stress, dysfunctional glucose metabolism and Alzheimer disease. Nat. Rev. Neurosci. 2019;20(3):148–160. doi: 10.1038/s41583-019-0132-6. - DOI - PMC - PubMed
    1. Huang W.J., Zhang X., Chen W.W. Role of oxidative stress in Alzheimer's disease. Biomed Rep. 2016;4(5):519–522. doi: 10.3892/br.2016.630. - DOI - PMC - PubMed
    1. Butterfield D.A., Drake J., Pocernich C., Castegna A. Evidence of oxidative damage in Alzheimer's disease brain: central role for amyloid beta-peptide. Trends Mol. Med. 2001;7(12):548–554. doi: 10.1016/s1471-4914(01)02173-6. - DOI - PubMed
    1. Perez Ortiz J.M., Swerdlow R.H. Mitochondrial dysfunction in Alzheimer's disease: role in pathogenesis and novel therapeutic opportunities. Br. J. Pharmacol. 2019;176(18):3489–3507. doi: 10.1111/bph.14585. - DOI - PMC - PubMed

Publication types