. 2021;43(1):27-42.
doi: 10.1159/000514709. Epub 2021 Mar 26.

Developing Brain Glucose Transporters, Serotonin, Serotonin Transporter, and Oxytocin Receptor Expression in Response to Early-Life Hypocaloric and Hypercaloric Dietary, and Air Pollutant Exposures

Affiliations

Developing Brain Glucose Transporters, Serotonin, Serotonin Transporter, and Oxytocin Receptor Expression in Response to Early-Life Hypocaloric and Hypercaloric Dietary, and Air Pollutant Exposures

Xin Ye et al. Dev Neurosci. 2021.

Abstract

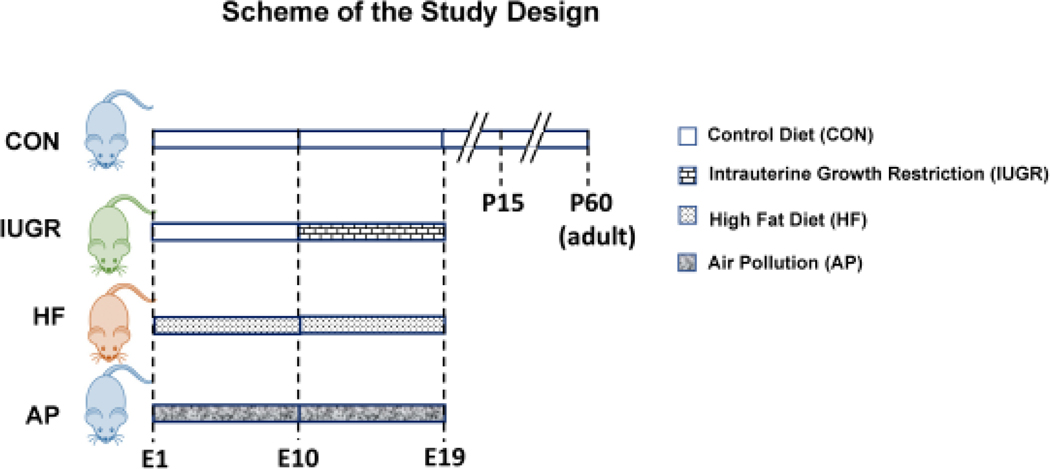
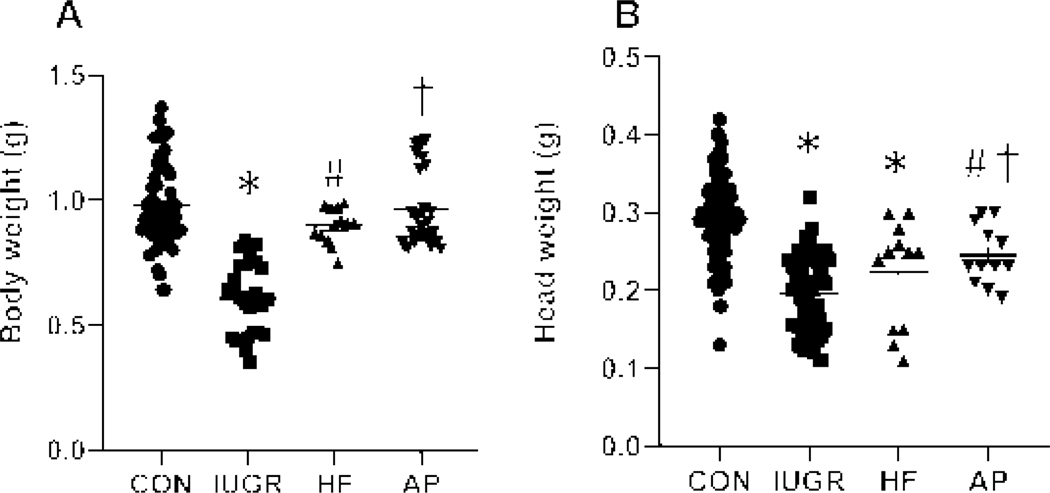
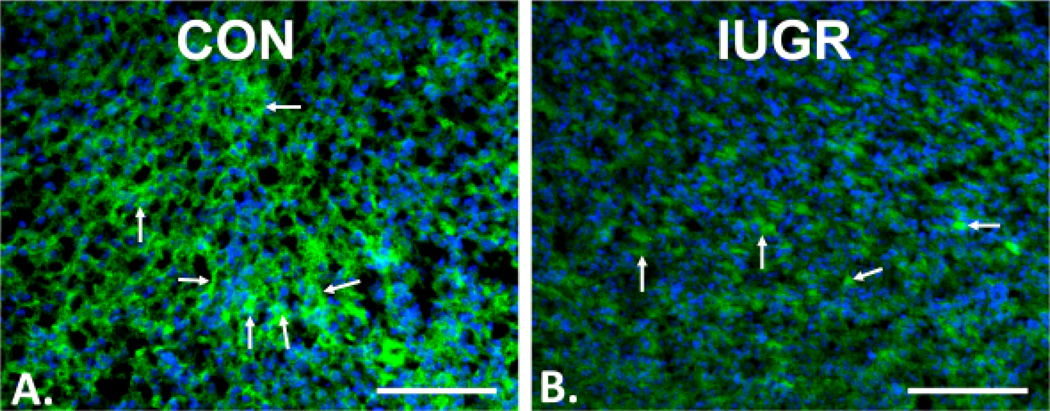
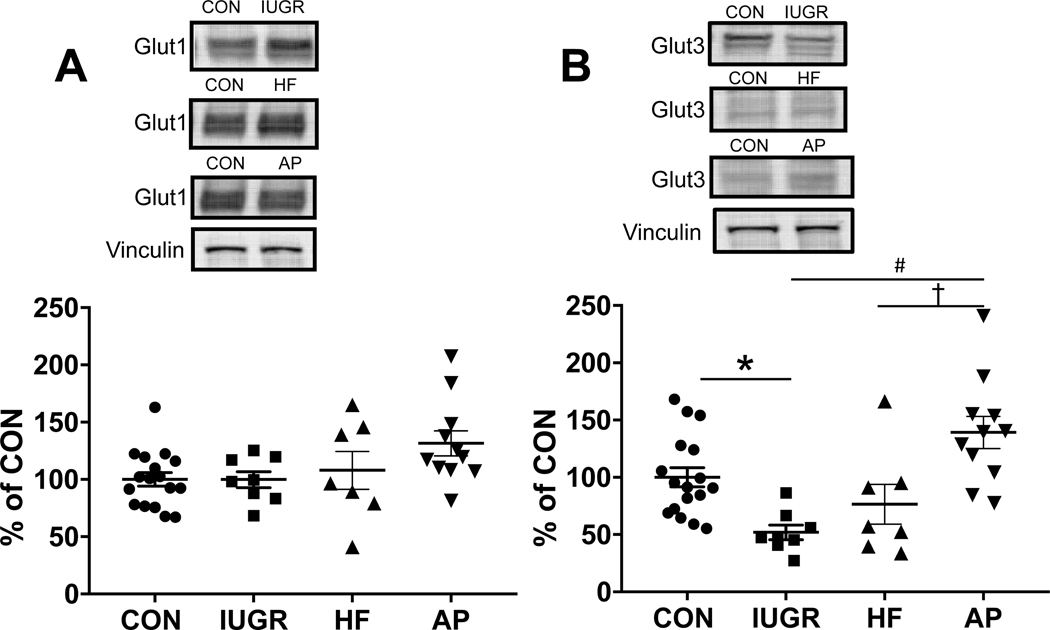
Perturbed maternal diet and prenatal exposure to air pollution (AP) affect the fetal brain, predisposing to postnatal neurobehavioral disorders. Glucose transporters (GLUTs) are key in fueling neurotransmission; deficiency of the neuronal isoform GLUT3 culminates in autism spectrum disorders. Along with the different neurotransmitters, serotonin (5-HT) and oxytocin (OXT) are critical for the development of neural connectivity. Serotonin transporter (SERT) modulates synaptic 5-HT levels, while the OXT receptor (OXTR) mediates OXT action. We hypothesized that perturbed brain GLUT1/GLUT3 regulated 5-HT-SERT imbalance, which serves as a contributing factor to postnatal neuropsychiatric phenotypes, with OXT/OXTR providing a counterbalance. Employing maternal diet restriction (intrauterine growth restriction [IUGR]), high-fat (HF) dietary modifications, and prenatal exposure to simulated AP, fetal (E19) murine brain 5-HT was assessed by ELISA with SERT and OXTR being localized by immunohistochemistry and measured by quantitative Western blot analysis. IUGR with lower head weights led to a 48% reduction in male and female fetal brain GLUT3 with no change in GLUT1, when compared to age- and sex-matched controls, with no significant change in OXTR. In addition, a ∼50% (p = 0.005) decrease in 5-HT and SERT concentrations was displayed in fetal IUGR brains. In contrast, despite emergence of microcephaly, exposure to a maternal HF diet or AP caused no significant changes. We conclude that in the IUGR during fetal brain development, reduced GLUT3 is associated with an imbalanced 5-HT-SERT axis. We speculate that these early changes may set the stage for altering the 5HT-SERT neural axis with postnatal emergence of associated neurodevelopmental disorders.

Keywords: Environmental exposure; Fetal brain; Intrauterine growth restriction; Neurodevelopment; Neurotransmitters.


Conflict of interest statement

Conflict of Interest Statement

The authors declare no competing financial interests.

Figures

Figure 1.
Figure 1.. Experimental Design:
Scheme demonstrates the experimental design: 1) Compared to CON mothers reared on regular chow diet, 2) intrauterine growth restriction (IUGR) group mothers received reduced regular chow diet from gestational day 10 to 19. 3) In the High fat diet (HF) group mothers received HF diet for 8 weeks prior to pregnancy plus during gestation day 1 to 19. 4) AP group mothers received SRM1649 (air pollution) intra-nasally while being reared on a regular chow diet from E1 to E18, while the respective CON received intra-nasal saline.
Figure 2.
Figure 2.. Fetal (E19) Body weights (A) and Head weights (B).
Fetal (E19) Body (A) and Head (B) Weights are depicted in all four experimental groups. Body weights (A), one-way ANOVA, F-statistic: 3, 125=39.18, p<0.0001, by Sidak’s multiple comparisons post-hoc test, *p<0.0001 vs CON, #p<0.0001 or †p<0.0001 vs IUGR; n=61 in CON, n=27 in IUGR, n=13 in HF and n=28 in AP. Head weights (B), one-way ANOVA, F-statistic: 3, 165=40.06, p<0.0001, by Sidak’s multiple comparisons post-hoc test, *p=0.0001 or #p=0.0217 vs CON, †p=0.0213 vs IUGR; n=92 in CON, n=53 in IUGR, n=12 in HF and n=12 in AP. Data are shown as means ± standard error of the mean.
Figure 3.
Figure 3.. Immunofluorescence localization of Glut3
Alexa 488, green in neural membranes, shown by arrows in the E19 fetal brain (cortex) of CON (A) and IUGR (B) groups, with DAPI nuclear stain (blue). The expression of Glut3 protein was decreased in the cortex of IUGR compared to CON. Scale bar = 100 μM.
Figure 4.
Figure 4.. Western blot analysis of Glut1 (A) & Glut3 (B).
Top panels show representative blots with Glut1 & Glut3 shown above and vinculin as the internal loading control shown below. Glut1 and Glut3 protein concentrations quantified by Western Blot analysis in IUGR, HF and AP vs. CON. Glut1 expression in the CON, IUGR, HF and AP groups (A). There are no significant differences between groups (one-way ANOVA, F-statistic: 3, 39=2.651, p=0.0621, n=17 for CON, n= 8 for IUGR, n=7 for HF and n=11 for AP). However, Glut3 concentrations were significantly decreased to 48% in IUGR when compared to CON (B). In addition, in the AP group, brain Glut3 concentrations were 2.7 fold-increased or 1.8 fold-increased when compared to IUGR or HF respectively (B) (one-way ANOVA, F-statistic: 3, 39=8.981, p=0.0001, n=17 for CON, n= 8 for IUGR, n=7 for HF and n=11 for AP; Sidak’s multiple comparisons post-hoc test, *p=0.0318, CON vs. IUGR; #p<0.0001, IUGR vs. AP; †p=0.009, HF vs. AP). Data are shown as means ± standard error of the mean.
Figure 5.
Figure 5.. SERT and synaptophysin immunolocalization:
Dual immunofluorescence localization of SERT (Alexa 594, arrows) and synaptophysin (Alexa 488, arrowheads) in mouse E19 fetal cerebral cortex is demonstrated. DAPI was used as the nuclear stain. Scale bar = 100 μm.
Figure 6.
Figure 6.. Quantification of serotonin and SERT:
The graphs demonstrate E19 brain serotonin concentrations quantified by ELISA (A) and SERT concentrations quantified by Western Blot analysis (B), in IUGR, HF and AP vs. CON. Serotonin: Fetal murine brain serotonin concentrations (A) decreased in the IUGR but not in HF or AP groups when compared to CON. (one-way ANOVA, F-statistic: 3, 36=4.605, p=0.0079, n=15 for CON, n=7 for HF, n=8 for IUGR, and n=10 for AP; Tukey’s post-hoc test demonstrates *p=0.0037 in IUGR vs CON). When comparing IUGR to HF and AP groups, no significant differences emerged, although the AP group trended higher than IUGR (p=0.0974). SERT protein: (B) Top panels display representative blots of SERT shown above and β-actin as the internal loading control shown below. The bottom graphs depict quantification of Western blots demonstrating decreased SERT in the IUGR group when compared to age-matched CON (*p<0.0001), HF (#p=0.0005) and AP (*p<0.0001) groups (one-way ANOVA, F-statistic: 3, 48=12.41, p<0.0001, n=25 for CON, n=7 for HF, n=8 for IUGR, and n=12 for AP; Tukey’s post-hoc test, *p<0.0001 vs CON or AP; #p=0.0005 vs HF). Data are shown as means ± standard error of the mean.
Figure 7.
Figure 7.. Immunofluorescence localization of oxytocin receptor (OXTR):
Alexa 488, green in the hypothalamus (A & B) and hippocampus (C & D) of postnatal day 15 brain (cortex) with DAPI nuclear stain (A & C, blue). The OXTR protein was expressed in neural membranes (arrows). Scale bar = 100 μM.
Figure 8.
Figure 8.. Quantification of OXTR:
Ontogeny studies: Examination of oxytocin receptor (OXTR) at E19, PN (postnatal) 15 and adult (2 months old) mouse cortices. Western blot analysis showing representative blots in insets that depict cortical OXTR (~43 kD) (top panels) with vinculin (vin; bottom panels, internal loading control), and quantification expressed as a percent of the E19 value (A-C) or of the E19 CON value (D), depicted in graphs. Males (A), females (B) and males and females combined (C) are demonstrated. In males (A), the expression of OXTR significantly increased in PN15 and adult compared to E19 (one-way ANOVA, F-statistic: 2, 9=10.64, p=0.0043, n=4 each group; Sidak post-hoc test, *p=0.05 vs E19, #p=0.0041 vs E19). In females (B), there was no differences among the three groups of females (one-way ANOVA, F-statistic: 2, 9=2.877, p=0.1081, n=4 each group; Sidak post-hoc test; P15 vs E19, p=0.4027: adult vs E19, p=0.1219: adult vs P15, p=0.8170). However, in the combined groups of males and females (C), the amount of OXTR significantly increased in adult compared to E19 (one-way ANOVA, F 2, 21=7.145, p=0.0043, n=8 each group; Sidak post-hoc test, P15 vs E19, p=0.09: adult vs E19, *p=0.0035: adult vs P15, p=0.4078). In the E19 brain OXTR concentrations of CON, IUGR, HF and AP groups (D), there was no significant difference observed despite a trend towards a 16% decrease in the AP group when compared to CON (one-way ANOVA, F-statistic: 3, 39=0.7615, p=0.5225, n=17 for CON, n= 8 for IUGR, n=7 for HF and n=11 for AP). Data are shown as means ± standard error of the mean.

Similar articles

Cited by

References

    1. Mergenthaler P, Lindauer U, Dienel GA, Meisel A. Sugar for the brain: the role of glucose in physiological and pathological brain function. Trends Neurosci. 2013. October;36(10):587–97. - PMC - PubMed
    1. Dienel GA. Brain Glucose Metabolism: Integration of Energetics with Function. Physiol Rev. 2019. January 1;99(1):949–1045. - PubMed
    1. Mitanchez D. [Ontogenesis of glucose regulation in neonate and consequences in neonatal management]. Arch Pediatr. 2008. January;15(1):64–74. - PubMed
    1. Takata K, Hirano H, Kasahara M. Transport of glucose across the blood-tissue barriers. Int Rev Cytol. 1997;172:1–53. - PubMed
    1. Khan JY, Rajakumar RA, McKnight RA, Devaskar UP, Devaskar SU. Developmental regulation of genes mediating murine brain glucose uptake. The American journal of physiology. 1999. March;276(3):R892–900. - PubMed

Publication types