. 2021 Jun;141(6):901-915.
doi: 10.1007/s00401-021-02299-y. Epub 2021 Mar 28.

Single-cell profiling of myasthenia gravis identifies a pathogenic T cell signature

Affiliations

Single-cell profiling of myasthenia gravis identifies a pathogenic T cell signature

Florian Ingelfinger et al. Acta Neuropathol. 2021 Jun.

Erratum in

  • Correction to: Single‑cell profiling of myasthenia gravis identifies a pathogenic T cell signature.
    Ingelfinger F, Krishnarajah S, Kramer M, Utz SG, Galli E, Lutz M, Zwicky P, Akarca AU, Jurado NP, Ulutekin C, Bamert D, Widmer CC, Piccoli L, Sallusto F, Núñez NG, Marafioti T, Schneiter D, Opitz I, Lanzavecchia A, Jung HH, De Feo D, Mundt S, Schreiner B, Becher B. Ingelfinger F, et al. Acta Neuropathol. 2021 Oct;142(4):789. doi: 10.1007/s00401-021-02359-3. Acta Neuropathol. 2021. PMID: 34406497 Free PMC article. No abstract available.

Abstract

Myasthenia gravis (MG) is an autoimmune disease characterized by impaired neuromuscular signaling due to autoantibodies targeting the acetylcholine receptor. Although its auto-antigens and effector mechanisms are well defined, the cellular and molecular drivers underpinning MG remain elusive. Here, we employed high-dimensional single-cell mass and spectral cytometry of blood and thymus samples from MG patients in combination with supervised and unsupervised machine-learning tools to gain insight into the immune dysregulation underlying MG. By creating a comprehensive immune map, we identified two dysregulated subsets of inflammatory circulating memory T helper (Th) cells. These signature ThCD103 and ThGM cells populated the diseased thymus, were reduced in the blood of MG patients, and were inversely correlated with disease severity. Both signature Th subsets rebounded in the blood of MG patients after surgical thymus removal, indicative of their role as cellular markers of disease activity. Together, this in-depth analysis of the immune landscape of MG provides valuable insight into disease pathogenesis, suggests novel biomarkers and identifies new potential therapeutic targets for treatment.

Keywords: Autoimmunity; Biomarker; Cytokines; Immunophenotyping; Mass cytometry; Myasthenia gravis; Thymus; Tissue-resident T cells.


Conflict of interest statement

The authors declare no competing interests.

Figures
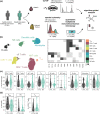
Fig. 1
Fig. 1
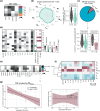
The canonical peripheral immune landscape of MG patients does not differ from that of healthy individuals. a Cryopreserved peripheral blood mononuclear cells (PBMCs) from myasthenia gravis patients (MG, n = 38) and healthy controls (CTRL, n = 21) were labeled with a panel of antibodies recognizing either surface markers or intracellular cytokines (following brief antigen-independent restimulation) and data acquired by CyTOF. Thymic leukocytes from MG patients (n = 4) and non-MG incidental mass lesion controls (n = 6) were analyzed in a similar manner by partially overlapping spectral flow cytometry panels. Thymic tissue sections of MG patients (n = 13) and non-MG controls (n = 6) were analyzed by quantitative multiplexed immunofluorescence microscopy. The resulting datasets were analyzed using a data-driven high-dimensional approach using supervised and unsupervised machine-learning algorithms. b UMAP of 100,0000 cells randomly sampled from the combined dataset. Color code indicates FlowSOM clustering and manual annotation according to lineage marker expression profiles presented in the heatmap. Tregs regulatory T cells, DCs dendritic cells, NK natural killer. c Violin plots showing the frequency of the FlowSOM-generated immune clusters in healthy controls and MG patients that did not receive immunomodulatory treatment. d Violin plots showing the frequency of memory B cells (BMEM), plasmablasts (PB) and peripheral follicular T helper cells (TFH) in healthy controls and MG patients obtained by subclustering the B cell and CD4+ T cell compartments. Violin plots contain a bold horizontal line depicting the respective group mean. If not indicated, the differences between experimental groups were statistically not significant (p > 0.05) using a nonparametric Mann–Whitney–Wilcoxon test with a false-discovery correction according to the Benjamini–Hochberg approach
Fig. 2
Fig. 2
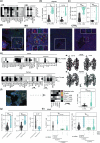
Reduced cytokine polarization and systemic TNF-producing CD103+ T cells represent an MG-specific signature. a Heat map showing relative expression of the indicated activation markers within naïve, memory and effector subsets of CD4+ T cells obtained by FlowSOM clustering. b Radar plot (left panel) representing the cytokine profile of antigen-experienced CD4+ T cell subsets (TEff, TEM and TCM). The colored line indicates the Cohen’s d effect size for each cytokine (MG vs. CTRL) as a deviation from the gray dashed reference line. Th cytokine profiles were manually annotated based on partially overlapping key cytokines. The violin plot (right panel) shows the frequency of GM-CSF+ cells among antigen-experienced CD4+ T cells in control and MG patients. TCM central memory T, TEM effector memory T, TEff effector T, TN naive T. c Subset composition of the GM-CSF-producing Th cell population within all patients’ blood (MG and CTRL; upper panel); and relative abundance of GM-CSF-producing cells within the CD4+ TEM population (bottom panel) in control and MG patients (left), and in low and high disease severity newly diagnosed treatment-naïve MG patients (right). Clinical disease severity was determined by the modified quantitative MG score, with low disease severity scoring < 0.5, and high disease severity ≥ 0.5. d Cytokine expression analysis of CD4+ TEM cells. FlowSOM yielded 13 cytokine expressing clusters (c1–c13; determined by consensus clustering). Corresponding expression profiles (left box) as well as statistical parameters (right box) are displayed. Blue color indicates high significance (low p value) for the comparison of treatment-naïve MG patients vs. CTRL, red color indicates high significance and high R2 value, respectively, for the correlation with the continuous clinical disease severity. e Heatmap comparing follicular Th cells (TFH) and CD103+ Th cells (ThCD103) to conventional Th cells. f Row-normalized heatmap of cytokine positivity for 13 detected cytokines among peripheral Th subsets for all patients present in the cohort. g Correlation between the frequency of TNF-producing ThCD103 cells (left panel) or serum anti-AChR antibody titer (right panel) and the modified quantitative MG score as a measure of clinical disease severity for newly diagnosed patients neither receiving immunomodulatory nor symptomatic treatment. Violin plots contain a bold horizontal line depicting the respective group mean. If not indicated, differences between experimental groups were statistically not significant (p > 0.05) using a nonparametric Mann–Whitney–Wilcoxon test with a false-discovery correction according to the Benjamini–Hochberg approach. *p < 0.05. For correlation analysis, statistical parameters were obtained using a linear regression model. Shaded areas in g represent the 95% confidence interval
Fig. 3
Fig. 3
Thymi of MG patients are infiltrated by Th cells and B cells. a Scaffold of the mass cytometry run of the peripheral immune compartment of MG patients and the corresponding maps of the thymic leukocyte landscape of MG patients and non-MG controls determined by flow cytometry. Heatmap below depicts FlowSOM clustering of thymus samples. b Violin plots showing frequency of FlowSOM-generated thymic immune clusters for MG patients and incidental non-MG mass lesions. c Force-directed layout depicting the network of B cells present in the thymus. Color coding indicates FlowSOM clustering into subpopulations as shown in the heatmap (right panel). MZ marginal zone, BMEM memory B. d Violin plots showing frequencies of different B cell subpopulations in the thymus of MG patients and non-MG controls. Pie charts depict the median frequency of peripheral and thymic B cell populations in MG patients. Violin plots contain a bold horizontal line depicting the respective group mean. If not indicated, differences between experimental groups were statistically not significant (p > 0.05) using a nonparametric Mann–Whitney–Wilcoxon test with a false-discovery correction according to the Benjamini–Hochberg approach. *p < 0.05
Fig. 4
Fig. 4
Signature Th cells are enriched in medullary regions of MG thymi and rebound in the blood after thymectomy. a Heatmap of surface markers and cytokine expression profiles of FlowSOM-generated Th subsets. b Violin plots comparing the frequencies of TFH cells and the corresponding frequency of IL-21 expression among TFH cells in MG patients vs non-MG patients. c Violin plot showing the frequency of GM-CSF expressing Th cells (ThGM) and ThCD103 cells in the thymi of MG and non-MG patients. d Immunofluorescence labeling of medullary thymic regions showing GM-CSF (red), CD4 (green), CD3 (magenta) and DAPI (blue). Samples from 7 MG patients and 5 non-MG controls were analyzed. Scale bar: 30 µm. Images of the single labels are enlargements of specified regions. Representative images of two independent experiments (1 slide with 3 sections/patient each) are shown. Left: MG, early onset, female MG patient without immunosuppressive therapy and thymus follicular hyperplasia, right: CTRL, patient with incidental mass, residual thymus tissue. HC Hassall’s corpuscle. e Heatmap of surface markers and cytokine expression profiles of FlowSOM-generated Th subsets in blood and thymus (left panel). Thymic expression profiles from both panels were clustered analogously using FlowSOM and displayed as combined expression profiles. Scaffold of the blood and thymic Th cell compartment in MG patients (right panel). Color overlay depicts expression of CD103 and CD69. f Heatmap of expression profiles of FlowSOM-generated cell clusters for quantitative immunofluorescence data of thymic regions after cell segmentation (middle panel). Colors correspond to the populations shown in Fig. S5f. Violin plots showing the frequency of ThCD103 cells within DAPI+ cells of MG patients and incidental mass lesion controls (right panel). PANCK pan-Cytokeratin. g Violin plots showing the frequency of ThGM and ThCD103 cells, and the frequency of IL-22 production within ThCD103 cells, in the blood of MG patients with or without thymectomy that did not receive further immunomodulatory treatment. h Violin plots showing the frequency of ThCD103 and ThGM cells in the blood of MG patients without treatment or with thymectomy (TMC) and/or azathioprine (AZA) treatment. Violin plots contain a bold horizontal line depicting the respective group mean. If not indicated, differences between experimental groups were statistically not significant (p > 0.05) using a nonparametric Mann–Whitney–Wilcoxon test with a false-discovery correction according to the Benjamini–Hochberg approach. *p < 0.05; **p < 0.01

References

    1. Alshekhlee A, Miles JD, Katirji B, Preston DC, Kaminski HJ. Incidence and mortality rates of myasthenia gravis and myasthenic crisis in US hospitals. Neurology. 2009 doi: 10.1212/WNL.0b013e3181a41211. - DOI - PubMed
    1. Balandina A, Lécart S, Dartevelle P, Saoudi A, Berrih-Aknin S. Functional defect of regulatory CD4+CD25+ T cells in the thymus of patients with autoimmune myasthenia gravis. Blood. 2005 doi: 10.1182/blood-2003-11-3900. - DOI - PMC - PubMed
    1. Benjamini Y, Hochberg Y. Controlling the false discovery rate: a practical and powerful approach to multiple testing. J R Stat Soc Ser B. 1995 doi: 10.1111/j.2517-6161.1995.tb02031.x. - DOI
    1. Berrih-Aknin S, Cohen-Kaminsky S, Lepage V, Neumann D, Bach JF, Fuchs S. T-cell antigenic sites involved in myasthenia gravis: correlations with antibody titre and disease severity. J Autoimmun. 1991 doi: 10.1016/0896-8411(91)90013-3. - DOI - PubMed
    1. Berrih-Aknin S, Morel E, Raimond F, Safar D, Gaud C, Binet JP, et al. The role of the thymus in myasthenia gravis: immunohistological and immunological studies in 115 cases. Ann N Y Acad Sci. 1987 doi: 10.1111/j.1749-6632.1987.tb51282.x. - DOI - PubMed

Publication types

MeSH terms