

Global patterns in vision loss burden due to vitamin A deficiency from 1990 to 2017
- PMID: 33775269
- PMCID: PMC10195433
- DOI: 10.1017/S1368980021001324
Global patterns in vision loss burden due to vitamin A deficiency from 1990 to 2017
Abstract
Objective: To investigate the vision loss burden due to vitamin A deficiency (VAD) at the global, regional and national levels by year, age, sex and socio-economic status using prevalence and years lived with disability (YLD).
Design: International, retrospective, comparative burden-of-disease study.
Setting: Prevalence and YLD data were extracted from the Global Burden of Disease (GBD) Study 2017. The association of age-standardised YLD rates and human development index (HDI) was tested by Pearson correlation and linear regression analyses. The Gini coefficient and concentration index (CI) were calculated to demonstrate the trends in between-country inequality in vision loss burden due to VAD.
Participants: All participants met the GBD inclusion criteria.
Results: The age-standardised prevalence rate increased by 9·2 %, while the age-standardised YLD rates rose by 10·8 % from 1990 to 2017. Notably, the vision loss burden caused by VAD showed a declining trend since 2014. The vision loss burden was more concentrated in the post-neonatal age group and decreased with increasing age. The age-standardised YLD rates were inversely correlated with HDI (r = -0·2417, P = 0·0084). The CI and Gini coefficients indicated that socio-economic-related and between-country inequality declined from 2000 to 2017. VAD was the eighth leading cause of the age-standardised prevalence rate and ninth leading cause of age-standardised YLD rate among fifteen causes of vision loss in 2017.
Conclusion: VAD has become one of the significant leading causes of vision loss globally. Efforts to control vision impairment related to VAD are needed, especially for children in countries with lower socio-economic status.
Keywords: Global burden of disease; Prevalence; Vision loss; Vitamin A deficiency; Years lived with disability.
Figures

 , Female;
  , Total;
  , Male. (c) age-specific prevalence rate by vision loss severity categories (MVL, SVL and blindness) in 2017; (d) age-specific YLD rate by vision loss severity categories in 2017.
  , Total Male;
  , Total Female;
  , MVL-Male;
  , MVL-Female;
  , SVL-Male;
  , SVL-Female;
  , Blindness-Male;
  , Blindness-Female. VAD = vitamin A deficiency; YLD = years lived with disability; MVL = moderate vision loss; SVL = severe vision loss. The post neonatal period is 28–364 d
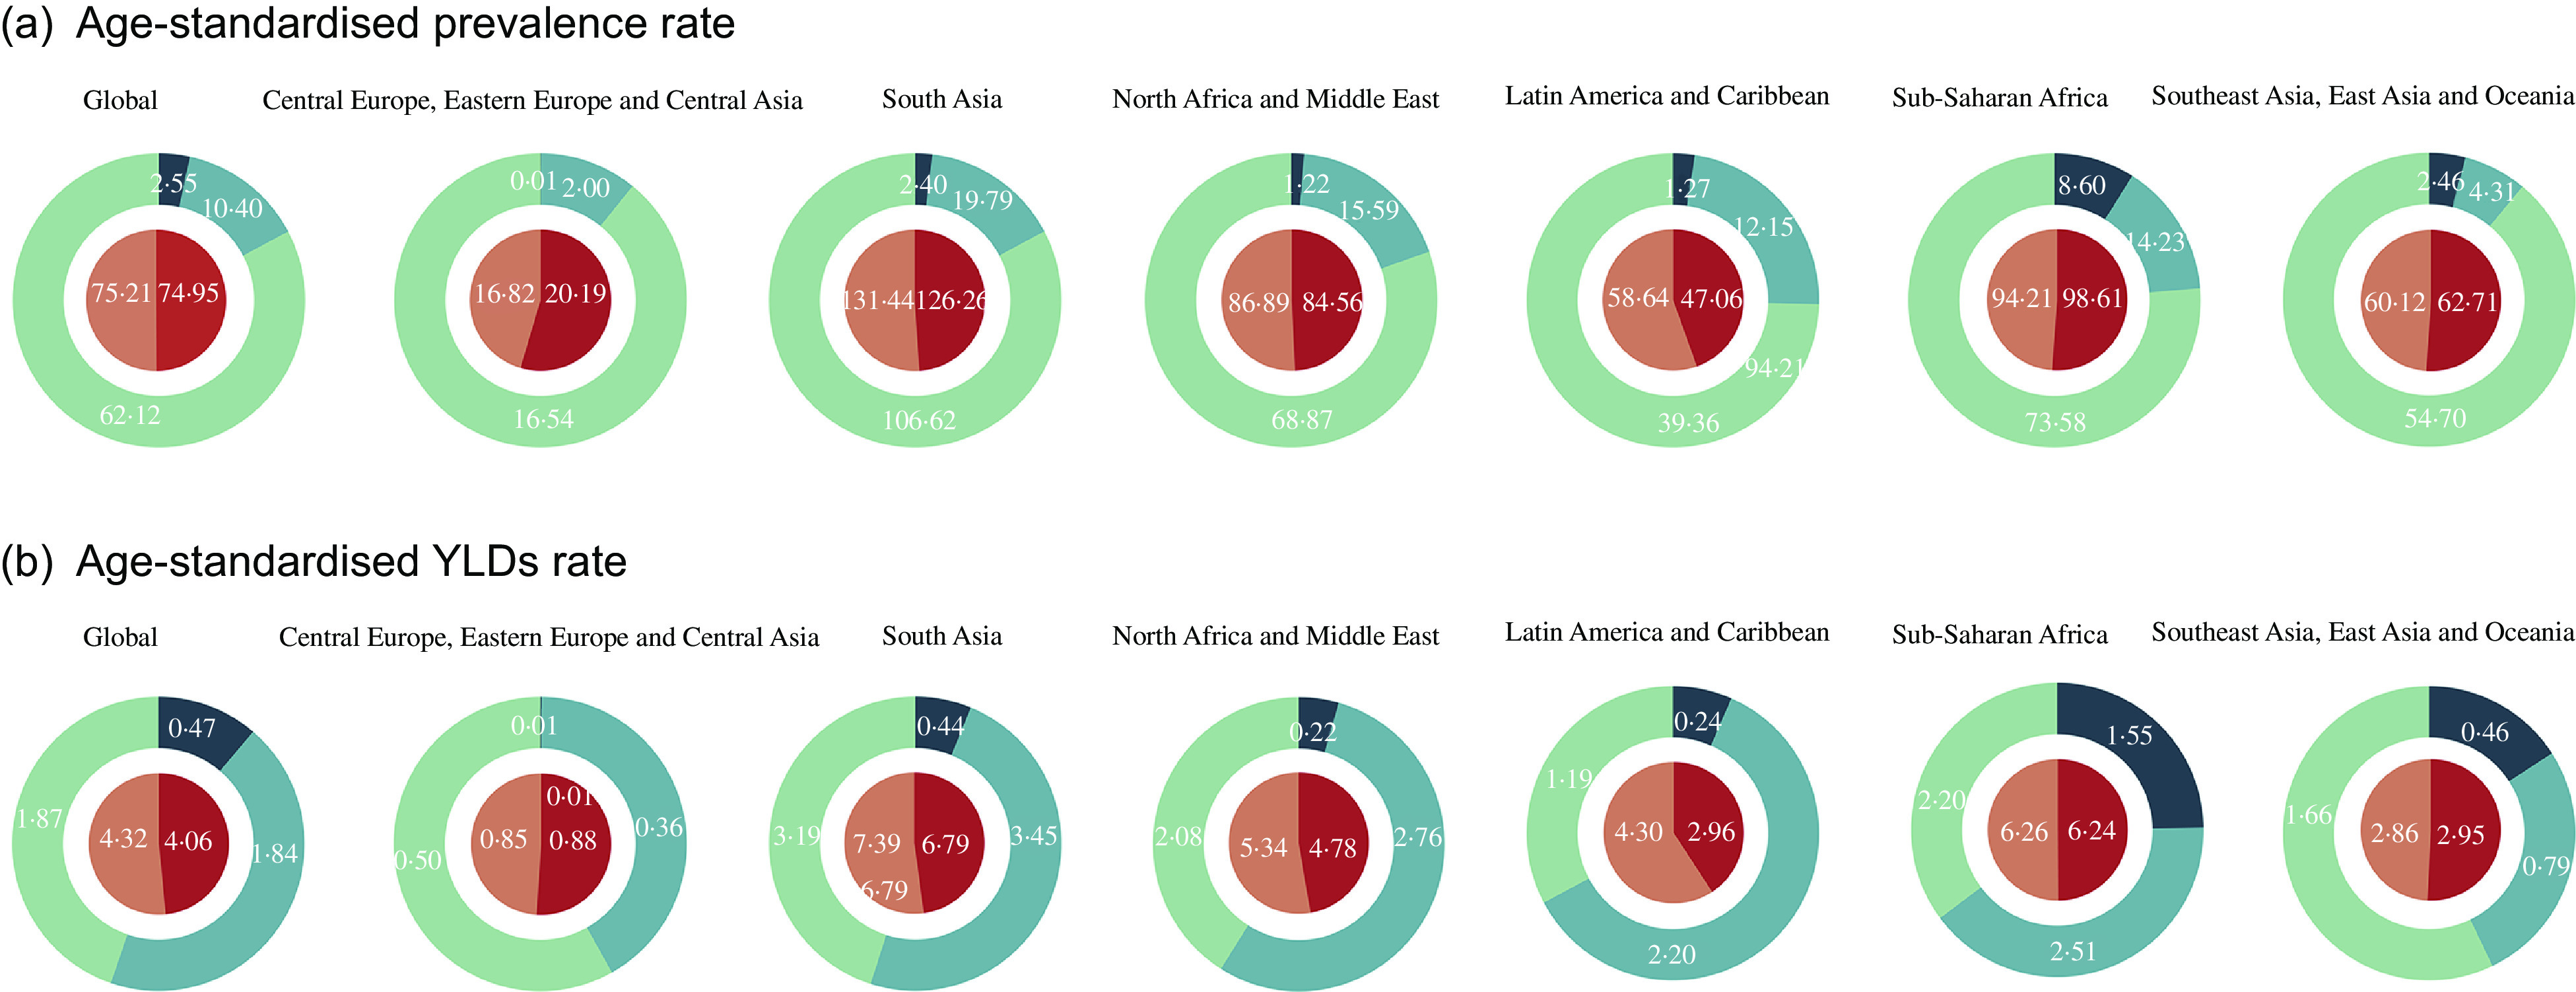
 , Male;
  , Female;
  , Blindness;
  , SVL;
  , MVL
, MVL
 , Global;
  , Southeast Asia, East Asia, and Oceania;
  , Sub-Saharan Africa;
  , North Africa and Middle East;
  , South Asia;
  , Latin America and Caribbean;
  , Central Europe, Eastern Europe and Central Asia
 , 240-280;
  , 200-240;
  , 160-200;
  , 120-160;
  , 80-120;
  , 40-80;
  , 0-40;
  , No data; (b) age-standardised YLD rate maps. , 14-17; , 10-14; , 8-10; , 6-8; , 4-6; , 2-4; , 0-2; , No data; (c) association between age-standardised YLD rate and HDI in 2017; (d) concentration index; (e) Gini coefficient. VAD = vitamin A deficiency; YLD = years lived with disability; HDI = human development index. *P < 0·05, **P < 0·01, ***P < 0·001
 , eye diseases;
  , ascending order in rank;
  , non-ocular diseases;
  , descending order in rank
Similar articles
-
Socio-economic inequality in the nutritional deficiencies among the world countries: evidence from global burden of disease study 2019.J Health Popul Nutr. 2025 Jan 13;44(1):8. doi: 10.1186/s41043-025-00739-z. J Health Popul Nutr. 2025. PMID: 39806471 Free PMC article.
-
Socioeconomic disparity in global vision loss burden due to diabetic retinopathy: an analysis on time trends from 1990 to 2017.Endocrine. 2021 Aug;73(2):316-324. doi: 10.1007/s12020-021-02692-3. Epub 2021 Jun 8. Endocrine. 2021. PMID: 34101111
-
Association of sex with the global burden of vision impairment caused by neonatal preterm birth: An analysis from the global burden of disease study 2019.Front Public Health. 2022 Jul 27;10:938228. doi: 10.3389/fpubh.2022.938228. eCollection 2022. Front Public Health. 2022. PMID: 35968463 Free PMC article.
-
Global, regional, and national burden of 12 mental disorders in 204 countries and territories, 1990-2019: a systematic analysis for the Global Burden of Disease Study 2019.Lancet Psychiatry. 2022 Feb;9(2):137-150. doi: 10.1016/S2215-0366(21)00395-3. Epub 2022 Jan 10. Lancet Psychiatry. 2022. PMID: 35026139 Free PMC article.
-
The global, regional, and national burden of colorectal cancer and its attributable risk factors in 195 countries and territories, 1990-2017: a systematic analysis for the Global Burden of Disease Study 2017.Lancet Gastroenterol Hepatol. 2019 Dec;4(12):913-933. doi: 10.1016/S2468-1253(19)30345-0. Epub 2019 Oct 21. Lancet Gastroenterol Hepatol. 2019. PMID: 31648977 Free PMC article.
Cited by
-
Vitamin A deficiency in the MENA region: a 30-year analysis (1990-2019).Front Nutr. 2024 Jun 6;11:1413617. doi: 10.3389/fnut.2024.1413617. eCollection 2024. Front Nutr. 2024. PMID: 38903625 Free PMC article.
-
Multifaceted determinants of micronutrient status in early childhood in Iran : National food and nutrition surveillance.Eur J Nutr. 2024 Dec 12;64(1):43. doi: 10.1007/s00394-024-03545-1. Eur J Nutr. 2024. PMID: 39666056
-
Coverage and associated factors of vitamin-A supplementation among children aged 6-59 months in Gondar City, Northwest Ethiopia, 2022: a community-based cross-sectional study.Pan Afr Med J. 2024 Oct 18;49:43. doi: 10.11604/pamj.2024.49.43.44537. eCollection 2024. Pan Afr Med J. 2024. PMID: 39867543 Free PMC article.
-
Vitamin A supplementation among 9-59 month old children in India: geospatial perspectives and implications for targeted coverage.BMJ Glob Health. 2022 Jul;7(7):e007972. doi: 10.1136/bmjgh-2021-007972. BMJ Glob Health. 2022. PMID: 35902202 Free PMC article.
-
Association of blood vitamin A with osteoarthritis: a nationally representative cross-sectional study.Front Nutr. 2024 Nov 5;11:1459332. doi: 10.3389/fnut.2024.1459332. eCollection 2024. Front Nutr. 2024. PMID: 39564209 Free PMC article.
References
-
- Schultink W (2002) Use of under-five mortality rate as an indicator for vitamin A deficiency in a population. J Nutr 132, 2881s–2883s. - PubMed
-
- Stevens GA, Bennett JE, Hennocq Q et al. (2015) Trends and mortality effects of vitamin A deficiency in children in 138 low-income and middle-income countries between 1991 and 2013: a pooled analysis of population-based surveys. Lancet Global health 3, e528–536. - PubMed
-
- World Health Organization (2020) Micronutrients. https://www.who.int/nutrition/topics/vad/en/ (accessed July 2020).
Publication types
MeSH terms
LinkOut - more resources
Full Text Sources
Other Literature Sources
Miscellaneous
