

Policy Interventions, Social Distancing, and SARS-CoV-2 Transmission in the United States: A Retrospective State-level Analysis
- PMID: 33775425
- PMCID: PMC7833753
- DOI: 10.1016/j.amjms.2021.01.007
Policy Interventions, Social Distancing, and SARS-CoV-2 Transmission in the United States: A Retrospective State-level Analysis
Abstract
Background: Various non-pharmaceutical interventions (NPIs) such as stay-at-home orders and school closures have been employed to limit the spread of Coronavirus disease (COVID-19). This study measures the impact of social distancing policies on COVID-19 transmission in US states during the early outbreak phase to assess which policies were most effective.
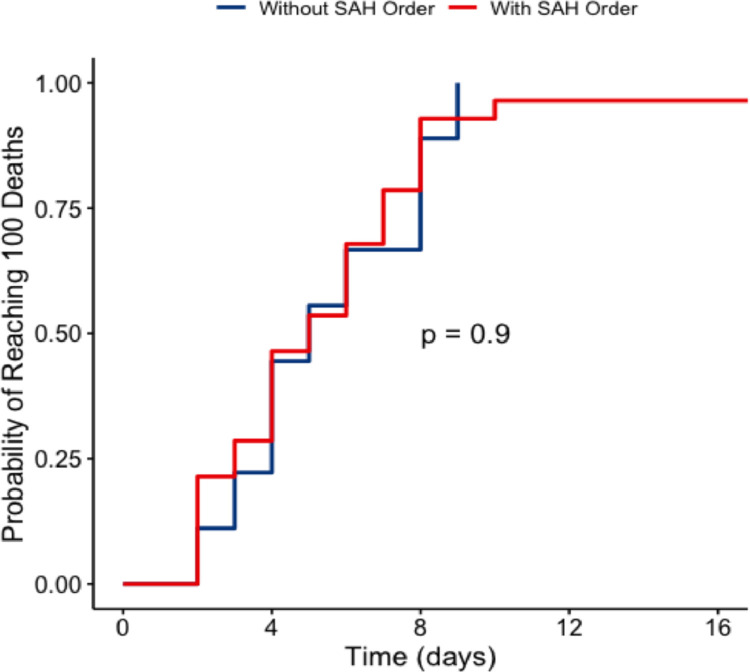
Methods: To measure transmissibility, we analyze the average effective reproductive number (Rt) in each state the week following its 500th case and doubling time from 500 to 1000 cases. Linear and logistic regressions were performed to assess the impact of various NPIs while controlling for population density, GDP, and certain health metrics. This analysis was repeated for deaths with doubling time to 100 deaths with several healthcare infrastructure control variables.
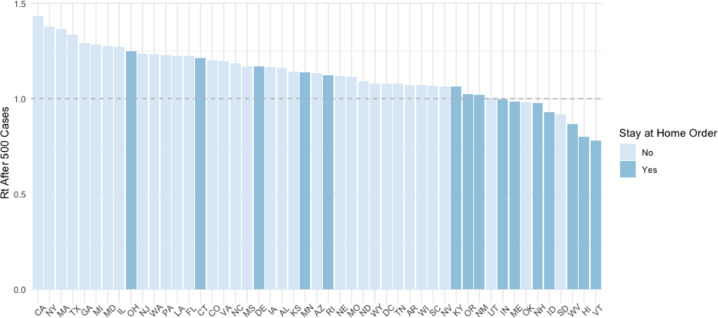
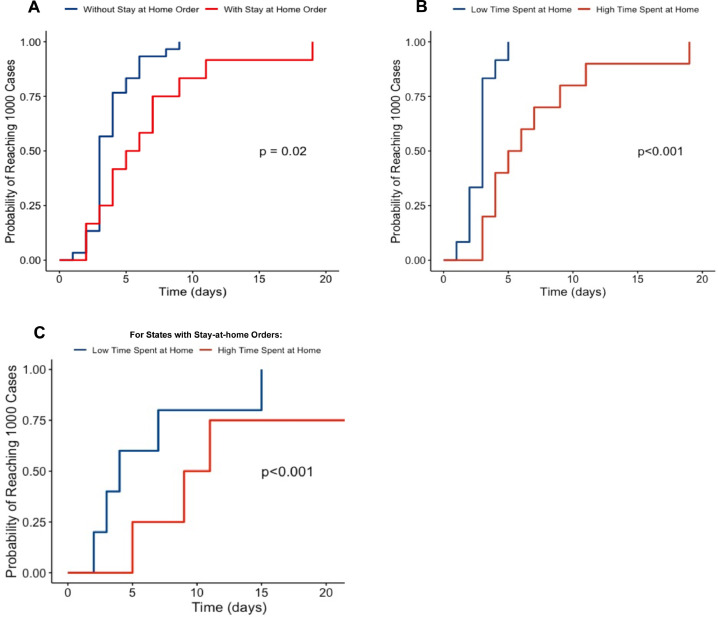
Results: States with stay-at-home orders in place at the time of their 500th case were associated with lower average Rt the following week compared to states without them (p<0.001) and significantly less likely to have an Rt>1 (OR 0.07, 95% CI 0.01-0.37, p = 0.004). These states also experienced longer doubling time from 500 to 1000 cases (HR 0.35, 95% CI 0.17-0.72, p = 0.004). States in the highest quartile of average time spent at home were also slower to reach 1000 cases than those in the lowest quartile (HR 0.18, 95% CI 0.06-0.53, p = 0.002).
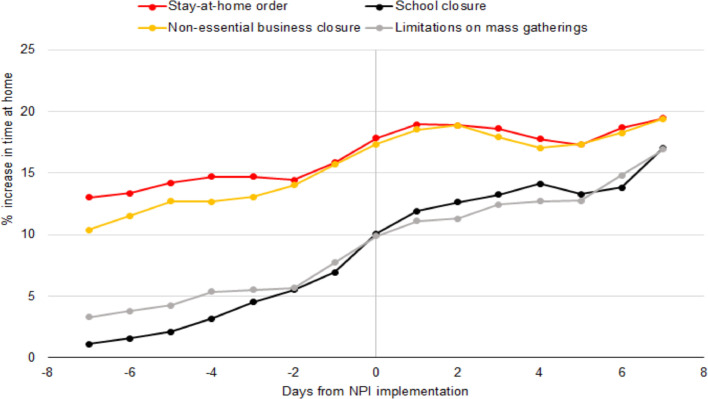
Conclusions: Stay-at-home orders had the largest effect of any policy analyzed. Multivariate analyses with cellphone tracking data suggest social distancing adherence drives these effects. States that plan to scale back such measures should carefully monitor transmission metrics.
Keywords: COVID-19; Coronavirus; Limitations on mass gatherings; Non-essential business closure; Non-pharmaceutical interventions; Novel coronavirus; Public policy; SARS-CoV-2; School closure; Social distancing; Stay-at-home order.
Copyright © 2021 Southern Society for Clinical Investigation. Published by Elsevier Inc. All rights reserved.
Conflict of interest statement
Declaration of Competing Interest The authors of this manuscript have no conflicts of interest to disclose.
Figures
Similar articles
-
The temporal association of introducing and lifting non-pharmaceutical interventions with the time-varying reproduction number (R) of SARS-CoV-2: a modelling study across 131 countries.Lancet Infect Dis. 2021 Feb;21(2):193-202. doi: 10.1016/S1473-3099(20)30785-4. Epub 2020 Oct 22. Lancet Infect Dis. 2021. PMID: 33729915 Free PMC article.
-
The impact of non-pharmaceutical interventions on SARS-CoV-2 transmission across 130 countries and territories.BMC Med. 2021 Feb 5;19(1):40. doi: 10.1186/s12916-020-01872-8. BMC Med. 2021. PMID: 33541353 Free PMC article.
-
Social distancing policies in 22 African countries during the COVID-19 pandemic: a desk review.Pan Afr Med J. 2020 Dec 14;37(Suppl 1):46. doi: 10.11604/pamj.supp.2020.37.46.27026. eCollection 2020. Pan Afr Med J. 2020. PMID: 33552374 Free PMC article. Review.
-
Chance elections, social distancing restrictions, and KENTUCKY's early COVID-19 experience.PLoS One. 2021 Jul 1;16(7):e0250152. doi: 10.1371/journal.pone.0250152. eCollection 2021. PLoS One. 2021. PMID: 34197461 Free PMC article.
-
[What is the effect of social distancing on the course of COVID-19 epidemic?].Pol Merkur Lekarski. 2021 Feb 24;49(289):71-79. Pol Merkur Lekarski. 2021. PMID: 33713099 Review. Polish.
Cited by
-
Epidemic outcomes following government responses to COVID-19: Insights from nearly 100,000 models.Sci Adv. 2024 Jun 7;10(23):eadn0671. doi: 10.1126/sciadv.adn0671. Epub 2024 Jun 5. Sci Adv. 2024. PMID: 38838157 Free PMC article.
-
Systematic review of empiric studies on lockdowns, workplace closures, and other non-pharmaceutical interventions in non-healthcare workplaces during the initial year of the COVID-19 pandemic: benefits and selected unintended consequences.BMC Public Health. 2024 Mar 22;24(1):884. doi: 10.1186/s12889-024-18377-1. BMC Public Health. 2024. PMID: 38519891 Free PMC article.
-
Effectiveness of non-pharmaceutical interventions for COVID-19 in USA.Sci Rep. 2024 Sep 13;14(1):21387. doi: 10.1038/s41598-024-71984-1. Sci Rep. 2024. PMID: 39271786 Free PMC article.
-
Effects of non-pharmaceutical interventions on COVID-19 transmission: rapid review of evidence from Italy, the United States, the United Kingdom, and China.Front Public Health. 2024 Oct 17;12:1426992. doi: 10.3389/fpubh.2024.1426992. eCollection 2024. Front Public Health. 2024. PMID: 39484353 Free PMC article.
-
Effectiveness of public health measures in reducing the incidence of covid-19, SARS-CoV-2 transmission, and covid-19 mortality: systematic review and meta-analysis.BMJ. 2021 Nov 17;375:e068302. doi: 10.1136/bmj-2021-068302. BMJ. 2021. PMID: 34789505 Free PMC article.
References
-
- Banholzer N., van Weenen E., Kratzwald B. Estimating the impact of non-pharmaceutical interventions on documented infections with COVID-19: a cross-country analysis. medRxiv. 2020
-
- 2020. Institute For Health Metrics and Evaluation. COVID-19 Resources. April 30 [cited 2020 April 30]; Available at: http://www.healthdata.org/covid. Accessed March 22, 2021.
-
- Johns Hopkins Univeristy & Medicine . 2020. COVID-19 Dashboard by the Center for Systems Science and Engineering (CSSE) At Johns Hopkins University (JHU) April 30 [cited 2020 April 30]; Available at: https://coronavirus.jhu.edu/map.html. Accessed March 22, 2021.
MeSH terms
LinkOut - more resources
Full Text Sources
Other Literature Sources
Medical
Miscellaneous
