

Evaluating the impact of coronavirus disease 2019 on asthma morbidity: A comprehensive analysis of potential influencing factors
- PMID: 33775900
- PMCID: PMC9338685
- DOI: 10.1016/j.anai.2021.03.018
Evaluating the impact of coronavirus disease 2019 on asthma morbidity: A comprehensive analysis of potential influencing factors
Abstract
Background: The coronavirus disease 2019 (COVID-19) pandemic period is experiencing better asthma control, fewer exacerbations, and health care utilization, with limited data on factors that could explain this phenomenon.
Objective: To confirm these improved asthma outcomes during COVID-19 and evaluate potential contributing factors.
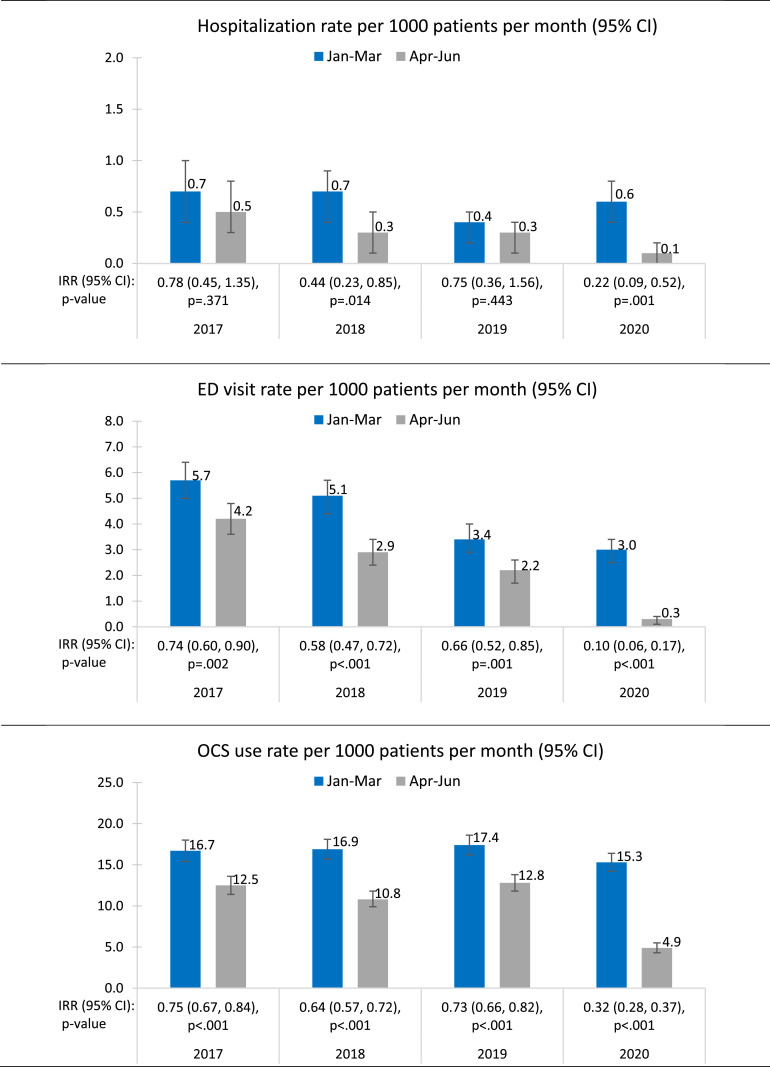
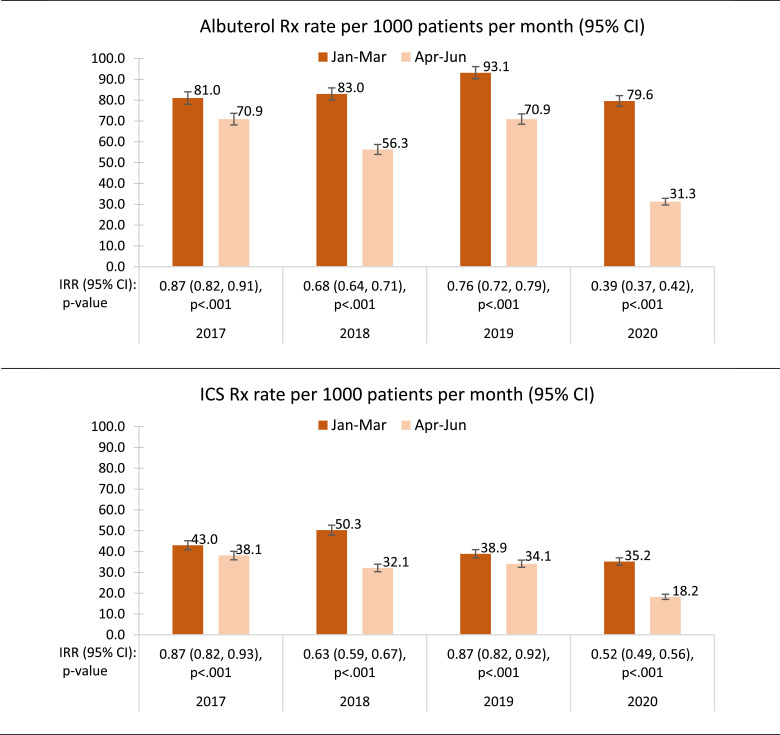
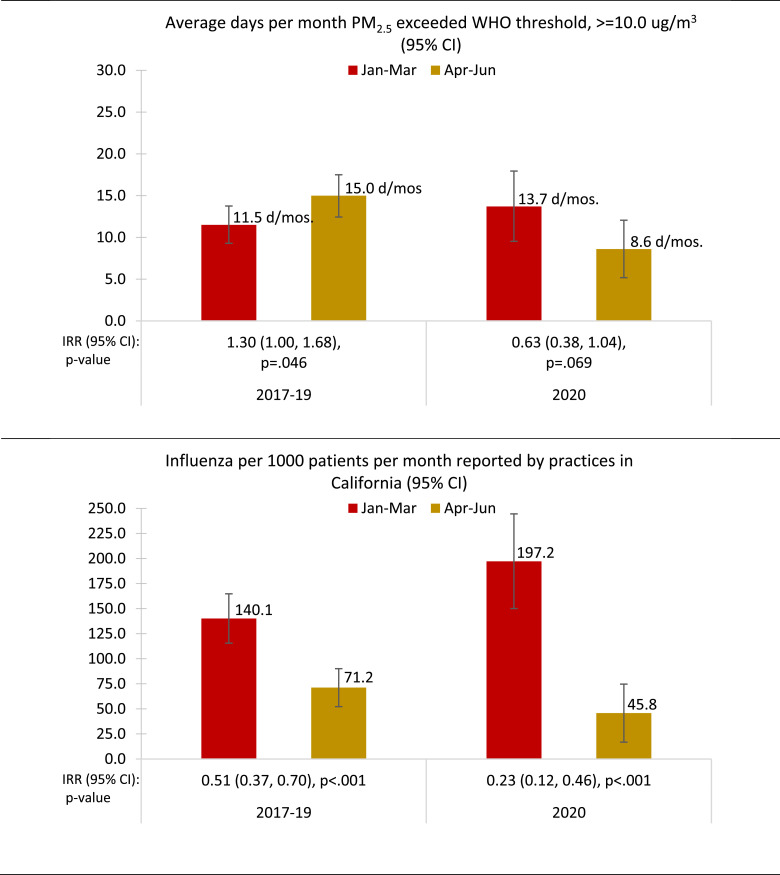
Methods: In 18,912 pediatric patients with asthma treated in the Children's Hospital of Orange County network from 2017 to 2020, monthly asthma-related encounters and medication summaries were extracted from electronic health records, particulate matter 2.5 (PM2.5) air pollution from the California Air Resources Board, and influenza-like illness from Illness Surveillance Network for the first 6 months of each year. Changes in outcomes between January to March and April to June (post-COVID-19 shutdown in 2020) were compared with historical data using generalized estimating equations analyses for patient outcomes and generalized linear models for pollution exceedance, influenza-positive, and telehealth visit rates.
Results: During COVID-19, we found 78%, 90%, 68% reductions in hospitalization, emergency department visits, and exacerbations, respectively, compared with pre-COVID-19 2020, with significantly greater changes than the same time period of 2017 to 2019 and significant reductions in albuterol and inhaled corticosteroid use (P < .05). Emergency department visit reduction was not seen for African Americans. The PM2.5 and influenza rates were also significantly reduced during COVID-19 (P < .05). Increased rates in telehealth visits were greater in the publicly insured group when compared with commercially insured.
Conclusion: Our data confirm reduced health care utilization and suggest better asthma control during COVID-19, except for African Americans. This was associated with a significant increase in telehealth visits and reductions in PM2.5 and influenza infections, but not better asthma controller adherence.
Copyright © 2021 American College of Allergy, Asthma & Immunology. Published by Elsevier Inc. All rights reserved.
Figures
Similar articles
-
Pediatric Asthma Health Care Utilization, Viral Testing, and Air Pollution Changes During the COVID-19 Pandemic.J Allergy Clin Immunol Pract. 2020 Nov-Dec;8(10):3378-3387.e11. doi: 10.1016/j.jaip.2020.07.057. Epub 2020 Aug 20. J Allergy Clin Immunol Pract. 2020. PMID: 32827728 Free PMC article.
-
Unexpected decline in pediatric asthma morbidity during the coronavirus pandemic.Pediatr Pulmonol. 2021 Jul;56(7):1951-1956. doi: 10.1002/ppul.25406. Epub 2021 Apr 13. Pediatr Pulmonol. 2021. PMID: 33848402 Free PMC article.
-
Impact of the COVID-19 Pandemic on Health Care Utilization in a Large Integrated Health Care System: Retrospective Cohort Study.J Med Internet Res. 2021 Apr 29;23(4):e26558. doi: 10.2196/26558. J Med Internet Res. 2021. PMID: 33882020 Free PMC article.
-
Effects of asthma education on children's use of acute care services: a meta-analysis.Pediatrics. 2008 Mar;121(3):575-86. doi: 10.1542/peds.2007-0113. Pediatrics. 2008. PMID: 18310208 Free PMC article. Review.
-
Is asthma a risk factor for coronavirus disease-2019 worse outcomes? The answer is no, but ….Curr Opin Allergy Clin Immunol. 2021 Jun 1;21(3):223-228. doi: 10.1097/ACI.0000000000000734. Curr Opin Allergy Clin Immunol. 2021. PMID: 33534417 Review.
Cited by
-
The effects of COVID-19 outbreak on pediatric emergency department admissions for acute wheezing.Pediatr Pulmonol. 2022 May;57(5):1167-1172. doi: 10.1002/ppul.25858. Epub 2022 Feb 22. Pediatr Pulmonol. 2022. PMID: 35170263 Free PMC article.
-
Journal Club: The Intersection of Racial/Ethnic Disparities in Coronavirus Disease 2019 and COPD.Chronic Obstr Pulm Dis. 2021 Apr 27;8(2):292-302. doi: 10.15326/jcopdf.2021.0227. Chronic Obstr Pulm Dis. 2021. PMID: 33909967 Free PMC article. No abstract available.
-
Changes in Tobacco Use Patterns among Veterans in San Diego during the Recent Peak of the COVID-19 Pandemic.Int J Environ Res Public Health. 2021 Nov 13;18(22):11923. doi: 10.3390/ijerph182211923. Int J Environ Res Public Health. 2021. PMID: 34831686 Free PMC article.
-
Management of patients with allergic diseases in the era of COVID-19.Clin Exp Pediatr. 2022 Nov;65(11):529-535. doi: 10.3345/cep.2022.00759. Epub 2022 Sep 23. Clin Exp Pediatr. 2022. PMID: 36229025 Free PMC article.
-
Impact of the COVID-19 Pandemic on Incidence of Asthma Exacerbations and Hospitalizations in US Subspecialist-Treated Patients with Severe Asthma: Results from the CHRONICLE Study.J Asthma Allergy. 2022 Aug 31;15:1195-1203. doi: 10.2147/JAA.S363217. eCollection 2022. J Asthma Allergy. 2022. PMID: 36068863 Free PMC article.
References
-
- Centers for Disease Control and Prevention. Corona data tracker. Available at: https://covid.cdc.gov/covid-data-tracker. Accessed February 26, 2021.
-
- National Health Interview Survey, Centers for Disease Control and Prevention. National current asthma prevalence 2014. Available at: http://www.cdc.gov.asthma/asthmadata.htm. Accessed December 30, 2020.
-
- Minor TE, Dick EC, DeMeo AN, Ouellette JJ, Cohen M, Reed CE. Viruses as precipitants of asthmatic attacks in children. JAMA. 1974;227(3):292–298. - PubMed
MeSH terms
Substances
LinkOut - more resources
Full Text Sources
Other Literature Sources
Medical
Miscellaneous
