. 2022 May 1;29(5):692-718.
doi: 10.5551/jat.62216. Epub 2021 Mar 27.

Group V Secretory Phospholipase A2 Regulates Endocytosis of Acetylated LDL by Transcriptional Activation of PGK1 in RAW264.7 Macrophage Cell Line

Affiliations

Group V Secretory Phospholipase A2 Regulates Endocytosis of Acetylated LDL by Transcriptional Activation of PGK1 in RAW264.7 Macrophage Cell Line

Daisuke Fujioka et al. J Atheroscler Thromb. .

Abstract

Aims: It was suggested that group V secretory phospholipase A2 (sPLA2-V) existed in the nucleus. This study examined whether nuclear sPLA2-V plays a role in endocytosis of acetylated low-density lipoprotein (AcLDL) in monocyte/macrophage-like cell line RAW264.7 cells.

Methods: RAW264.7 cells were transfected with shRNA vector targeting sPLA2-V (sPLA2-V-knockdown [KD] cells) or empty vector (sPLA2-V-wild-type [WT] cells). AcLDL endocytosis was assessed by incubation with 125I-AcLDL or AcLDL conjugated with pHrodo. Actin polymerization was assessed by flow cytometry using Alexa Fluor 546-phalloidin.

Results: In immunofluorescence microscopic studies, sPLA2-V was detected in the nucleus. ChIP-Seq and ChIP-qPCR analyses showed binding of sPLA2-V to the promoter region of the phosphoglycerate kinase 1 (Pgk1) gene. In the promoter assay, sPLA2-V-KD cells had lower promoter activity of the Pgk1 gene than sPLA2-V-WT cells, and this decrease could be reversed by transfection with a vector encoding sPLA2-V-H48Q that lacks enzymatic activity. Compared with sPLA2-V-WT cells, sPLA2-V-KD cells had decreased PGK1 protein expression, beclin 1 (Beclin1) phosphorylation at S30, and class III PI3-kinase activity that could also be restored by transfection with sPLA2-V-H48Q. sPLA2-V-KD cells had impaired actin polymerization and endocytosis, which was reversed by introduction of sPLA2-V-H48Q or PGK1 overexpression. In sPLA2-V-WT cells, siRNA-mediated depletion of PGK1 suppressed Beclin1 phosphorylation and impaired actin polymerization and intracellular trafficking of pHrodo-conjugated AcLDL.

Conclusions: Nuclear sPLA2-V binds to the Pgk1 gene promoter region and increases its transcriptional activity. sPLA2-V regulates AcLDL endocytosis through PGK1-Beclin1 in a manner that is independent of its enzymatic activity in RAW264.7 cells.

Keywords: Actin polymerization; Endocytosis; Group V secretory phospholipase A2; Macrophage; Phosphoglycerate kinase 1.


Figures
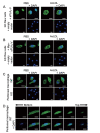
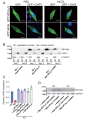
Fig.1. Immunofluorescence microscopic studies using anti-sPLA<sub>2</sub>-V antibody or anti-Myc-tag antibody for nuclear localization of sPLA<sub>2</sub>-V
Fig.1. Immunofluorescence microscopic studies using anti-sPLA2-V antibody or anti-Myc-tag antibody for nuclear localization of sPLA2-V
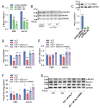
Scale bars were 10 µm. Nuclei were visualized with 4´,6-diamidino-2-phenylindole (DAPI) (blue). A and B, Immunoreactivity (green) of sPLA2-V and Myc-sPLA2-V was detected in the nucleus as well as in the cytoplasmic area in sPLA2-V KD RAW264.7 cells with re-constitutive expression of sPLA2-V or Myc-sPLA2-V, respectively, 10 min after addition of 20 µg/mL of AcLDL or PBS as a vehicle. Their immunoreactivities in the nucleus appeared to be lower than those in the cytoplasmic area. The immunoreactivity was not detected in sPLA2-V KD RAW264.7 cells transfected with empty vector (lower panels). C, Immunoreactivity of endogenous sPLA2-V was detected in the nucleus as well as in the cytoplasmic area of primary peritoneal macrophages from sPLA2-V wild-type (WT) mice but not from sPLA2-V knockout (KO) mice. D, In peritoneal macrophages from sPLA2-V WT mice, confocal microscopic images of the cells were taken consecutively at 1 µm intervals from the bottom edge to the top edge of the nucleus. Immunoreactivity of endogenous sPLA2-V was detected within nucleus as well as in the cytoplasmic area.
Fig.2. Nuclear localization of GFP-tagged sPLA<sub>2</sub>-V and Myc-sPLA<sub>2</sub>-V and efficacy of knockdown of sPLA<sub>2</sub>-V by shRNA and transfection of various types of sPLA<sub>2</sub>-V in sPLA<sub>2</sub>-V KD RAW264.7 cells
Fig.2. Nuclear localization of GFP-tagged sPLA2-V and Myc-sPLA2-V and efficacy of knockdown of sPLA2-V by shRNA and transfection of various types of sPLA2-V in sPLA2-V KD RAW264.7 cells
A, sPLA2-V KD RAW264.7 cells were transfected with plasmid vectors encoding GFP alone or GFP-tagged sPLA2-V. GFP-tagged sPLA2-V was detected in the nucleus as well as in the cytoplasmic area. Scale bars were 10 µm. B, Immunoblotting analysis of nuclear (NE) and cytoplasmic (CE) fractions from sPLA2-V KD cells transfected with empty vector and sPLA2-V KD cells expressing Myc-tagged sPLA2-V and Myc-tagged sPLA2-V H48Q using anti-Myc-tag antibody, anti-Lamin antibody (nucleus marker), and anti-β tubulin (cytoplasmic marker). Duplicate experiments were performed (exp. 1, exp. 2) in cells at baseline. C, RT-PCR shows successful knockdown of sPLA2-V after transfection with shRNA for sPLA2-V and re-constitutive expression of sPLA2-V, sPLA2-V-H48Q, Myc-tagged sPLA2-V, Myc-tagged sPLA2-V-H48Q, or GFP- sPLA2-V in sPLA2-V KD RAW264.7 cells. D, Evaluation of efficacy of shRNA targeting sPLA2-V. Immunoblotting study using anti-Myc-tag antibody showed that shRNA targeting sPLA2-V effectively abolished expression of the transfected Myc-tagged non-mutant original sPLA2-V in sPLA2-V KD RAW264.7 cells.
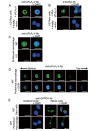
Supplementary Fig.1. Immunofluorescence Microscopic Study of the Isolated Nuclei
Nuclei were visualized with 4´,6-diamidino-2-phenylindole (DAPI) (blue). Scale bars were 10 µm. Images of the nucleus (A, B, C, and E) were taken consecutively with 1 µm intervals from the bottom edge to the top edge of the nucleus. Among them, the single image that represents the most center of the nucleus was shown. A and B, Immunoreactivity (green) of sPLA2-V and Myc-sPLA2-V was detected in the nuclei isolated from sPLA2-V KD RAW264.7 cells with re-constitutive expression of sPLA2-V and Myc-sPLA2-V, respectively. No immunoreactivity was detected in the nuclei isolated from sPLA2-V KD RAW264.7 cells transfected with empty vector (lower panels). C, Immunoreactivity of endogenous sPLA2-V was detected in the nuclei isolated from primary peritoneal macrophages of sPLA2-V wild-type (WT) mice but not from sPLA2-V knockout (KO) mice. D, In the nuclei isolated from peritoneal macrophages of sPLA2-V WT mice, confocal microscopic images were taken consecutively at 1 µm intervals from the bottom edge to the top edge of the nucleus. E, The immunoreactivity (green) of GAPDH (cytoplasmic marker) was not detected in the isolated nuclei, suggesting little contamination by cytosolic proteins during procedure of nucleus isolation.
Fig.3. ChIP-seq and ChIP-qPCR analysis and promoter assay in RAW264.7 cells
A, Representative profile of peaks obtained for the Pgk1 gene by ChIP-Seq. ChIP-seq was performed using sPLA2-V KD cells transfected with empty vector, sPLA2-V KD cells expressing Myc-tagged sPLA2-V, and sPLA2-V KD cells expressing Myc-tagged sPLA2-V-H48Q using an anti-Myc-tag mouse monoclonal antibody. Input of sPLA2-V KD cells expressing Myc-tagged sPLA2-V was used as a ChIP-seq control. ChIP-seq analysis showed a Myc-tagged sPLA2-V-binding peak at the upstream region of Pgk1 gene locus. B, ChIP-qPCR validation of Myc-tagged sPLA2-V binding to the Pgk1 gene. Data are shown as a percentage expression of input control. The amplification sites (binding site and unrelated site) for PCR are indicated in panel A (ChIP-seq). Each bar represents the mean±SEM of 2–3 independent experiments. C, Promoter assay for Pgk1 gene transcriptional activity. sPLA2-V WT cells, sPLA2-V KD cells, and sPLA2-V KD cells with re-constitutive expression of sPLA2-V or sPLA2-V-H48Q were transfected with Cypridina and Renilla luciferase expression vectors. The promoter activity is expressed as the relative luciferase activity normalized to Renilla activity. Values in each bar were normalized to that of WT (=1). Each bar represents the mean±SEM of 6–9 independent experiments. **, P<0.01 vs. WT. ††, P<0.01 vs KD. Upper panel shows a schematic illustration of the promoter construct used in this Cypridina luciferase reporter assay.
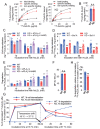
Fig.4. Impairment of AcLDL internalization and degradation in sPLA<sub>2</sub>-V KD RAW264.7 cells
Fig.4. Impairment of AcLDL internalization and degradation in sPLA2-V KD RAW264.7 cells
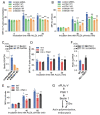
Each bar represents the mean±SEM of 5–8 independent experiments. Details of the methods are described in the text. A, Dose-response binding of 125I-labeled AcLDL to the cell surface of sPLA2-V WT cells (left panel) and sPLA2-V KD cells (right panel) after incubation for 2 hr. B, sPLA2-V WT and -KD cells show similar degrees of cell surface-specific binding of 125I-labeled AcLDL after incubation with 20 µg 125I-labeled AcLDL for 2 hr. n.s. indicates statistically not significant. C, Comparison of specific internalization of 125I AcLDL in sPLA2-V WT cells, sPLA2-V KD cells, and sPLA2-V KD cells with re-constitutive expression of sPLA2-V WT or sPLA2-V-H48Q that lacks enzymatic activity. , P<0.05, **, P<0.01 vs. WT. , P<0.05, ††, P<0.01 vs KD. D, Effect of the lysosomal inhibitor bafilomycin A1 (Baf A) on specific internalization of 125I AcLDL. Cells were similarly incubated with 125I AcLDL for 2 hr at 4℃, washed, and then further incubated for the indicated time at 37℃ in the presence or absence of 1 µM Baf A. The specific internalization was compared. **, P<0.01 vs. WT. , P<0.05, ††, P<0.01 vs WT+Baf A. E, Comparison of the specific degradation of AcLDL at the indicated time after incubation with AcLDL. **, P<0.01 vs. WT. , P<0.05, ††, P<0.01 vs KD. F, Comparison of magnitude of cell surface expression of SR-A1 between sPLA2-V WT and KD cells. MFI indicates mean fluorescence intensity. G, Pulse chase experiment in RAW264.7 cells. Intracellular processing of internalized 125I AcLDL for lysosomal degradation. Cells were incubated for the indicated time up to 1 hr with 125I-AcLDL at 18℃. The cells were then washed and a portion of the cells was taken to measure specific internalization of AcLDL. The remaining cells were further incubated for the indicated time up to 1 hr at 37℃, and TCA-soluble radioactivity was measured at each time point. The amount of the internalized and degraded AcLDL (per cell protein) at each time point was normalized to that of internalized AcLDL after incubation for 1 hr at 18℃ (=100%). The mean amount of internalized AcLDL after the incubation for 1 hr at 18℃ was 481 ng/mg protein and 378 ng/mg protein for sPLA2-V WT cells and sPLA2-V KD cells, respectively. The data are representative of three experiments. H, Comparison of degradation relative to internalized 125I-AcLDL after 1 hr incubation at 18℃ on the pulse chase experiment (panel G) between sPLA2-V WT cells and sPLA2-V KD cells. sPLA2-V KD cells had lower rate (percentage) of degraded AcLDL after 1 hr incubation at 37℃ relative to the amount of the specific internalized AcLDL after 1 hr incubation at 18℃. The rate reflects translocation of internalized AcLDL to the lysosome compartment. n=5 in each experiment. **, P<0.01 vs. WT.
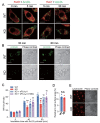
Fig.5. Maturation of endosomes containing AcLDL and fusion of endosomes and lysosomes in RAW264.7 cells
A, Immunofluorescence images showing colocalization of Alexa FluorTM 488 AcLDL (green) with Rab5 and Rab7 (red) after incubation with AcLDL for the indicated times in sPLA2-V WT and KD cells. Scale bars were 10 µm. The data are representative of three experiments. B, Fluorescence images of AcLDL conjugated with pHrodo (green) to visualize acidic cell compartments after incubation for the indicated times are also shown. Scale bars were 10 µm. Right panels are phase contrast images corresponding to the respective fluorescence images of AcLDL conjugated with pHrodo. The data are representative of three experiments. C, Comparison of the mean fluorescence intensity (MFI) of pHrodo at the indicated time after incubation with AcLDL conjugated with pHrodo for sPLA2-V WT cells, sPLA2-V KD cells, and sPLA2-V KD cells with re-constitutive expression with sPLA2-V or sPLA2-V-H48Q that lacks enzymatic activity. n=5 –7 in each experiment. **, P<0.01 vs. WT. , P<0.05, ††, P<0.01 vs. KD. D, Comparison of the area exhibiting LysoTracker Red fluorescence that represents acidic cell compartments between sPLA2-V WT and -KD cells. Cells were incubated with 50 nM LysoTracker Red for 30 min in RPMI medium. The area of red fluorescence in each cell was measured using ImageJ and expressed as the percentage of red fluorescence area relative to the cell surface area, and averaged over at least 20 cells. n=5 in each experiment. n.s. indicates statistically not significant. E, Panel shows representative confocal microscopic images. Scale bars are 10 µm.
Fig.6. Impairment of actin polymerization in sPLA<sub>2</sub>-V KD RAW264.7 cells
Fig.6. Impairment of actin polymerization in sPLA2-V KD RAW264.7 cells
A, Confocal microscopy of F-actin polymerization detected by Alexa Fluor 546-phalloidin (red) at baseline (0 min) and 5 min after incubation with Alexa Fluor 488-labelled AcLDL (green) in sPLA2-V WT and -KD cells. Cell protrusions probably due to actin polymerization are seen 5 min after incubation with AcLDL. Scale bars were 10 µm. B, Comparison of mean fluorescence intensity (MFI) of F-actin polymerization using flow cytometry after incubation with AcLDL for the indicated time for sPLA2-V WT, sPLA2-V KD, and sPLA2-V KD cells with re-constitutive expression of sPLA2-V or sPLA2-V-H48Q. n=5–7 in each experiment. **, P<0.01 vs. WT. ††, P<0.01 vs. KD.
Fig.7. PGK1 expression, Beclin1 S30 phosphorylation, and PI3-kinase activity in RAW264.7 cells
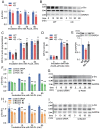
A, Suppression of Beclin1 phosphorylation at S30 (p-Beclin1/Beclin1) by siRNA (#1 and #2)-mediated reduction of PGK1 expression. Values were normalized to that of control siRNA after incubation with PBS as a vehicle (=1). n=5 in each experiment. **, P<0.01 vs. control siRNA. B, Representative immunoblots for panel A. C, Successful suppression of PGK1 expression by siRNA confirmed by immunoblotting. D, E, F, Comparison of PGK1 expression (D), Beclin1 phosphorylation at S30 (E), and PI3-kinase activity (F) after incubation for 2 hr with 20 µg/mL AcLDL or PBS as a vehicle in sPLA2-V-WT and KD cells, and sPLA2-V KD cells with re-constitutive expression of sPLA2-V or sPLA2-V-H48Q. G, Representative immunoblots showing PGK1 expression and Beclin1 phosphorylation in various types of RAW264.7 cells. Values in panels D and E were normalized to that of WT after incubation with PBS as a vehicle (=1). Each bar represents the mean±SEM of 5–6 independent experiments. , P<0.05, **, P<0.01 vs. WT, , P<0.05, ††, P<0.01 vs. KD.
Fig.8. Role of PGK1-Beclin1 in actin polymerization and translocation of AcLDL to lysosomes in RAW264.7 cells
A and B, siRNA-mediated reduction in PGK1 or Beclin1 expression (#1 and #2) inhibited actin polymerization (A) and translocation of internalized AcLDL conjugated with pHrodo (B). Actin polymerization was assessed by detection of F-actin polymerization with Alexa Fluor 546-phalloidin. Translocation of AcLDL to lysosomes was assessed using flow cytometry of pHrodo-conjugated AcLDL. Details of the methods are described in the text. Each bar represents the mean±SEM of 5 independent experiments. **, P<0.01 vs. control siRNA. C, Reduction of Beclin1 protein expression by siRNAs (#1 and #2). Values were normalized to that of control siRNA (=1). Upper panel shows representative immunoblots. D and E, Transfection of an expression vector to overexpress PGK1 reversed a decrease in actin polymerization (D) and translocation of internalized AcLDL conjugated with pHrodo (E). Details of methods are described in the text. Each bar represents the mean±SEM of 5 independent experiments. **, P<0.01 vs. WT, , P<0.05, ††, P<0.01 vs. KD. F, Successful overexpression of PGK1 protein by transfection of sPLA2-V KD RAW264.7 cells with a plasmid vector encoding Pgk1. Values were normalized to that of WT (=1). G, Schematic representation of a potential mechanism for sPLA2-V mediated endocytosis of AcLDL in RAW264.7 cells.
Fig.9. c-Src phosphorylation and its role in actin polymerization and translocation of internalized AcLDL to lysosomes in RAW264.7 cells
A, Ratio of c-Src phosphorylation at the active site (Y416) relative to total c-Src in response to AcLDL was reduced in sPLA2-V KD cells compared with that for sPLA2-V WT cells. Data are expressed as values relative to the value of sPLA2 -V WT cells at baseline (incubation time 0) (=1). n=5 in each experiment. , P<0.05, vs. WT. B, Representative immunoblots for panel A. C and D, Overexpression of c-Src after transfection with an expression vector encoding the c-Src gene reversed an impairment of actin polymerization (C) and transport of internalized AcLDL conjugated with pHrodo to lysosomes (D) in sPLA2-V KD RAW264.7 cells. Details of the methods are described in the text. n=5 in each experiment. , P<0.05, **, P<0.01 vs. WT, ††, P<0.01 vs KD. E, Immunoblotting showing successful expression of c-Src protein driven by an expression vector used to transfect sPLA2-V KD RAW264.7 cells. Values were normalized to that of WT (=1). F, siRNA (#1 and #2)-mediated reduction of PGK1 suppressed c-Src phosphorylation at Y416 in response to AcLDL in sPLA2-V WT RAW264.7 cells. G, Representative immunoblots for panel F. H, siRNA-mediated reduction of Beclin1 suppressed c-Src phosphorylation at Y416 in response to AcLDL in sPLA2-V WT RAW264.7 cells. I, Representative immunoblots for panel H. Values in panels F and H were normalized to that of control siRNA at baseline (incubation time 0)(=1). n=5 in each experiment, , P<0.05, **, P<0.01 vs. control siRNA.
Fig.10. Role of VPS34 in c-Src phosphorylation
A, siRNA-mediated reduction of VPS34 expression suppressed c-Src phosphorylation at Y416 in response to AcLDL in sPLA2-V WT RAW264.7 cells. Values in panels were normalized to that of control siRNA at baseline (incubation time 0)(=1). n=5 in each experiment, **, P<0.01 vs. control siRNA. B, Representative immunoblots for panel A. C, Reduction of VPS34 protein expression by siRNAs (#1 and #2). Values were normalized to that of control siRNA (=1). Upper panel shows representative immunoblots.
Supplementary Fig.2. Effects of siRNA-mediated knockdown of sPLA<sub>2</sub>-IID, -IIE, or -XIIA on Intracellular Translocation of AcLDL to Lysosomes and PGK1 Expression in sPLA<sub>2</sub>-V WT RAW264.7 Cells
Supplementary Fig.2. Effects of siRNA-mediated knockdown of sPLA2-IID, -IIE, or -XIIA on Intracellular Translocation of AcLDL to Lysosomes and PGK1 Expression in sPLA2-V WT RAW264.7 Cells
A and B, siRNA-mediated reduction of expression of sPLA2-IID, -IIE, or -XIIA did not change translocation of pHrodo-conjugated AcLDL to lysosomes (A) and expression of Pgk1 mRNA at baseline (B). MFI indicates mean fluorescence intensity. n=5 in each experiment. Values in B were normalized to that of control siRNA (=1). C, Reduction of expression of sPLA2-IID, -IIE, or -XIIA mRNA by their respective siRNAs (#1 and #2). n=5 in each experiment. Values were normalized to that of control siRNA (=1).
Fig.11. Experiments using primary cultures of peritoneal macrophages from sPLA<sub>2</sub>-V WT and knockout (KO) mice
Fig.11. Experiments using primary cultures of peritoneal macrophages from sPLA2-V WT and knockout (KO) mice
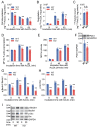
A, B, and C, sPLA2-V KO peritoneal macrophages had impaired specific internalization (A) and degradation (B) of 125I AcLDL but a similar degree of cell surface-specific binding (C) compared to sPLA2-V WT peritoneal macrophages. D and E, sPLA2-V KO peritoneal macrophages had decreased amounts of actin polymerization (D) and translocation of internalized AcLDL conjugated with pHrodo (E) compared with sPLA2-V WT macrophages. F, G, and H, PGK1 expression at baseline (F), Beclin1 phosphorylation at S30 (G), and c-Src phosphorylation at Y416 (H) were decreased in peritoneal macrophages from sPLA2-V KO mice compared with those from sPLA2-V WT mice. Values in panels F, G, and H were normalized to that of WT (incubation time 0 in panels G and H) (=1). Each bar represents the mean±SEM of 5 independent experiments. , P<0.05, **, P<0.01 vs. WT. I, Representative immunoblots in panels of G and H.

Similar articles

Cited by

References

    1. Murakami M, Sato H, Miki Y, Yamamoto K, Taketomi Y: A new era of secreted phospholipase A2. J Lipid Res, 2015; 56: 1248-1261 - PMC - PubMed
    1. Bingham CO 3rd, Fijneman RJ, Friend DS, Goddeau RP, Rogers RA, Austen KF, Arm JP: Low molecular weight group IIA and group V phospholipase A(2) enzymes have different intracellular locations in mouse bone marrow-derived mast cells. J Biol Chem, 1999; 274: 31476-31484 - PubMed
    1. Nardicchi V, Macchioni L, Ferrini M, Goracci G: The presence of a secretory phospholipase A2 in the nuclei of neuronal and glial cells of rat brain cortex. Biochim Biophys Acta, 2007; 1771: 1345-1352 - PubMed
    1. Fayard JM, Tessier C, Pageaux JF, Lagarde M, Laugier C: Nuclear location of PLA2-I in proliferative cells. J Cell Sci, 1998; 111 (Pt 7): 985-994 - PubMed
    1. Oishi T, Tamiya-Koizumi K, Kudo I, Iino S, Takagi K, Yoshida S: Purification and characterization of nuclear alkaline phospholipase A2 in rat ascites hepatoma cells. FEBS Lett, 1996; 394: 55-60 - PubMed