Review
. 2021 Mar;56(3):1093-1114.
doi: 10.1111/ijfs.14778. Epub 2020 Oct 13.

A review of root, tuber and banana crops in developing countries: past, present and future

Affiliations
Review

A review of root, tuber and banana crops in developing countries: past, present and future

Gregory J Scott. Int J Food Sci Technol. 2021 Mar.

Abstract

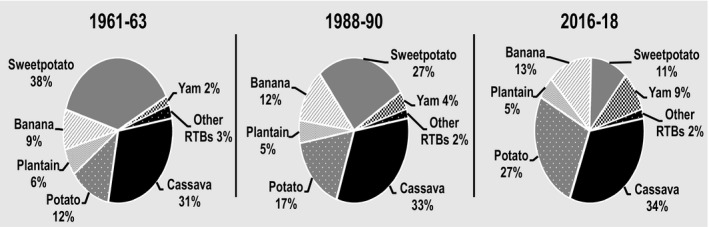
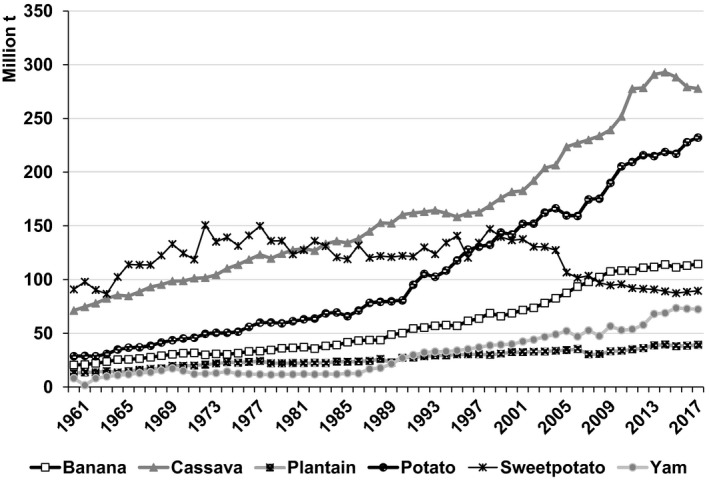
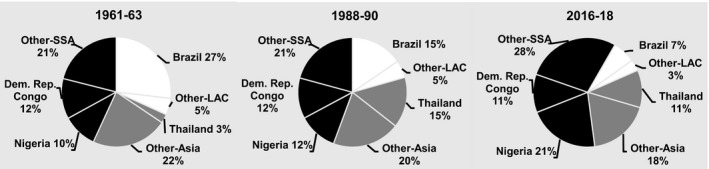
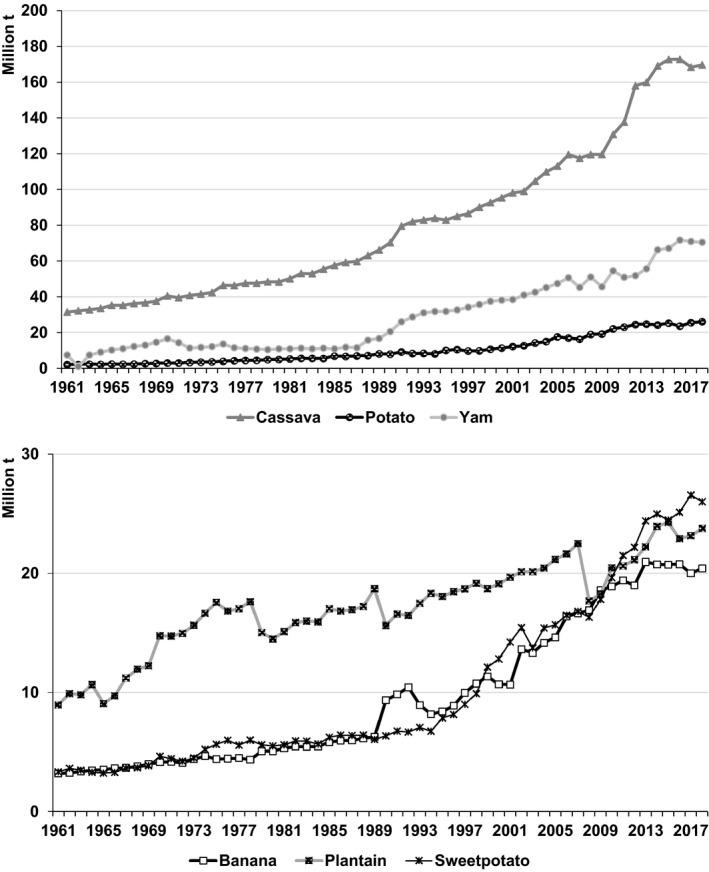
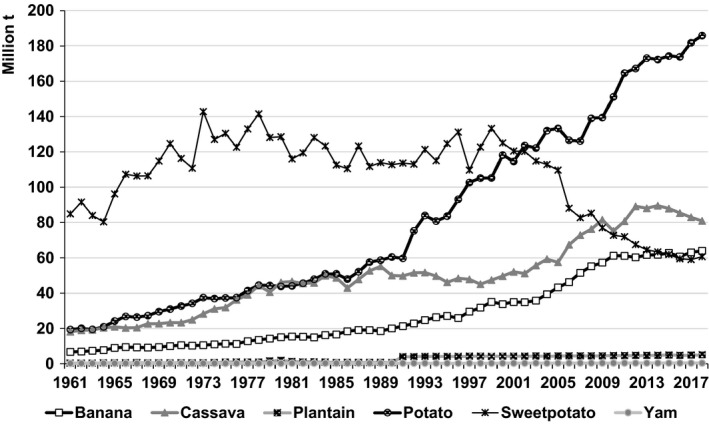
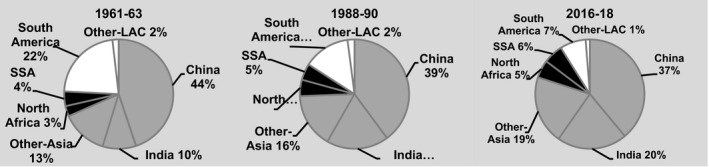
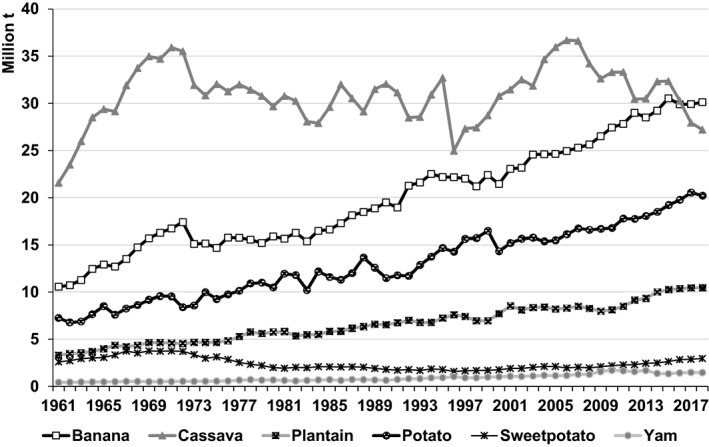
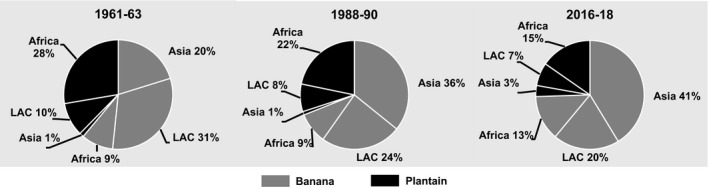
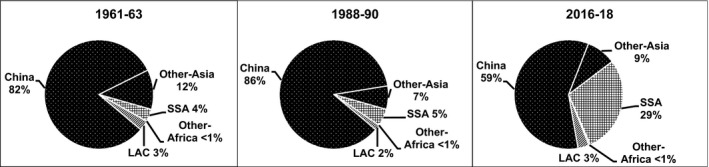
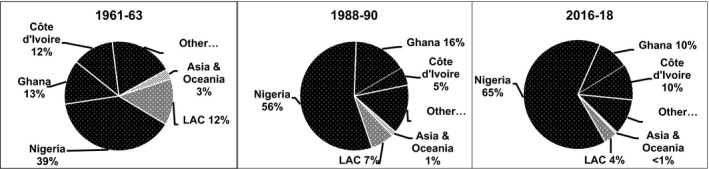
For many of the developing world's poorest farmers and food-insecure people, roots, tubers, bananas and plantain crops (RTBs) serve as a critical source of food, nutrition and cash income. RTBs have been particularly important in areas where local agri-food systems are under stress. Under such circumstances, growers, processors and traders often see opportunities to improve food security or increase their incomes with those crops due to shifting tastes and preferences for food and non-food products. Since the early 1990s, cassava output surged in sub-Saharan Africa, while potato production expanded rapidly in Asia. RTBs are consumed by over three billion people in developing countries with a market value of US$ 339 billion. This paper analyses the major changes in production, utilisation and trade of RTBs over the last six decades, assesses estimates of their future trajectory and offers recommendations so that they might achieve their full potential.

Keywords: Banana; cassava; consumption; food security; income; plantain; potato; production; sweetpotato; yam.


Figures

Figure 1
Figure 1
Percentages of the sum of total production of cassava, potato, sweetpotato, banana, yam, plantain and other RTBsa produced in developing countries in selected years, 1961–2018.b aOthers here refers to taro, yautia and the FAO category 'R&T, nes' that includes arracacha, mashua, ullucu, yacon, and other root and tuber crops. bFAOSTAT statistics for RTBS produced in developing countries in Africa, Asia and Latin America and the Caribbean (LAC) served to generate the percentages presented above. See footnotes in Tables 1, 2 and 3 for the list of territories included in each region. Source : FAOSTAT (2020) and calculations for this study.
Figure 2
Figure 2
Annual production of banana, cassava, plantain, potato, sweetpotato and yam produced in developing countries, 1961–2018.a aFAOSTAT statistics for RTBs produced in developing countries in Africa, Asia and Latin America and the Caribbean (LAC) served to generate the data points presented above. See footnotes in Tables 1, 2 and 3 for the list of territories included in each region. Source : FAOSTAT (2020).
Figure 3
Figure 3
Percentages of total production of cassava in developing countries produced in different regions, subregions and countries in selected years, 1961–2018.a aFAOSTAT statistics for developing countries in Africa, Asia and Latin America and the Caribbean (LAC) served to generate the percentages presented above. See footnotes in Tables 1, 2 and 3 for the list of territories included in each region. SSA refers to sub‐Saharan Africa. Source : FAOSTAT (2020) and calculations for this study.
Figure 4
Figure 4
Annual production of banana, cassava, plantain, potato, sweetpotato and yam in Africa, 1961–2018.a aFAOSTAT statistics for production of RTBs produced in developing countries in Africa served to generate the data points presented above. See the footnote in Table 1 for a list of territories included in that region. Source : FAOSTAT (2020).
Figure 5
Figure 5
Annual production of cassava, potato, sweetpotato, banana, yam and plantain in developing countries in Asia, 1961–2018.a aFAOSTAT statistics for developing economies in Asia served to generate the data points presented above. See the footnote in Table 2 for a list of territories included in that region. Source : FAOSTAT (2020).
Figure 6
Figure 6
Percentages of total production of potato in developing countries produced in different regions, subregions and countries in selected years, 1961–2018.a aFAOSTAT statistics for production of potato in developing countries in Africa, Asia and Latin America and the Caribbean (LAC) served to generate the percentages presented above. See footnotes in Tables 1, 2 and 3 for the list of territories included in each region. SSA refers to sub‐Saharan Africa. Source : FAOSTAT (2020) and calculations for this study.
Figure 7
Figure 7
Annual production of banana, cassava, plantain, potato, sweetpotato and yam in LAC, 1961–2018.a aFAOSTAT statistics for production of RTBs produced in developing countries in LAC served to generate the data points presented above. See the footnote in Table 3 for a list of territories included in that region. Source : FAOSTAT (2020).
Figure 8
Figure 8
Percentages of total production of banana and plantain in developing countries produced in different regions, subregions and countries in selected years, 1961–2018.a aFAOSTAT statistics for production of banana and plantain produced in developing countries in Africa, Asia and Latin America and the Caribbean (LAC) served to generate the percentages presented above. See footnotes in Tables 1, 2 and 3 for the list of territories included in each region. SSA refers to sub‐Saharan Africa. Source : FAOSTAT (2020) and calculations for this study.
Figure 9
Figure 9
Percentages of total production of sweetpotato in developing countries produced in different regions, subregions and countries in selected years, 1961–2018.a aFAOSTAT statistics for production of sweetpotato produced in developing countries in Africa, Asia and Latin America and the Caribbean (LAC) served to generate the percentages presented above. See footnotes in Tables 1, 2 and 3 for the list of territories included in each region. SSA refers to sub‐Saharan Africa. Source : FAOSTAT (2020) and calculations for this study.
Figure 10
Figure 10
Percentages of total production of yam in developing countries produced in different regions, subregions and countries in selected years, 1961–2018.a aFAOSTAT statistics for yam produced in developing countries in Africa, Asia and Latin America and the Caribbean (LAC) served to generate the percentages presented above. See footnotes in Tables 1, 2 and 3 for the list of territories included in each region. SSA refers to sub‐Saharan Africa. Source : FAOSTAT (2020) and calculations for this study.

References

    1. Alene, A.D. , Abdoulaye, T. , Rusike, J. et al. (2018). Identifying crop research priorities based on potential economic and poverty reduction impacts: The case of cassava in Africa, Asia, and Latin America. PLoS One, 13, e0201803. - PMC - PubMed
    1. Alexandratos, N. & Bruinsma, J. (2012). World Agriculture: Towards 2030/2050. The 2012 revision. ESA Working Paper. Agricultural Development Economics Division: Rome: Food and Agriculture Organization of the United Nations. https://ideas.repec.org/p/ags/faoaes/288998.html Accessed 07/15/2020
    1. Andrade, M. , Barker, I. , Cole, D. et al. (2009). Unleashing the Potential of Sweetpotato in Sub‐Saharan Africa: Current Challenges and Way Forward. Social Sciences Working Paper No. 2009–1. p. 206. Lima: International Potato Centre.
    1. Anonymous . (2017, September 21). Global trade potatoes increasing. https://www.freshplaza.com/article/2181637/global‐trade‐potatoes‐increas... Accessed 05/12/2020.
    1. Asiedu, R. & Sartie, A . (2010). Crops that feed the World 1. Yams. Food Security, 2, 305–315.