

Sensitivity assessment and optimal economic evaluation of a new COVID-19 compartmental epidemic model with control interventions
- PMID: 33776250
- PMCID: PMC7980175
- DOI: 10.1016/j.chaos.2021.110885
Sensitivity assessment and optimal economic evaluation of a new COVID-19 compartmental epidemic model with control interventions
Abstract
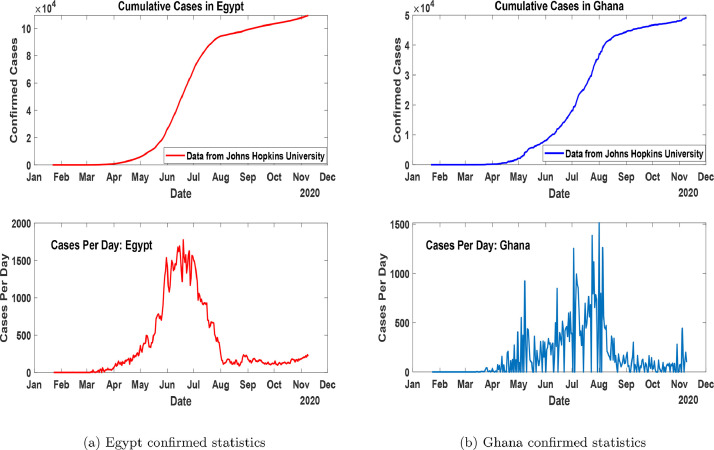
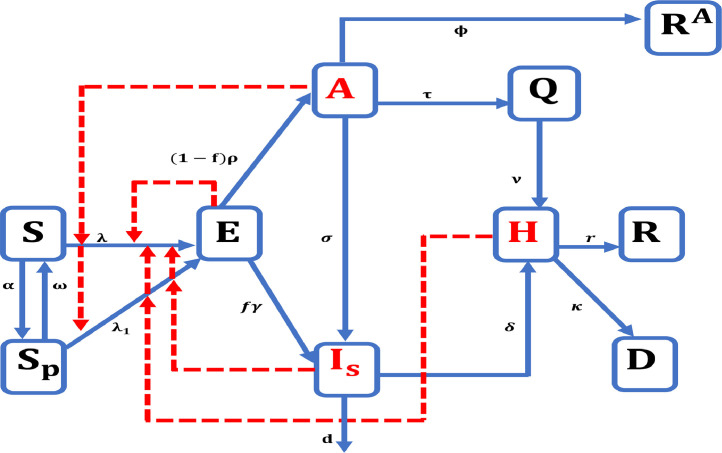
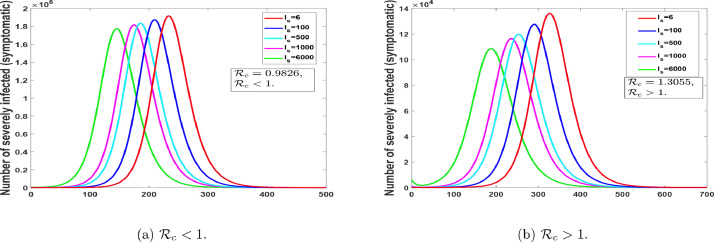
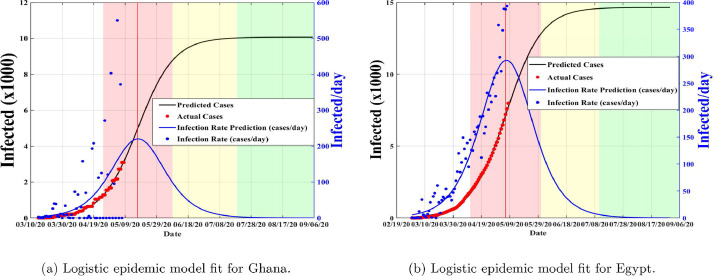
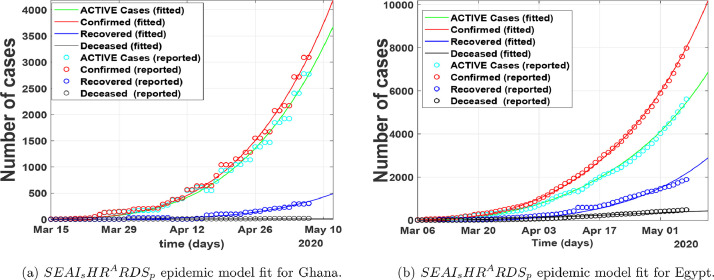
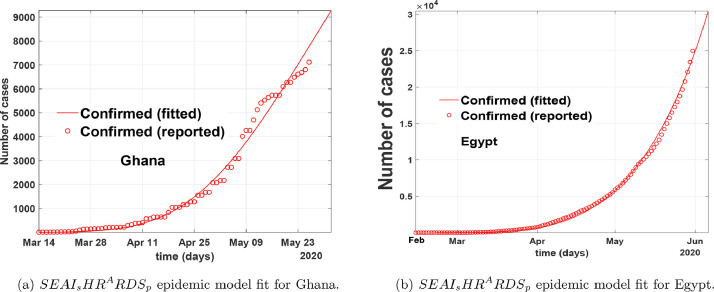
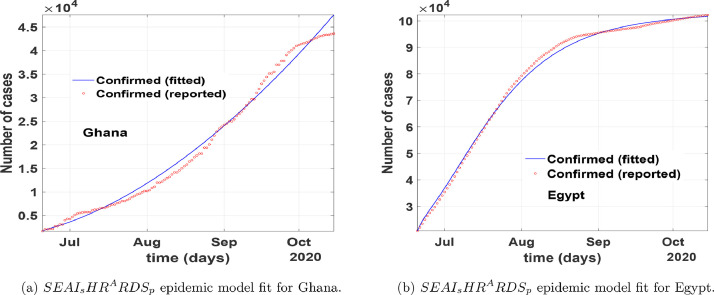
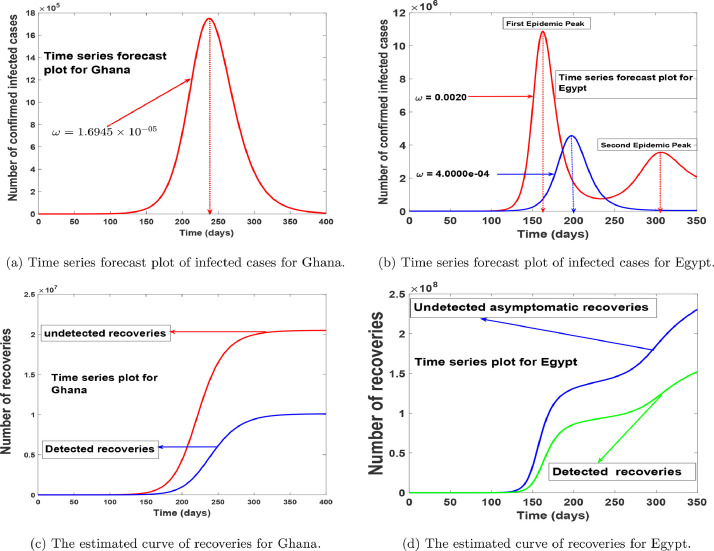
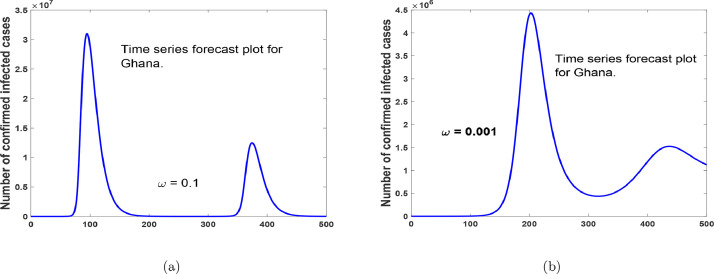
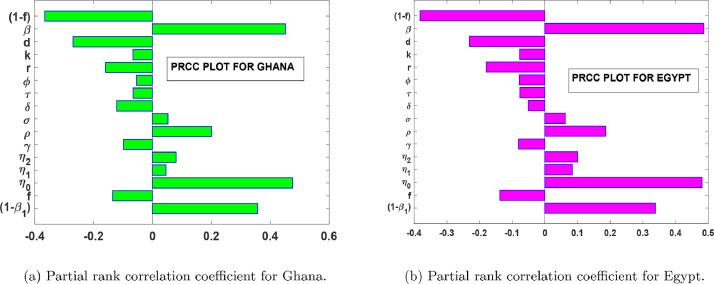
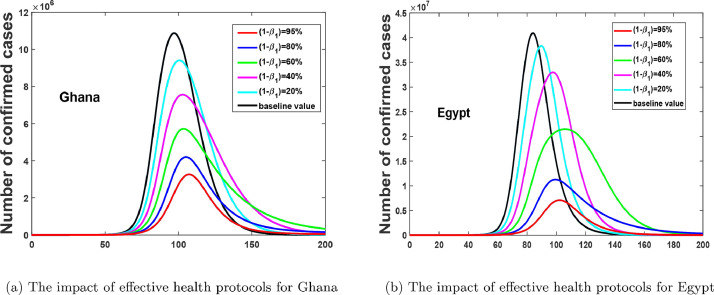
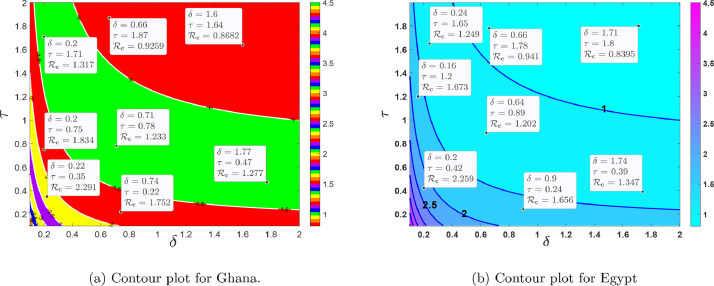
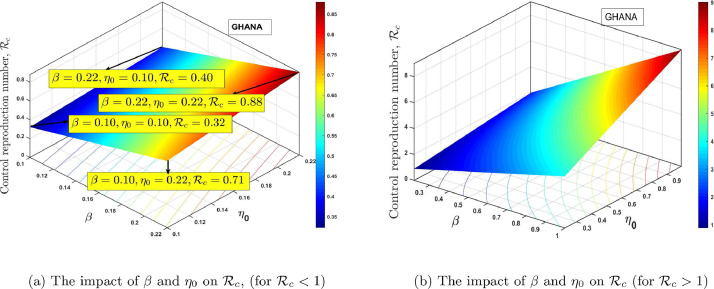
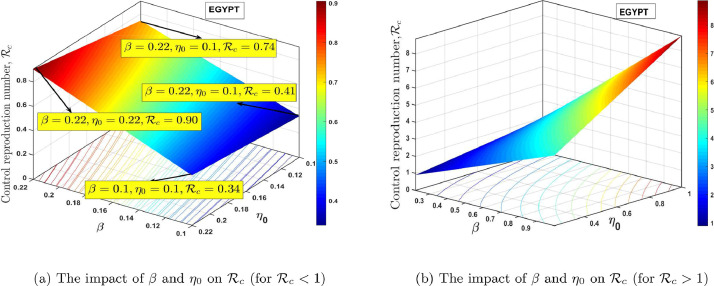
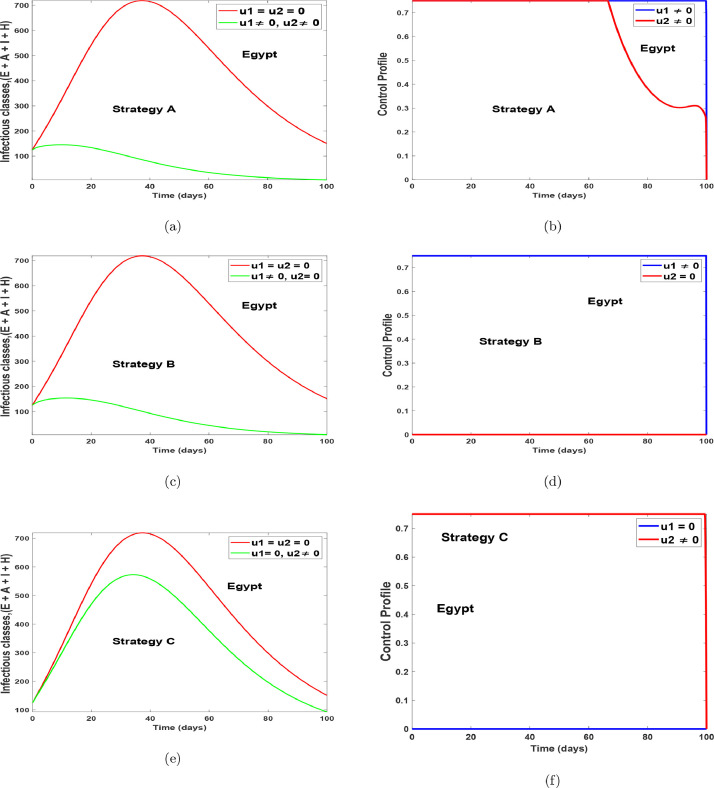
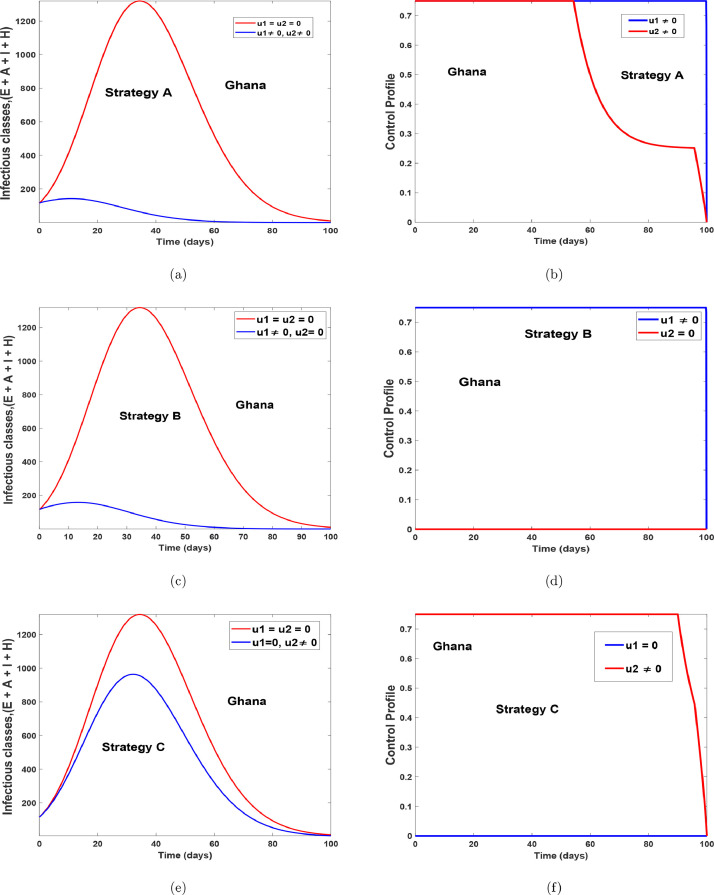
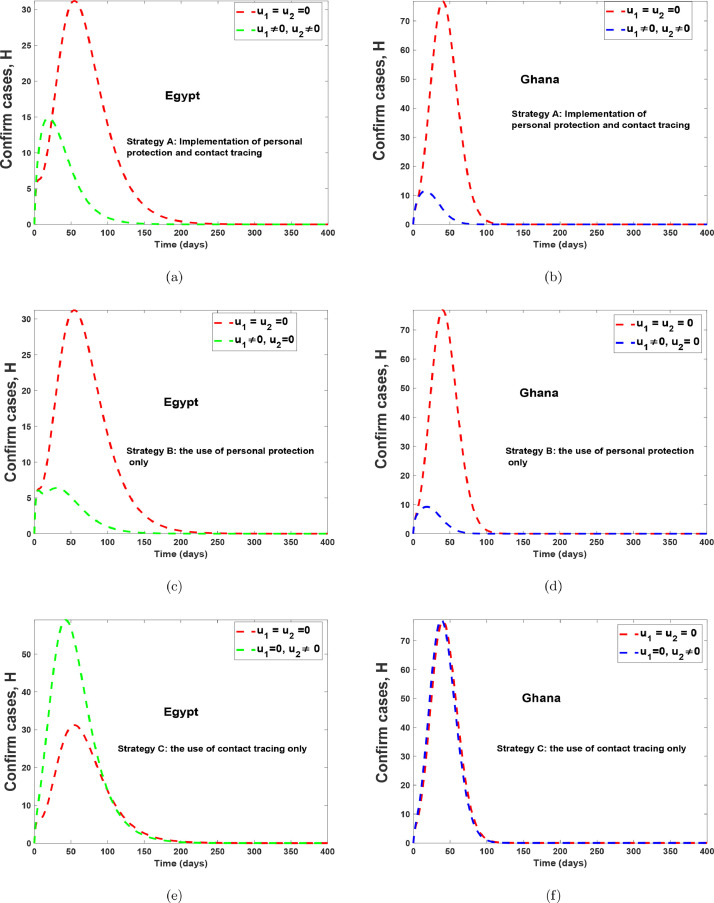
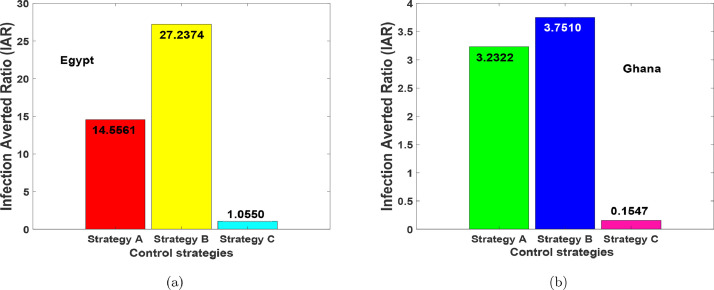
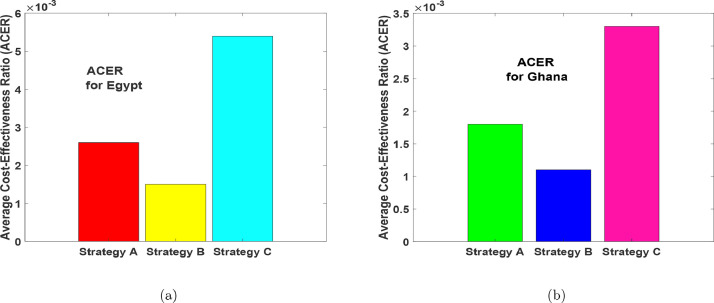
Optimal economic evaluation is pivotal in prioritising the implementation of non-pharmaceutical and pharmaceutical interventions in the control of diseases. Governments, decision-makers and policy-makers broadly need information about the effectiveness of a control intervention concerning its cost-benefit to evaluate whether a control intervention offers the best value for money. The outbreak of COVID-19 in December 2019, and the eventual spread to other parts of the world, have pushed governments and health authorities to take drastic socioeconomic, sociocultural and sociopolitical measures to curb the spread of the virus, SARS-CoV-2. To help policy-makers, health authorities and governments, we propose a Susceptible, Exposed, Asymptomatic, Quarantined asymptomatic, Severely infected, Hospitalized, Recovered, Recovered asymptomatic, Deceased, and Protective susceptible (individuals who observe health protocols) compartmental structure to describe the dynamics of COVID-19. We fit the model to real data from Ghana and Egypt to estimate model parameters using standard incidence rate. Projections for disease control and sensitivity analysis are presented using MATLAB. We noticed that multiple peaks (waves) of COVID-19 for Ghana and Egypt can be prevented if stringent health protocols are implemented for a long time and/or the reluctant behaviour on the use of protective equipment by individuals are minimized. The sensitivity analysis suggests that: the rate of diagnoses and testing, the rate of quarantine through doubling enhanced contact tracing, adhering to physical distancing, adhering to wearing of nose masks, sanitizing-washing hands, media education remains the most effective measures in reducing the control reproduction number to less than unity in the absence of vaccines and therapeutic drugs in Ghana and Egypt. Optimal control and cost-effectiveness analysis are rigorously studied. The main finding is that having two controls (transmission reduction and case isolation) is better than having one control, but is economically expensive. In case only one control is affordable, then transmission reduction is better than case isolation. Hopefully, the results of this research should help policy-makers when dealing with multiple waves of COVID-19.
Keywords: COVID-19 model; Cost-effectiveness analysis; Hospitalization; Mathematical epidemiology; Optimal control analysis; Quarantine.
© 2021 Elsevier Ltd. All rights reserved.
Conflict of interest statement
The authors declare that they have no known competing financial interests or personal relationships that could have appeared to influence the findings reported in this paper.
Figures
References
-
- NSW . 2020. Government: Novel coronavirus 2019 (2019 n-cov)
-
https://www.health.nsw.gov.au/Infectious/factsheets/Pages/novel-coronavirus.
-
- Rihan F.A., Al-Salti N.S., Anwar M.-N.Y. AIP Conf Proc. Vol. 1982. AIP Publishing LLC; 2018. Dynamics of coronavirus infection in human; p. 020009. - DOI
-
- worldometer . 2020. Countries in the world by population (2020)
-
https://www.worldometers.info/world-population/population-by-country/.
LinkOut - more resources
Full Text Sources
Other Literature Sources
Miscellaneous
