Review
. 2021 Mar 11:15:638429.
doi: 10.3389/fncir.2021.638429. eCollection 2021.

Dissociable Cortical and Subcortical Mechanisms for Mediating the Influences of Visual Cues on Microsaccadic Eye Movements

Affiliations
Review

Dissociable Cortical and Subcortical Mechanisms for Mediating the Influences of Visual Cues on Microsaccadic Eye Movements

Ziad M Hafed et al. Front Neural Circuits. .

Abstract

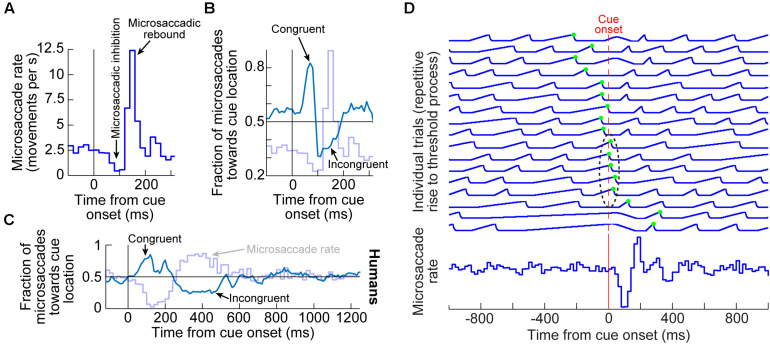
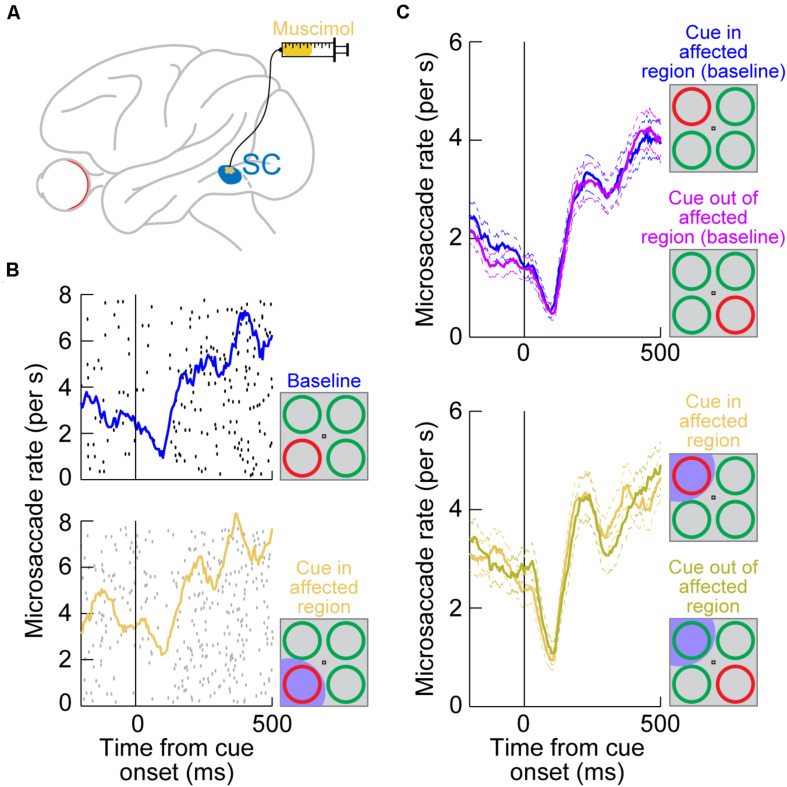
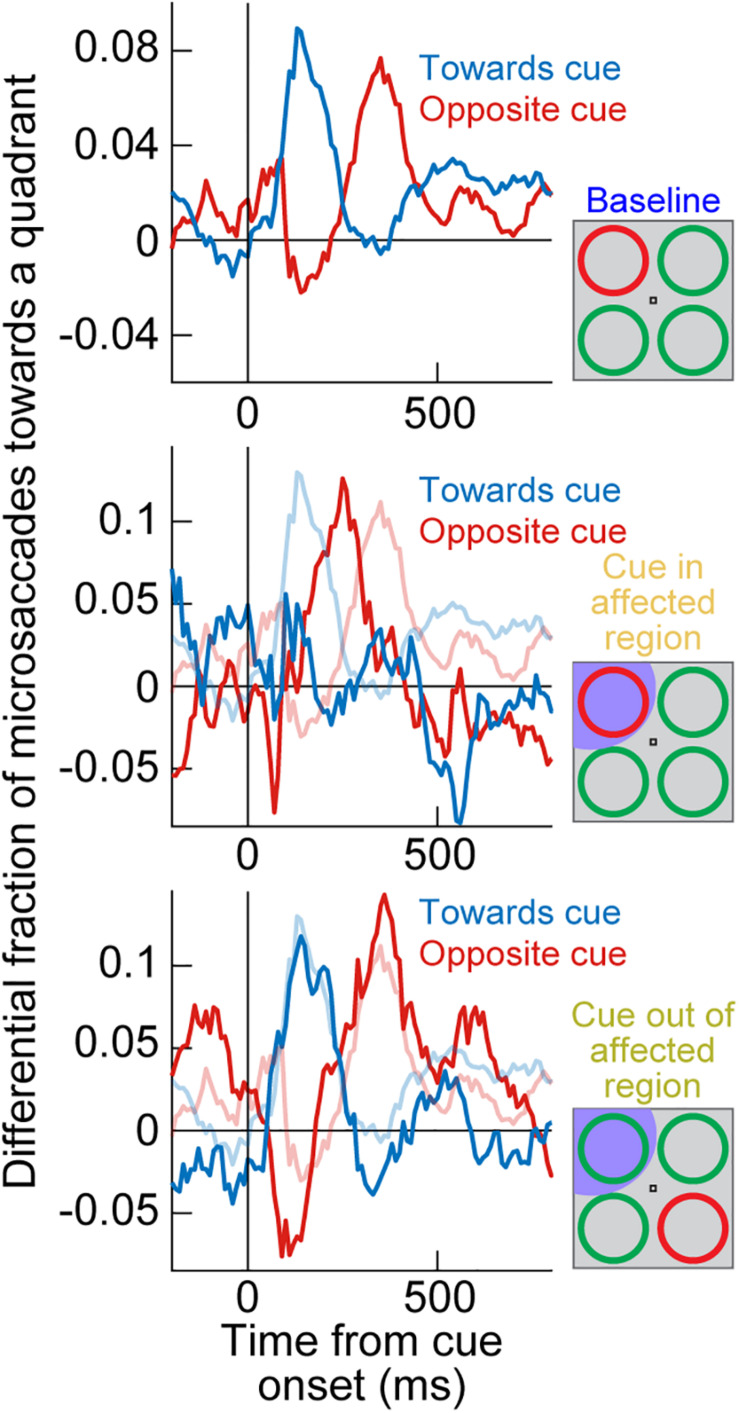
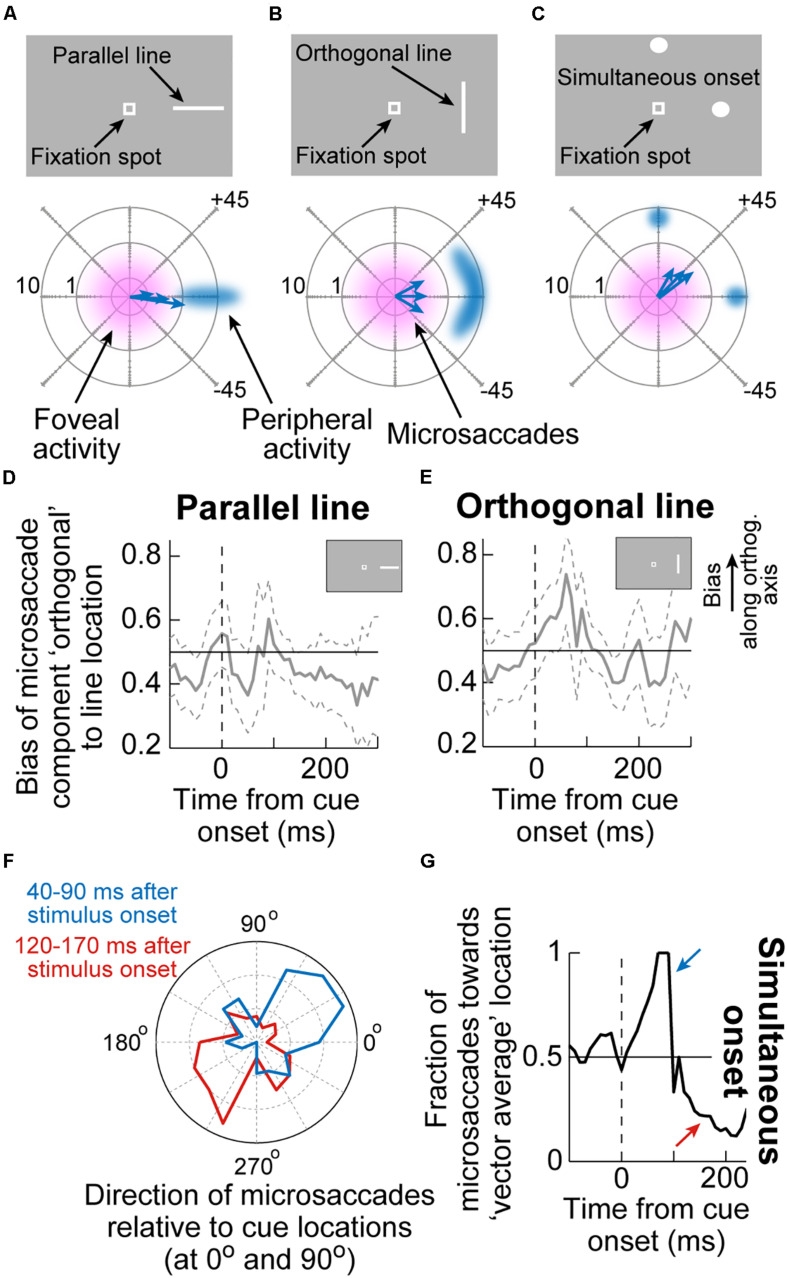
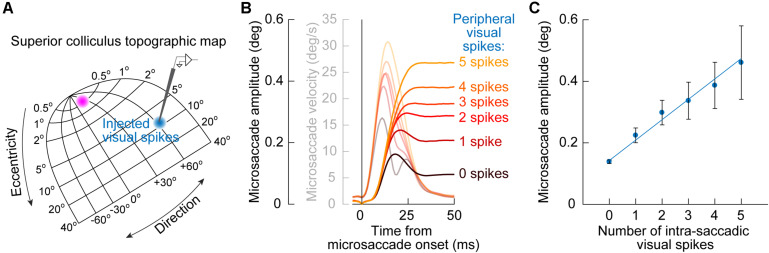
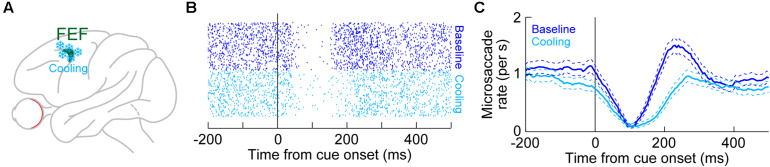
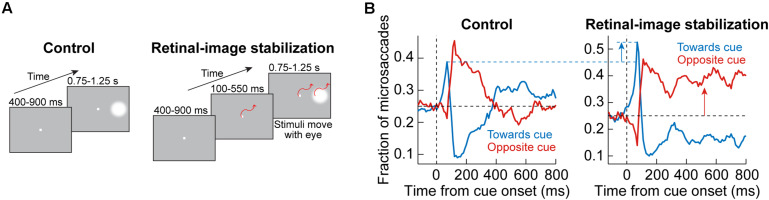
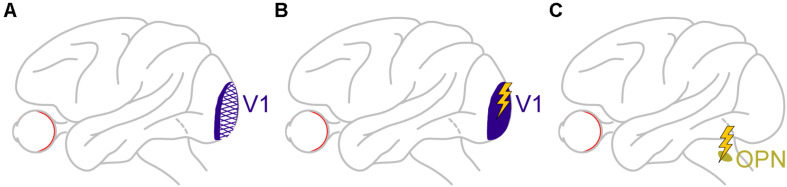
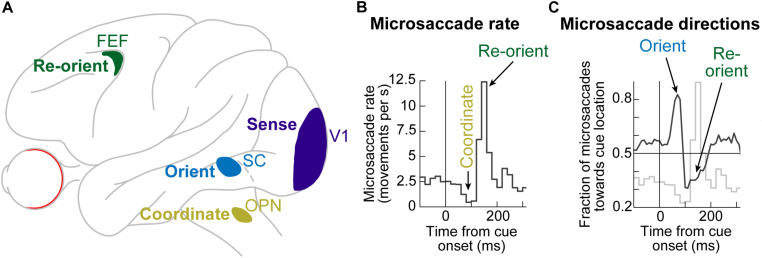
Visual selection in primates is intricately linked to eye movements, which are generated by a network of cortical and subcortical neural circuits. When visual selection is performed covertly, without foveating eye movements toward the selected targets, a class of fixational eye movements, called microsaccades, is still involved. Microsaccades are small saccades that occur when maintaining precise gaze fixation on a stationary point, and they exhibit robust modulations in peripheral cueing paradigms used to investigate covert visual selection mechanisms. These modulations consist of changes in both microsaccade directions and frequencies after cue onsets. Over the past two decades, the properties and functional implications of these modulations have been heavily studied, revealing a potentially important role for microsaccades in mediating covert visual selection effects. However, the neural mechanisms underlying cueing effects on microsaccades are only beginning to be investigated. Here we review the available causal manipulation evidence for these effects' cortical and subcortical substrates. In the superior colliculus (SC), activity representing peripheral visual cues strongly influences microsaccade direction, but not frequency, modulations. In the cortical frontal eye fields (FEF), activity only compensates for early reflexive effects of cues on microsaccades. Using evidence from behavior, theoretical modeling, and preliminary lesion data from the primary visual cortex and microstimulation data from the lower brainstem, we argue that the early reflexive microsaccade effects arise subcortically, downstream of the SC. Overall, studying cueing effects on microsaccades in primates represents an important opportunity to link perception, cognition, and action through unaddressed cortical-subcortical neural interactions. These interactions are also likely relevant in other sensory and motor modalities during other active behaviors.

Keywords: brainstem omnipause neurons; fixational eye movements; frontal eye fields; microsaccades; primary visual cortex; superior colliculus; visual attention; visual selection.


Conflict of interest statement

The authors declare that the research was conducted in the absence of any commercial or financial relationships that could be construed as a potential conflict of interest.

Figures

FIGURE 1
FIGURE 1
Systematic modulation of microsaccades after peripheral cue onsets. (A) Microsaccade rate from one monkey as a function of time from cue onset. In a baseline interval (e.g. before the cue), microsaccades come at a steady rate. Less than 100 ms after cue onset, microsaccade rate abruptly decreases (microsaccadic inhibition). A later rebound above baseline microsaccade rate then occurs, before a subsequent return to steady-state frequency. (B) The distribution of microsaccade directions relative to peripheral cue onset location is also time varying, and in a manner that is related to the microsaccadic rate modulations [the faint curve shows microsaccade frequency from (A) as a reference]. At the onset of microsaccadic inhibition, microsaccade directions are strongly biased toward the cue location (congruent microsaccades). Shortly afterward, at the onset of the rebound phase, microsaccades are strongly biased opposite the cue direction (incongruent microsaccades). (C) Human microsaccades show very similar modulations, but with slower temporal dynamics. (D) Mechanistically, the effects in (A–C) may reflect a resetting of ongoing microsaccade generation rhythms. Each fixation trial may be viewed as a repetitive rise-to-threshold process; a microsaccade is triggered at every threshold crossing (green dots indicate the time of the nearest microsaccade to stimulus onset). Cue onset resets the rise-to-threshold process, such that across trials, the modulations in (A–C) can emerge (bottom histogram for the case of microsaccade rate). Note how the trials highlighted with the black oval are trials in which cue onset comes too late to successfully reset the currently ongoing microsaccade rise-to-threshold process, resulting in very early microsaccades after cue onset. This theoretical framework suggests that cued-induced microsaccadic modulations depend on specific sensory and motor structures contributing specific components of the modulations in (A–C), as we review in this article. (A,B,D) adapted with permission from Hafed and Ignashchenkova (2013); (C) adapted with permission from Tian et al. (2016).
FIGURE 2
FIGURE 2
Reversible inactivation of the SC does not influence microsaccadic rate modulations after peripheral cue onsets. (A) Injection of the GABA agonist muscimol into a restricted region of the SC topographic map. The injection was intended to affect only an extra-foveal representation of the SC, such that microsaccade-related neurons in the foveal zone (Hafed et al., 2009; Hafed and Krauzlis, 2012; Chen et al., 2019; Willeke et al., 2019) were largely not affected. Rather, it was the representation of the location of a peripheral visual cue that was targeted [see the bottom schematic in (B)] (Hafed et al., 2013). (B) Microsaccade rate in a cueing task from a sample session before SC inactivation (top) and after inactivation (bottom). The task consisted of the onset of a color singleton ring as the cue in an attentional task (Lovejoy and Krauzlis, 2010); see schematics on the right. In this session, the cue appeared in the bottom left quadrant of the display relative to fixation position. Each black or gray dot indicates the onset time of a microsaccade relative to cue onset (different rows represent different trials), and all microsaccades toward or opposite the cue quadrant are shown. The colored curves show microsaccade rate estimates in each block. In the bottom panel, the SC representation of the lower left quadrant of the display was inactivated (shaded in the bottom schematic); that is, it was the representation of the singleton cue that was affected. Microsaccadic inhibition happened regardless of SC inactivation, and the overall rate modulation was similar with or without SC inactivation (Hafed et al., 2013). (C) Microsaccade rate from the same monkey across all sessions. The top panel shows rate modulations without SC inactivation when the cue was either in or outside of the region to be targeted by muscimol (opposite quadrants; see schematic insets on the right). Microsaccade rate modulations were identical, with strong microsaccadic inhibition shortly after cue onset. In the bottom panel, data from the same sessions are shown, but now with the SC inactivated in one quadrant of the visual display. Whether the cue was placed in the affected quadrant or opposite from it (see schematic insets on the right), microsaccadic rate modulations were similar. (B,C) Adapted with permission from Hafed et al. (2013).
FIGURE 3
FIGURE 3
Reversible inactivation of the SC strongly influences cue-induced microsaccade direction oscillations by impairing the propensity for early cue-directed movements. Each panel shows a measure of propensity to generate microsaccades in a certain direction. In the top panel, the singleton cue onset, without SC inactivation, caused a clear microsaccade direction oscillation in the same monkey as in Figure 2. First, there was an increased likelihood of microsaccades toward the visual quadrant of the cue (blue curve), and then there was an increased likelihood of microsaccades toward the opposite quadrant (red curve). For simplicity, movements to the other two visual display quadrants (the least modulated by the cue) are not shown. This panel was adapted with permission from Hafed et al. (2011). In the middle panel, the cue appeared in the quadrant affected by SC inactivation (see shading in the schematic inset on the right). The early cue-directed microsaccades were massively reduced relative to baseline (blue curve), and oppositely directed microsaccades (red curve) came earlier than in baseline. The baseline curves from the top panel are shown in faint colors for comparison. When the cue was placed opposite the affected region (bottom panel), the direction oscillations were normal again, and very similar to the baseline data without any SC inactivation (faint colors). Therefore, cue-incongruent microsaccades after microsaccadic inhibition (e.g., Figure 1) are not affected by SC inactivation (even when they are still directed toward the affected quadrant, as in the bottom panel); only the earlier cue-congruent microsaccades are affected when the cue is in the impaired display region. The middle and bottom panels are adapted with permission from Hafed et al. (2013).
FIGURE 4
FIGURE 4
Sensitivity of cue-induced microsaccade direction distributions to the spatial layout of peripheral cue configuration. (A) If the peripheral cue is spatially distributed as a parallel line relative to cue direction (top), as opposed to just a spot, then early cue-congruent microsaccades would exhibit endpoint variance along the axis of the appearing line. The bottom schematic shows how microsaccade endpoints, despite being foveal and not reaching the peripheral stimulus location, are still cue-directed, but exhibit variance along the orientation of the line. Eccentricity in the bottom schematic is plotted on a logarithmic scale to visually magnify the small amplitudes. (B) If the peripheral cue is at the same peripheral location but is oriented as an orthogonal line instead, then early cue-congruent microsaccades (bottom schematic) would have vertical variance reflecting the spatial extent of the peripheral stimulus. (C) In the extreme of two simultaneous onsets, spatial readout from a map like that of the SC for saccades would predict microsaccades to neither of the stimuli (bottom schematic). (D,E) The time course of microsaccade orthogonal bias for the configurations in (A,B). For a parallel line (D), there is no orthogonal bias. However, for an orthogonal line (E), early cue-induced microsaccades directed toward the peripheral stimulus have increased orthogonal variance, as in (B). (F) For a simultaneous stimulus onset, like in (C), early cue-induced microsaccades (40–90 ms) are directed toward the vector average direction of the two stimulus locations, consistent with saccadic readout of SC map activity (Lee et al., 1988; Glimcher and Sparks, 1993; Port and Wurtz, 2003; Katnani et al., 2012). Later microsaccades (120–170 ms) are opposite the vector average location. (G) Time course of the effects in (F). Adapted with permission from Hafed and Ignashchenkova (2013).
FIGURE 5
FIGURE 5
Quantitative link between microsaccade endpoint variability for early cue-induced microsaccades and the number of peripheral cue-induced SC visual spikes. (A) After cue onset, a visual burst is emitted in the peripheral SC representation (blue population of neurons on the SC topographic map). The timing of these visual burst spikes coincides with the timing of early cue-congruent microsaccades (e.g., Figure 1B). This might suggest that the impact of the SC on early microsaccade directions (as predicted from Figure 3) is mediated by readout, by downstream structures, of cue-induced visual spikes in the SC as if they were part of the simultaneously occurring movement spikes in the rostral SC (magenta population). (B) Consistent with this, cue-congruent microsaccades are larger in size than baseline microsaccades (Hafed and Ignashchenkova, 2013; Tian et al., 2016). More critically, the increase in size is deterministically related to the number of peripheral cue-induced SC spikes. The more “visual” spikes in a recorded peripheral SC neuron at the cued location, the larger the microsaccade. Faint colors also show microsaccade velocity profiles. (C) This relationship between cue-induced visual spikes in the SC and early cue-induced microsaccade amplitudes is linear for movements toward the cue (the great majority of movements shortly after cue onset). Thus, every spike of every active cue-driven SC neuron contributes to microsaccade endpoint variability. Adapted with permission from Buonocore et al. (2020b).
FIGURE 6
FIGURE 6
Reversible inactivation of the FEF, through cryogenic techniques, strongly influences microsaccade rate in the post-inhibition rebound phase. (A) Large portions of the FEF (either unilaterally or bilaterally) were reversibly inactivated by cooling of neural tissue. (B) Microsaccade onset times across trials (each row of rasters represents an individual trial) in baseline (blue) or with unilateral FEF inactivation (light blue). The task consisted of fixation with the onset of a peripheral spot in the affected hemifield. In baseline, there was expected microsaccadic inhibition shortly after cue onset, followed by a rebound in microsaccade likelihood. With FEF inactivation, microsaccadic inhibition still occurred, and with similar latency to baseline. However, the post-inhibition rebound was strongly impaired, resulting in an appearance of prolonged microsaccadic inhibition. (C) Microsaccade rate estimates for the data in (B). Microsaccadic inhibition still clearly happened with or without FEF inactivation. However, microsaccadic rebound only happened when the FEF was intact (baseline). (B,C) Adapted with permission from Peel et al. (2016).
FIGURE 7
FIGURE 7
Behavioral causal manipulation to isolate the influences of SC and FEF activity on cue-induced microsaccades. (A) Behavioral task to experimentally control the spatial landscape of visual and oculomotor activity (Tian et al., 2016). In control (left), a peripheral cue appeared during fixation and was maintained throughout trial duration. With real-time retinal-image stabilization, the fixation spot and cue were experimentally pegged on the retina (that is, moved with the eye). Thus, a cue-induced early microsaccade did not generate a foveal position error at fixation that needed to be corrected; on the other hand, it could move the peripheral stimulus even farther out on the display (potentially rendering it invisible beyond the display edge if there was no top-down compensation that is implemented). (B) In control (left panel), a plot of microsaccade direction distributions reveals a similar oscillation to Figure 1: first, there was a bias of movements toward the cue (blue curve elevating above the horizontal black dashed line), and then there was a bias of opposite movements (red curve elevating above the horizontal black dashed line). With retinal-image stabilization (right panel), the early cue-induced effect was amplified. This was because the spatial layout of the peripheral stimulus onset was no longer competing with other factors like foveal position error at the fixation spot, which was uncontrolled in the control condition. Moreover, for subsequent microsaccades, there was a strong bias opposite the cue. Without such a bias, the peripheral stimulus could eventually have moved out of the display if all microsaccades continued to be toward the cue. Therefore, this causal manipulation further highlights the notion that post-inhibition microsaccades require top down strategic control, whereas early cue-induced microsaccades (during microsaccadic inhibition) are more reflexive (and likely subcortically mediated). Adapted with permission from Tian et al. (2016).
FIGURE 8
FIGURE 8
Causal manipulations in V1 and also downstream of the SC provide additional insights on the dissociable roles of cortical and subcortical pathways in mediating cue-induced influences on microsaccades. (A) Monkeys with large V1 lesions can perform cueing tasks (Yoshida et al., 2017), and how microsaccades in them are affected will provide a rich source of information on cortical routes for affecting cue-induced microsaccades. The available evidence so far suggests that, for at least some type of cues, V1 is not necessary for microsaccadic inhibition to occur (Yoshida and Hafed, 2017). (B) In monkeys with an intact V1, brief microstimulation pulses mimicking the brief visual bursts caused by cue onsets also provide hints on the role of V1 visual bursts in microsaccadic rate and direction modulations. In this case, V1 is sufficient for inhibition to occur (Buonocore et al., 2020a), likely through the generation of visual phosphenes that eventually propagate into the oculomotor system. (C) Finally, brief microstimulation pulses mimicking brief visual bursts (Buonocore et al., 2020a) in omnipause neurons (OPN’s), downstream of the SC, are isolating a role for these neurons, which constitute the final gating point for saccade generation, in implementing microsaccadic inhibition. The lack of influence of SC and FEF inactivation on microsaccadic inhibition (Figures 2, 6), as well as the persistence of inhibition even with V1 lesions (for at least the types of cues tested so far), might mean that it is indeed OPN’s that are the most critical structure for implementing microsaccadic inhibition.
FIGURE 9
FIGURE 9
An integrative view of the cortical and subcortical contributions to modulations of microsaccades after visual cues. (A) Cue onsets are essentially “sensed” by all shown areas. However, the visual bursts occurring in the different areas contribute differential roles. Visual bursts in V1 likely serve visual detection in general. However, those in the SC at very similar times influence microsaccade directions, and those in OPN’s (again at similar times) influence coordination of microsaccade timing to result in microsaccadic inhibition. Such early cue-induced visual bursts in all of these areas likely trump the influences of early visual bursts in FEF, because the FEF seems to be least critical for early cue-induced microsaccades (Figure 6). Rather, FEF activity matters much more after the initial reflexive influences mediated subcortically. Thus, FEF activity serves to re-orient microsaccades after the initial cue-induced reflexes. (B) The integrative view in (A) allows explicitly interpreting the individual components of known modulations in microsaccades after cue onset (e.g., Figure 1). In terms of microsaccade rate, visual bursts in OPN’s allow coordination of microsaccade timing, resulting in microsaccadic inhibition. Subsequent microsaccades (during the post-inhibition rebound phase) are mediated by FEF re-orienting. (C) In terms of microsaccade direction oscillations, SC visual bursts after cue onset are read out in a way to influence microsaccade directions toward the appearing cues. Subsequent microsaccades are deliberate efforts to maintain the eye at the fixated target despite the peripherally appearing cue. Therefore, microsaccade direction oscillations reflect an initial reflexive orientation mediated by the SC followed by a deliberate re-orientation mediated by the FEF.

Similar articles

Cited by

References

    1. Abadi R. V., Gowen E. (2004). Characteristics of saccadic intrusions. Vision Res. 44 2675–2690. 10.1016/j.visres.2004.05.009 - DOI - PubMed
    1. Andersen R. A., Brotchie P. R., Mazzoni P. (1992). Evidence for the lateral intraparietal area as the parietal eye field. Curr. Opin. Neurobiol. 2 840–846. 10.1016/0959-4388(92)90143-9 - DOI - PubMed
    1. Andersen R. A., Essick G. K., Siegel R. M. (1987). Neurons of area 7 activated by both visual stimuli and oculomotor behavior. Exp. Brain Res. 67 316–322. 10.1007/BF00248552 - DOI - PubMed
    1. Anton-Erxleben K., Carrasco M. (2013). Attentional enhancement of spatial resolution: linking behavioural and neurophysiological evidence. Nat. Rev. Neurosci. 14 188–200. 10.1038/nrn3443 - DOI - PMC - PubMed
    1. Awh E., Armstrong K. M., Moore T. (2006). Visual and oculomotor selection: links, causes and implications for spatial attention. Trends Cogn. Sci. 10 124–130. 10.1016/j.tics.2006.01.001 - DOI - PubMed

Publication types

LinkOut - more resources