

In Vitro Culture Expansion Shifts the Immune Phenotype of Human Adipose-Derived Mesenchymal Stem Cells
- PMID: 33777002
- PMCID: PMC7988085
- DOI: 10.3389/fimmu.2021.621744
In Vitro Culture Expansion Shifts the Immune Phenotype of Human Adipose-Derived Mesenchymal Stem Cells
Abstract
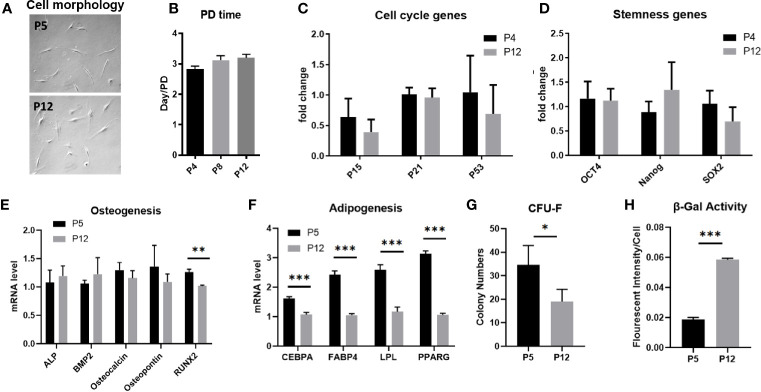
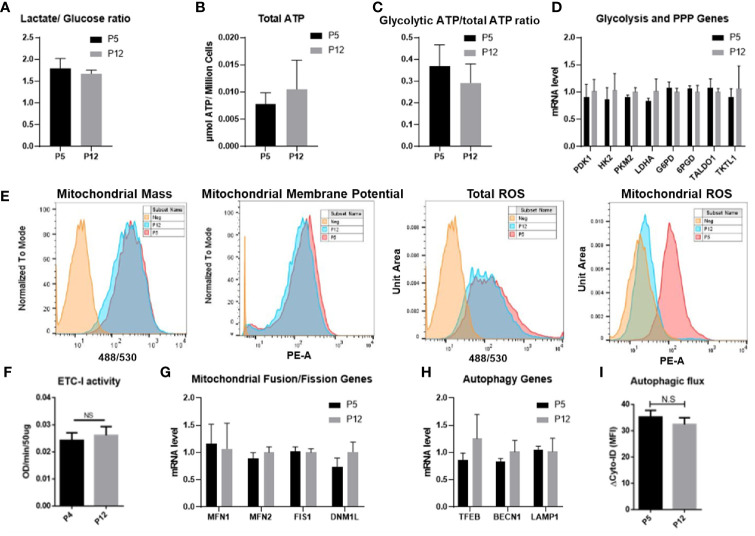
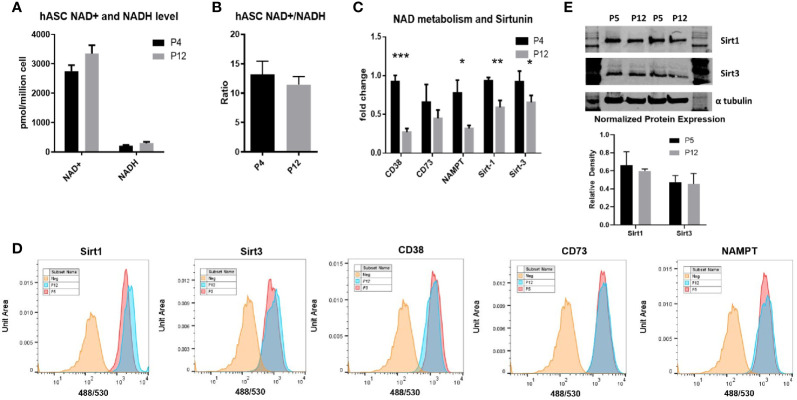
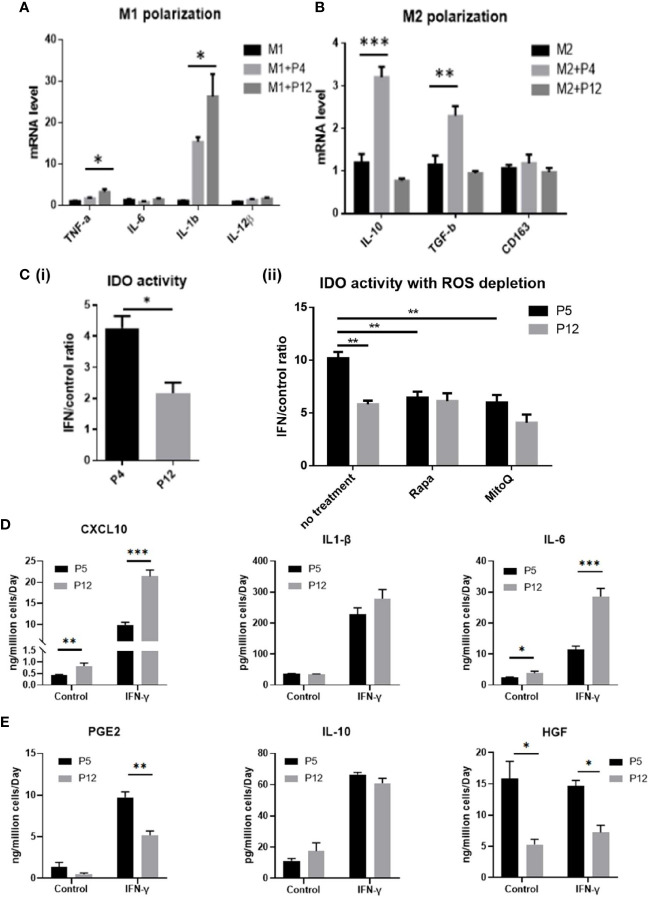
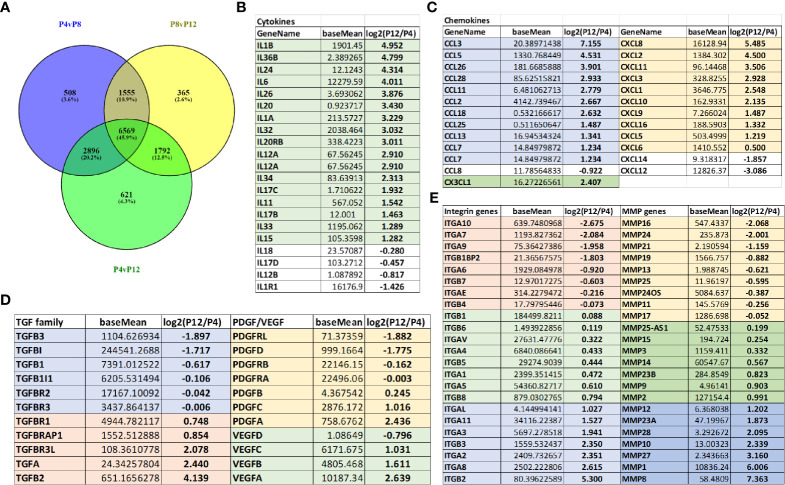
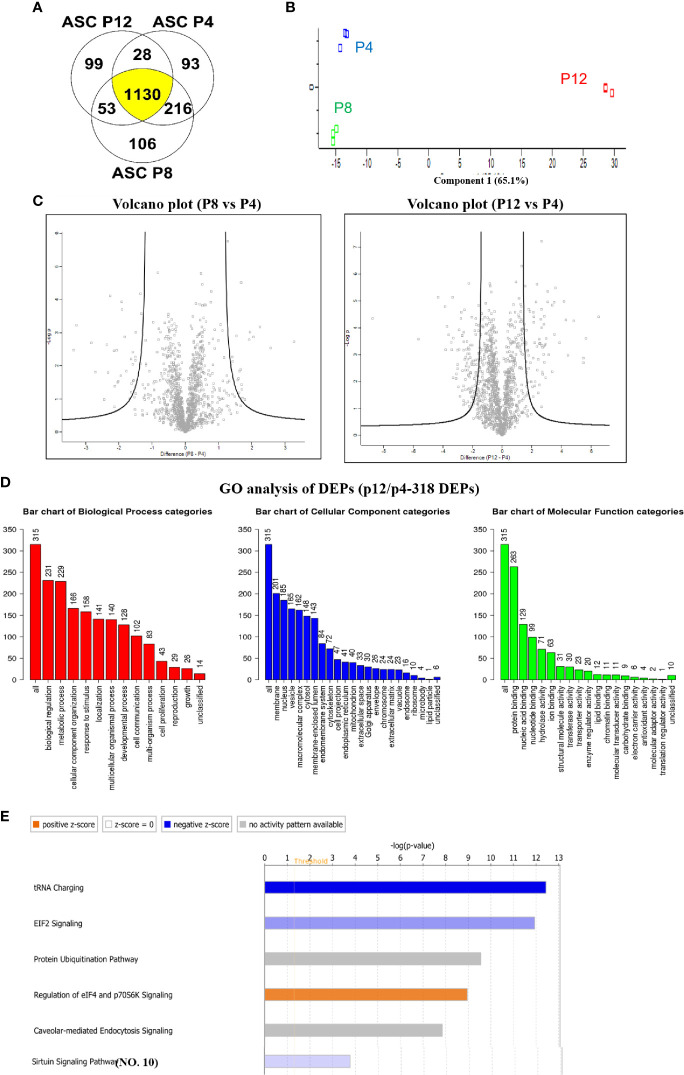
Human mesenchymal stem or stromal cells (hMSCs) are known for their potential in regenerative medicine due to their differentiation abilities, secretion of trophic factors, and regulation of immune responses in damaged tissues. Due to the limited quantity of hMSCs typically isolated from bone marrow, other tissue sources, such as adipose tissue-derived mesenchymal stem cells (hASCs), are considered a promising alternative. However, differences have been observed for hASCs in the context of metabolic characteristics and response to in vitro culture stress compared to bone marrow derived hMSCs (BM-hMSCs). In particular, the relationship between metabolic homeostasis and stem cell functions, especially the immune phenotype and immunomodulation of hASCs, remains unknown. This study thoroughly assessed the changes in metabolism, redox cycles, and immune phenotype of hASCs during in vitro expansion. In contrast to BM-hMSCs, hASCs did not respond to culture stress significantly during expansion as limited cellular senescence was observed. Notably, hASCs exhibited the increased secretion of pro-inflammatory cytokines and the decreased secretion of anti-inflammatory cytokines after extended culture expansion. The NAD+/NADH redox cycle and other metabolic characteristics associated with aging were relatively stable, indicating that hASC functional decline may be regulated through an alternative mechanism rather than NAD+/Sirtuin aging pathways as observed in BM-hMSCs. Furthermore, transcriptome analysis by mRNA-sequencing revealed the upregulation of genes for pro-inflammatory cytokines/chemokines and the downregulation of genes for anti-inflammatory cytokines for hASCs at high passage. Proteomics analysis indicated key pathways (e.g., tRNA charging, EIF2 signaling, protein ubiquitination pathway) that may be associated with the immune phenotype shift of hASCs. Together, this study advances our understanding of the metabolism and senescence of hASCs and may offer vital insights for the biomanufacturing of hASCs for clinical use.
Keywords: NAD redox cycle; adipose-derived mesenchymal stem cells; immune phenotype; proteomics; replicative senescence; transcriptomics.
Copyright © 2021 Jeske, Yuan, Fu, Bunnell, Logan and Li.
Conflict of interest statement
The authors declare that the research was conducted in the absence of any commercial or financial relationships that could be construed as a potential conflict of interest.
Figures
Similar articles
-
Decreased CRISPLD2 expression impairs osteogenic differentiation of human mesenchymal stem cells during in vitro expansion.J Cell Physiol. 2023 Jun;238(6):1368-1380. doi: 10.1002/jcp.31014. Epub 2023 Apr 6. J Cell Physiol. 2023. PMID: 37021796 Free PMC article.
-
Adipose-Derived Mesenchymal Stem Cells from the Elderly Exhibit Decreased Migration and Differentiation Abilities with Senescent Properties.Cell Transplant. 2017 Sep;26(9):1505-1519. doi: 10.1177/0963689717721221. Cell Transplant. 2017. PMID: 29113467 Free PMC article.
-
NAD+/NADH redox alterations reconfigure metabolism and rejuvenate senescent human mesenchymal stem cells in vitro.Commun Biol. 2020 Dec 15;3(1):774. doi: 10.1038/s42003-020-01514-y. Commun Biol. 2020. PMID: 33319867 Free PMC article.
-
[Safety evaluation of tissue engineered medical devices using normal human mesenchymal stem cells].Yakugaku Zasshi. 2007 May;127(5):851-6. doi: 10.1248/yakushi.127.851. Yakugaku Zasshi. 2007. PMID: 17473528 Review. Japanese.
-
Factors Defining Human Adipose Stem/Stromal Cell Immunomodulation in Vitro.Stem Cell Rev Rep. 2024 Jan;20(1):175-205. doi: 10.1007/s12015-023-10654-7. Epub 2023 Nov 14. Stem Cell Rev Rep. 2024. PMID: 37962697 Free PMC article. Review.
Cited by
-
Donor Sex and Passage Conditions Influence MSC Osteogenic Response in Mineralized Collagen Scaffolds.Adv Healthc Mater. 2024 Oct;13(27):e2400039. doi: 10.1002/adhm.202400039. Epub 2024 Jul 22. Adv Healthc Mater. 2024. PMID: 39036820 Free PMC article.
-
Adipose Tissue and Umbilical Cord Tissue: Potential Sources of Mesenchymal Stem Cells for Liver Fibrosis Treatment.J Clin Exp Hepatol. 2024 Jul-Aug;14(4):101364. doi: 10.1016/j.jceh.2024.101364. Epub 2024 Feb 12. J Clin Exp Hepatol. 2024. PMID: 38449506 Free PMC article.
-
Comparison of the yields and properties of dedifferentiated fat cells and mesenchymal stem cells derived from infrapatellar fat pads.Regen Ther. 2022 Nov 29;21:611-619. doi: 10.1016/j.reth.2022.11.006. eCollection 2022 Dec. Regen Ther. 2022. PMID: 36475026 Free PMC article.
-
3D Tissue-Engineered Vascular Drug Screening Platforms: Promise and Considerations.Front Cardiovasc Med. 2022 Mar 4;9:847554. doi: 10.3389/fcvm.2022.847554. eCollection 2022. Front Cardiovasc Med. 2022. PMID: 35310996 Free PMC article. Review.
-
Management of Rheumatoid Arthritis: Possibilities and Challenges of Mesenchymal Stromal/Stem Cell-Based Therapies.Cells. 2023 Jul 21;12(14):1905. doi: 10.3390/cells12141905. Cells. 2023. PMID: 37508569 Free PMC article. Review.
References
Publication types
MeSH terms
Substances
Grants and funding
LinkOut - more resources
Full Text Sources
Other Literature Sources