Observational Study
. 2021 Mar 10:12:651619.
doi: 10.3389/fimmu.2021.651619. eCollection 2021.

A Comprehensive View on the Human Antibody Repertoire Against Staphylococcus aureus Antigens in the General Population

Affiliations
Observational Study

A Comprehensive View on the Human Antibody Repertoire Against Staphylococcus aureus Antigens in the General Population

Tanja C Meyer et al. Front Immunol. .

Abstract

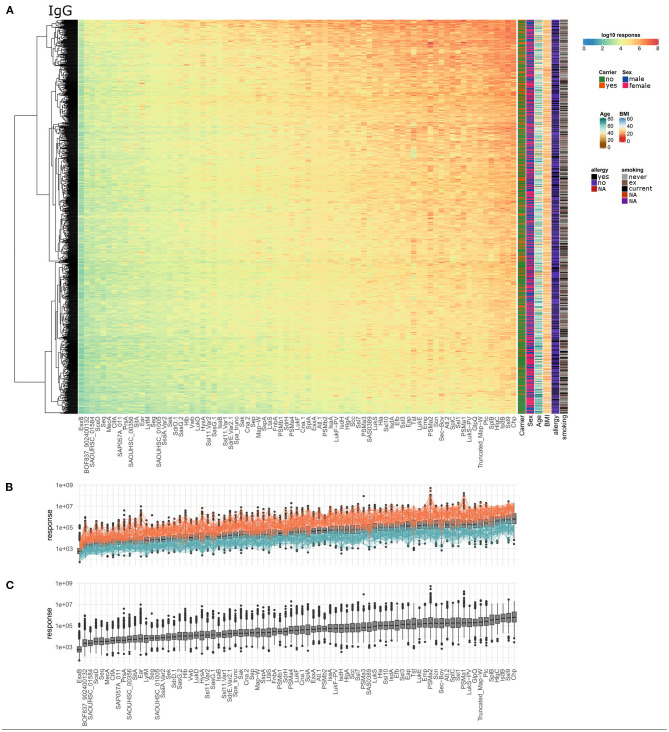
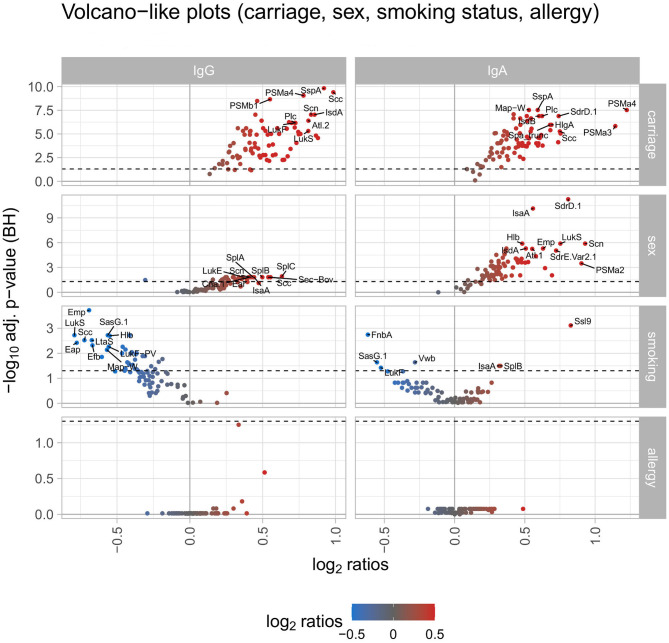
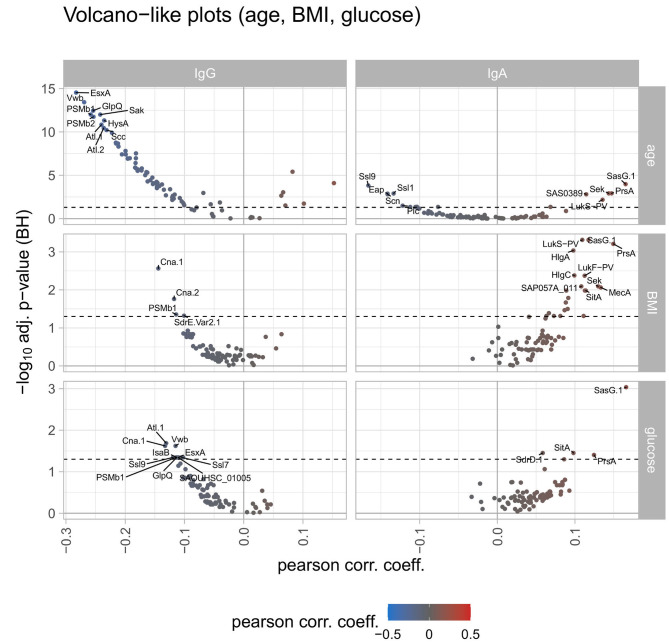
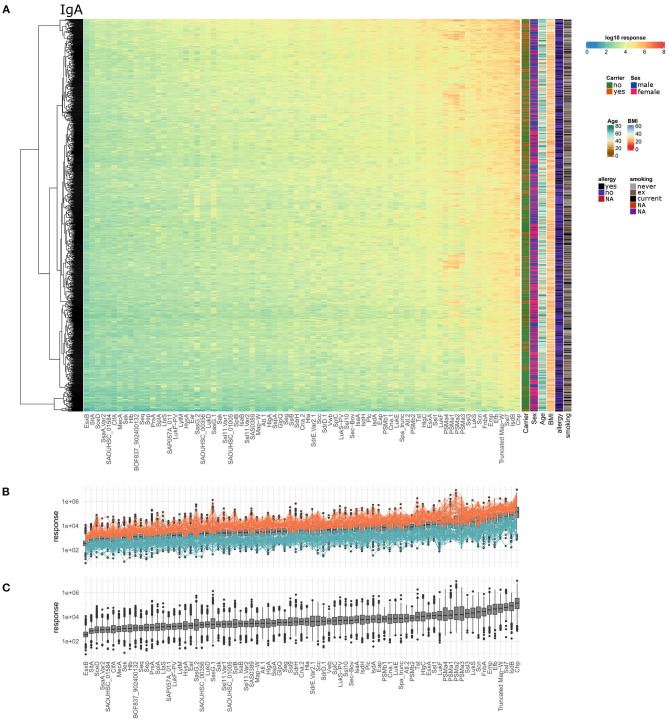
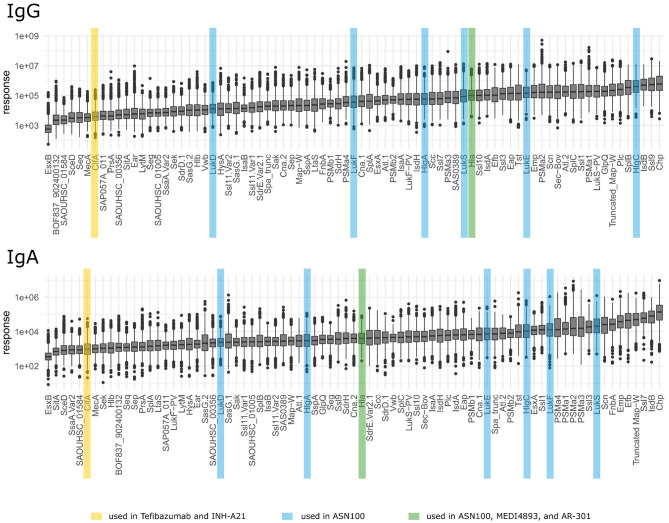
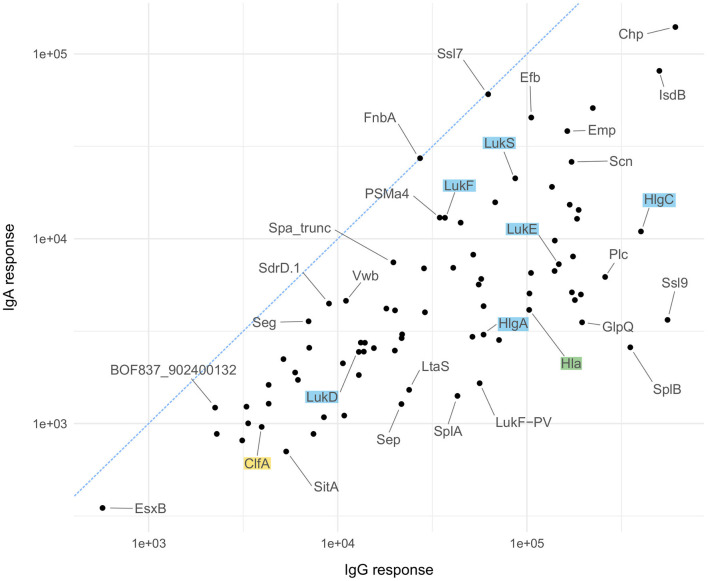
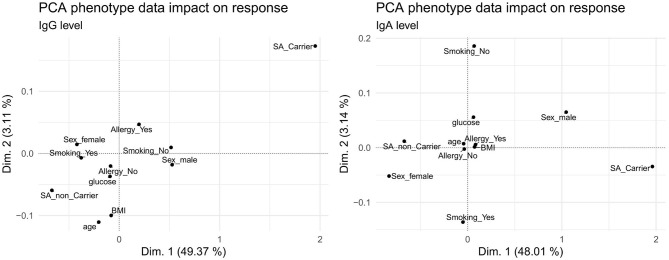
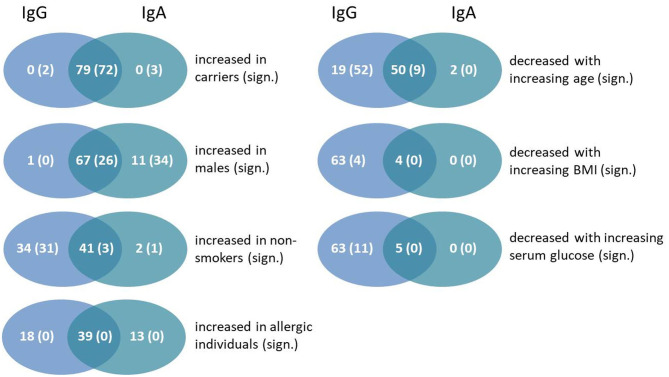
Our goal was to provide a comprehensive overview of the antibody response to Staphylococcus aureus antigens in the general population as a basis for defining disease-specific profiles and diagnostic signatures. We tested the specific IgG and IgA responses to 79 staphylococcal antigens in 996 individuals from the population-based Study of Health in Pomerania. Using a dilution-based multiplex suspension array, we extended the dynamic range of specific antibody detection to seven orders of magnitude, allowing the precise quantification of high and low abundant antibody specificities in the same sample. The observed IgG and IgA antibody responses were highly heterogeneous with differences between individuals as well as between bacterial antigens that spanned several orders of magnitude. Some antigens elicited significantly more IgG than IgA and vice versa. We confirmed a strong influence of colonization on the antibody response and quantified the influence of sex, smoking, age, body mass index, and serum glucose on anti-staphylococcal IgG and IgA. However, all host parameters tested explain only a small part of the extensive variability in individual response to the different antigens of S. aureus.

Keywords: S. aureus; anti-S. aureus IgA response; anti-S. aureus IgG response; antibody repertoire; host-pathogen-interaction; immunoproteomics.


Conflict of interest statement

The authors declare that the research was conducted in the absence of any commercial or financial relationships that could be construed as a potential conflict of interest.

Figures

Figure 1
Figure 1
Serum IgG titers against S. aureus are highly variable with very large differences among the 996 tested individuals and also among the 79 included staphylococcal antigens. (A) The calculated IgG response values of all 996 individuals (y-axis) were plotted against the 79 antigens (x-axis) on a log10-transformed scale. Phenotypic information on the individuals is presented in additional columns on the right of the heatmap including carriage status, sex, age, BMI, allergy, and smoking. (B) Overview of overall high (orange) and overall low (petrol) responders, the calculated response is plotted as boxplot as in (C). (C) Ranking of the antigens according to the median specific IgG levels.
Figure 2
Figure 2
Volcano-like plots displaying the association of response values of antigens with carriage, sex, smoking, and allergy. For the categorical variables S. aureus carriage (carrier/non-carrier), sex (male/female), smoking (current smoker/non-smoker), and allergy (allergy/no allergy) the ratio was calculated between the means of each antigen and the p-value was derived from the Wilcoxon signed rank test. The Benjamini-Hochberg-adjusted p-values are depicted on the y-axis against the log2-ratios on the x-axis. The left column shows differences for IgG, the right column for IgA. The log2 ratio of 0 (no difference between the groups) is indicated as a solid vertical line. The significance threshold of 0.05 is indicated as a dotted line. The top 10 antigens showing the strongest associations in each comparison are labeled with the respective antigen's name. The color code displays associations from negative (blue) to positive (red).
Figure 3
Figure 3
Volcano-like plots displaying the association of response values of antigens with age, BMI, and serum glucose. For the continuous variables age, BMI, and serum glucose levels a spline regression analysis was conducted followed by linear modeling to derive the Pearson correlation coefficient together with the p-value from the spline analysis. The Benjamini-Hochberg-adjusted p-values are depicted on the y-axis against the Pearson correlation coefficient on the x-axis. The left column shows differences for IgG, the right column for IgA. The log2 ratio of 0 (no difference between the groups) is indicated as a solid vertical line. The significance threshold of 0.05 is indicated as a dotted line. The top 10 antigens showing the strongest associations in each comparison are labeled with the respective antigen's name. The color code displays associations from negative (blue) to positive (red).
Figure 4
Figure 4
Serum IgA titers against S. aureus are highly variable with very large differences among the 996 tested individuals as well as the 79 included staphylococcal antigens. (A) The calculated IgA response values of all 996 individuals (y-axis) were plotted against the 79 antigens (x-axis) on a log10-transformed scale. Phenotypic information on the individuals was included in the additional columns on the right of the heatmap including carriage status, sex, age, BMI, allergy, and smoking. (B) Overview of overall high (orange) and overall low (petrol) responders, the calculated response is plotted as boxplot for all antigens and individuals, ordered with increasing median responses. (C) Ranking of the antigens according to IgA responses from all individuals.
Figure 5
Figure 5
Ranking of antigens for IgG and IgA. Antigens used in vaccination studies before are highlighted by colors depending on the vaccine as explained in the bottom legend.
Figure 6
Figure 6
Antigen-wise comparison of IgG and IgA results. Comparison of median antibody responses between IgG (x-axis) and IgA (y-axis) for all 79 antigens. Candidates used in vaccination studies are highlighted in the same color scheme as explained for Figure 5.
Figure 7
Figure 7
Principal component analysis of phenotype association with the overall IgG (left) and IgA (right) antibody response. In each panel, the first (x-axis) and second (y-axis) dimension are plotted against each other.
Figure 8
Figure 8
Venn diagrams showing the number and overlap of antigens showing an association of antibody responses values for IgG and IgA with particular phenotypes. The first number of each group gives the total amount of antigens with this characteristic, whereas the number in brackets includes only statistically significant numbers of antigens (Benjamini-Hochberg-adjusted p-value below 0.05).

References

    1. Gagliotti C, Balode A, Baquero F, Degener J, Grundmann H, Gür D, et al. . Escherichia coli and Staphylococcus aureus: bad news and good news from the European Antimicrobial Resistance Surveillance Network (EARS-Net, formerly EARSS), 2002 to (2009). Euro Surveillance. (2011) 16:19819. 10.2807/ese.16.11.19819-en - DOI - PubMed
    1. Chiller K, Selkin BA, Murakawa GJ. Skin microflora and bacterial infections of the skin. J Investig Dermatol Symp Proc. (2001) 6:170–4. 10.1046/j.0022-202x.2001.00043.x - DOI - PubMed
    1. Noskin GA, Rubin RJ, Schentag JJ, Kluytmans J, Hedblom EC, Jacobson C, et al. . National trends in Staphylococcus aureus infection rates: impact on economic burden and mortality over a 6-year period (1998-2003). Clin Infect Dis. (2007) 45:1132–40. 10.1086/522186 - DOI - PubMed
    1. Kluytmans J, van Belkum A, Verbrugh H. Nasal carriage of Staphylococcus aureus: epidemiology, underlying mechanisms, associated risks. Clin Microbiol Rev. (1997) 10:505–20. 10.1128/CMR.10.3.505 - DOI - PMC - PubMed
    1. van Belkum A, Verkaik NJ, de Vogel CP, Boelens HA, Verveer J, Nouwen JL, et al. . Reclassification of Staphylococcus aureus nasal carriage types. J Inf Dis. (2009) 199:1820–6. 10.1086/599119 - DOI - PubMed

Publication types

MeSH terms

LinkOut - more resources