Comparative Study
. 2021 Mar 11:12:655934.
doi: 10.3389/fimmu.2021.655934. eCollection 2021.

T Cell Activation, Highly Armed Cytotoxic Cells and a Shift in Monocytes CD300 Receptors Expression Is Characteristic of Patients With Severe COVID-19

Affiliations
Comparative Study

T Cell Activation, Highly Armed Cytotoxic Cells and a Shift in Monocytes CD300 Receptors Expression Is Characteristic of Patients With Severe COVID-19

Olatz Zenarruzabeitia et al. Front Immunol. .

Abstract

COVID-19 manifests with a wide diversity of clinical phenotypes characterized by dysfunctional and exaggerated host immune responses. Many results have been described on the status of the immune system of patients infected with SARS-CoV-2, but there are still aspects that have not been fully characterized or understood. In this study, we have analyzed a cohort of patients with mild, moderate and severe disease. We performed flow cytometric studies and correlated the data with the clinical characteristics and clinical laboratory values of the patients. Both conventional and unsupervised data analyses concluded that patients with severe disease are characterized, among others, by a higher state of activation in all T cell subsets (CD4, CD8, double negative and T follicular helper cells), higher expression of perforin and granzyme B in cytotoxic cells, expansion of adaptive NK cells and the accumulation of activated and immature dysfunctional monocytes which are identified by a low expression of HLA-DR and an intriguing shift in the expression pattern of CD300 receptors. More importantly, correlation analysis showed a strong association between the alterations in the immune cells and the clinical signs of severity. These results indicate that patients with severe COVID-19 have a broad perturbation of their immune system, and they will help to understand the immunopathogenesis of COVID-19.

Keywords: CD300a; CD300c; CD300e; COVID-19; NK cells; T cells; granzyme B; monocytes.


Conflict of interest statement

The authors declare that the research was conducted in the absence of any commercial or financial relationships that could be construed as a potential conflict of interest.

Figures
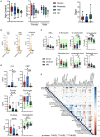
Figure 1
Figure 1
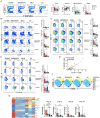
Clinical features of patients, quantification of leukocyte subsets and inflammation markers. (A) Left: age and gender distribution of patient cohorts in this study, including healthy controls (HC) and patients with mild (green), moderate (blue) and severe (red) COVID-19. Right: days from symptom onset to sample collection. (B) Plasma levels of IL-6, C reactive protein (CRP) and ferritin in HC and COVID-19 patients. The ranges of normal clinical laboratory values are represented in light green. (C) White blood cells (WBC) counts, leukocyte subsets frequencies and counts in patients with mild, moderate and severe COVID-19. The light green region represents the normal range for healthy people in the clinical laboratory. (D) Plasma levels of IL-6, CRP, ferritin, fibrinogen, D-dimer and hemoglobin in COVID-19 patients. Normal clinical laboratory values are represented in light green. (E) Correlogram showing Spearman correlation of the indicated clinical features for COVID-19 patients. Data in (A,C,D) are represented as boxplot graphs with the median and 25–75th percentiles, and the whiskers denote lowest and highest values. Each dot represents a donor. Significance was determined by the Kruskal-Wallis test followed by Dunn's multiple comparison test. *p < 0.05, **p < 0.01, and ***p < 0.001.
Figure 2
Figure 2
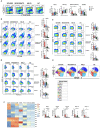
CD4 T cell subsets, activation status and perforin expression in COVID-19 patients. (A) Left: pseudocolor plots of concatenated peripheral CD4 T cells from healthy controls (HC) and patients with mild, moderate and severe disease. Four cell subsets were identified: naïve (CD27+CD45RA+), memory (CD27+CD45RA–), effector-memory (CD27–CD45RA–), and terminal differentiated effector-memory (TEMRA) (CD27–CD45RA+). Numbers in the quadrants are the average of each subset. Right: boxplot graphs representation of the data. (B) Pseudocolor plots of concatenated peripheral CD4 T cells from HC and COVID-19 patients and boxplot graphs of the frequencies of activated naïve, memory, effector-memory and TEMRA cells. Numbers in the quadrants are the average of each subset. Activated T cells are identified by the coexpression of CD38 and HLA-DR. (C) Pseudocolor plots of concatenated peripheral CD4 T cells and boxplot graphs showing the frequencies of PD-1+ naïve, memory, effector-memory and TEMRA cells. Numbers in the gates are the average of PD-1+ cells in each subset. (D) Spearman correlation of activated (CD38+HLA-DR+) with PD-1+ CD4 T cells from patients with mild, moderate and severe COVID-19. (E) Pseudocolor plots of concatenated peripheral CD4 T cells and boxplot graphs of the frequencies of perforin positive naïve, memory, effector-memory and TEMRA cells. Numbers in the gates are the average of perforin positive cells in each subset. (F) tSNE projection of non-naïve CD4 T cell populations (Pop) identified by FlowSOM clustering tool. (G) Fluorescence intensity of each Pop as indicated in the column-scaled z-score and boxplot graphs showing the frequencies of Pop0, Pop2, Pop6, and Pop10 in HC and COVID-19 patients. Boxplots show the median and 25–75th percentiles, and the whiskers denote lowest and highest values. Each dot represents a donor. Significance of data in (A–C,E,H) was determined by the Kruskal-Wallis test followed by Dunn's multiple comparison test. *p < 0.05, **p < 0.01, ***p < 0.001, and ****p < 0.0001.
Figure 3
Figure 3
CD8 T cell subsets, perforin expression and activated cells in COVID-19 patients. (A) Left: pseudocolor plots of concatenated peripheral CD8 T cells from healthy controls (HC) and patients with mild, moderate and severe COVID-19. Four cell subsets were identified: naïve (CD27+CD45RA+), memory (CD27+CD45RA–), effector-memory (CD27–CD45RA–), and terminal differentiated effector-memory (TEMRA) (CD27–CD45RA+). Numbers in the gates are the average of each subset. Right: boxplot graphs representation of the data. (B) Pseudocolor plots of concatenated peripheral CD8 T cells from HC and COVID-19 patients and boxplot graphs of the frequencies of activated naïve, memory, effector-memory and TEMRA cells. Numbers in the quadrants are the average of each subset. Activated T cells are identified by the coexpression of CD38 and HLA-DR. (C) Pseudocolor plots of concatenated peripheral CD8 T cells and boxplot graphs showing the frequencies of PD-1+ naïve, memory, effector-memory and TEMRA cells. Numbers in the gates are the average of PD-1+ cells in each subset. (D) Pseudocolor plots of concatenated peripheral CD8 T cells and boxplot graphs of the frequencies of perforin positive naïve, memory, effector-memory and TEMRA cells. Numbers in the gates are the average of perforin positive cells in each subset. (E) tSNE projection of non-naïve CD8 T cell populations (Pop) identified by FlowSOM clustering tool. (F) Fluorescence intensity of each Pop as indicated in the column-scaled z-score and boxplot graphs showing the frequencies of Pop7, Pop8, Pop9, Pop10, and Pop11 in HC and COVID-19 patients. Boxplots show the median and 25–75th percentiles, and the whiskers denote lowest and highest values. Each dot represents a donor. Significance of data in (A–D,G) was determined by the Kruskal-Wallis test followed by Dunn's multiple comparison test. *p < 0.05, **p < 0.01, ***p < 0.001, and ****p < 0.0001.
Figure 4
Figure 4
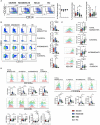
CD163, HLA-DR and CD300 receptors expression in monocytes from COVID-19 patients. (A) Pseudocolor plots of concatenated monocytes cells from healthy controls (HC) and patients and boxplot graphs of the frequencies of classical (CD14++CD16-), intermediate (CD14++CD16+), and non-classical (CD14+CD16++) monocyte subsets. Numbers in the gates are the average of each subset. (B) Pseudocolor plots of all concatenated monocytes and subsets and boxplot graphs showing the frequencies of CD163+ cells. Numbers in the gates are the average of CD163+ cells in each subset. (C) Histograms of concatenated monocytes and boxplot graphs showing the median fluorescence intensity (MFI) of HLA-DR in all and each monocyte subset. (D) Histograms of concatenated monocytes and boxplot graphs of the MFI of CD300a, CD300c, and CD300e in all and each monocyte subset. Boxplots show the median and 25–75th percentiles, and the whiskers denote lowest and highest values. Each dot represents a donor. Significance of data was determined by the Kruskal-Wallis test followed by Dunn's multiple comparison test. *p < 0.05, **p < 0.01, ***p < 0.001, and ****p < 0.0001.
Figure 5
Figure 5
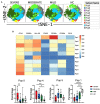
Unsupervised analysis of monocytes in COVID-19 patients. (A) tSNE projection of monocyte populations (Pop) identified by FlowSOM clustering tool. (B) Fluorescence intensity of each Pop as indicated in the column-scaled z-score and boxplot graphs showing the frequencies of Pop0, Pop1, Pop4, and Pop5 in healthy controls (HC) and COVID-19 patients. Boxplots show the median and 25–75th percentiles, and the whiskers denote lowest and highest values. Each dot represents a donor. Significance of data was determined by the Kruskal-Wallis test followed by Dunn's multiple comparison test. *p < 0.05, **p < 0.01, ***p < 0.001, and ****p < 0.0001.
Figure 6
Figure 6
Perforin and granzyme B expression in NK cell subsets from COVID-19 patients. (A) Pseudocolor plots of concatenated NK cells from healthy controls (HC) and patients and boxplot graphs of the frequencies of CD56bright (CD56++NKp80+), CD56dim (CD56+NKp80+) and CD56neg (CD56-NKp80+) NK cell subsets. (B) Histograms of concatenated CD56bright (left) and CD56dim (right) NK cells and boxplot graphs of the median fluorescence intensity (MFI) of perforin (upper) and granzyme B (lower). (C) Pseudocolor plots of concatenated CD56dim NK cells from HC and patients and boxplot graphs of the frequencies of the four subsets based in the expression of the CD57 and NKG2A differentiation markers. Numbers in the gates are the average of each subset. (D) tSNE projection of NK cells populations (Pop) identified by FlowSOM clustering. (E) Fluorescence intensity of each Pop as indicated in the column-scaled z-score and boxplot graphs showing the frequencies of Pop6, Pop7, Pop11, Pop14, and Pop15 in HC and COVID-19 patients. Boxplots show the median and 25–75th percentiles, and the whiskers denote lowest and highest values. Each dot represents a donor. Significance of data in (A–C) was determined by the Kruskal-Wallis test followed by Dunn's multiple comparison test. *p < 0.05, **p < 0.01, ***p < 0.001, and ****p < 0.0001.
Figure 7
Figure 7
Adaptive NK cells in COVID-19. (A) Pseudocolor plots of concatenated CD56dim NK cells from healthy controls (HC) and patients and boxplot graphs of the frequencies of NKG2C+, FcRγ-, and CD57+NKG2C+ NK cell subsets. Numbers in the gates are the average of each subset. Boxplots show the median and 25–75th percentiles, and the whiskers denote lowest and highest values. Each dot represents a donor. Significance of data was determined by the Kruskal-Wallis test followed by Dunn's multiple comparison test. *p < 0.05. (B) Pseudocolor plots of concatenated CD56dim NK cells from healthy controls (HC) and COVID-19 patients showing the expression of NKG2C and FcRγ. Numbers in the quadrants are the average of each subset. (C) Percentage of individuals from the indicated groups having or not having adaptive NK cell expansions. Significance of data was determined by chi-squared test. *p < 0.05, **p < 0.01, ***p < 0.001, and ****p < 0.0001. (D) tSNE projection of CD56dim NK cells populations (Pop) identified by FlowSOM clustering tool from CMV+ and CMV- donors. (E) Fluorescence intensity of each Pop as indicated in the column-scaled z-score and boxplot graphs showing the frequencies of Pop6 and Pop7 in CMV+ and CMV- HC and COVID-19 patients. Each dot represents a donor.
Figure 8
Figure 8
Multivariate analysis and correlation studies of immune cell phenotypes and clinical parameters. (A) Representation of the principal component analysis (PCA) results obtained with the most discriminant markers between patients groups. (B) Multinomial logistic regression model and statistical significance. Upper: Patients with mild disease vs. patients with moderate and severe disease. Lower: Patients with moderate disease vs. patients with mild and severe disease. Odd ratio (OR), 95% confidence interval (CI) and p-values are indicated. (C) Correlogram showing Spearman correlation of the indicated flow cytometry data and clinical features for COVID-19 patients. Only flow cytometry data that were statistically significant from the bivariate analysis (Supplementary Table 4) were considered for the analysis.

References

    1. Huang C, Wang Y, Li X, Ren L, Zhao J, Hu Y, et al. . Clinical features of patients infected with 2019 novel coronavirus in Wuhan, China. Lancet. (2020) 395:497–506. 10.1016/S0140-6736(20)30183-5 - DOI - PMC - PubMed
    1. Zhou F, Yu T, Du R, Fan G, Liu Y, Liu Z, et al. . Clinical course and risk factors for mortality of adult inpatients with COVID-19 in Wuhan, China: a retrospective cohort study. Lancet. (2020) 395:1054–62. 10.1016/S0140-6736(20)30566-3 - DOI - PMC - PubMed
    1. Klok FA, Kruip MJHA, van der Meer NJM, Arbous MS, Gommers DAMPJ, Kant KM, et al. . Incidence of thrombotic complications in critically ill ICU patients with COVID-19. Thromb Res. (2020) 191:145–7. 10.1016/j.thromres.2020.04.013 - DOI - PMC - PubMed
    1. Lodigiani C, Iapichino G, Carenzo L, Cecconi M, Ferrazzi P, Sebastian T, et al. . Venous and arterial thromboembolic complications in COVID-19 patients admitted to an academic hospital in Milan, Italy. Thromb Res. (2020) 191:9–14. 10.1016/j.thromres.2020.04.024 - DOI - PMC - PubMed
    1. Tang N, Li D, Wang X, Sun Z. Abnormal coagulation parameters are associated with poor prognosis in patients with novel coronavirus pneumonia. J Thromb Haemost. (2020) 18:844–7. 10.1111/jth.14768 - DOI - PMC - PubMed

Publication types

MeSH terms

Substances