. 2021 Mar 11:11:567762.
doi: 10.3389/fonc.2021.567762. eCollection 2021.

Association Between NAT2 Polymorphism and Lung Cancer Risk: A Systematic Review and Meta-Analysis

Affiliations

Association Between NAT2 Polymorphism and Lung Cancer Risk: A Systematic Review and Meta-Analysis

Ke Zhu et al. Front Oncol. .

Abstract

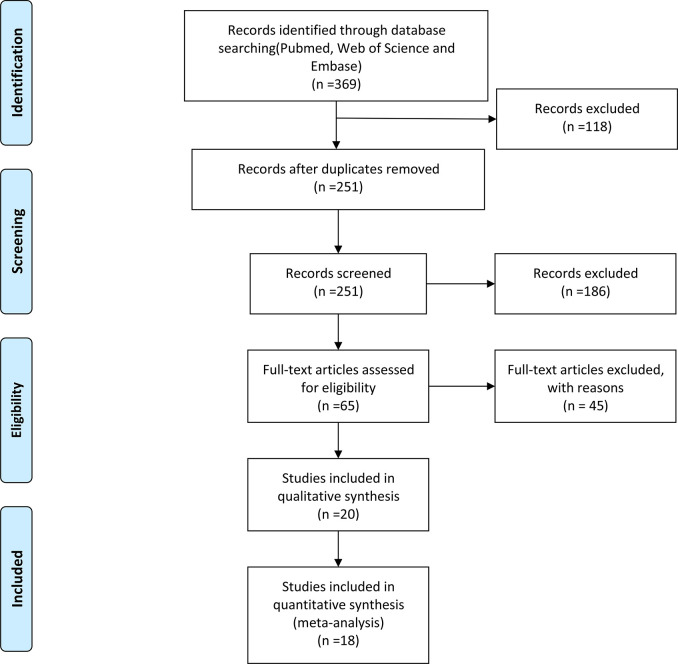
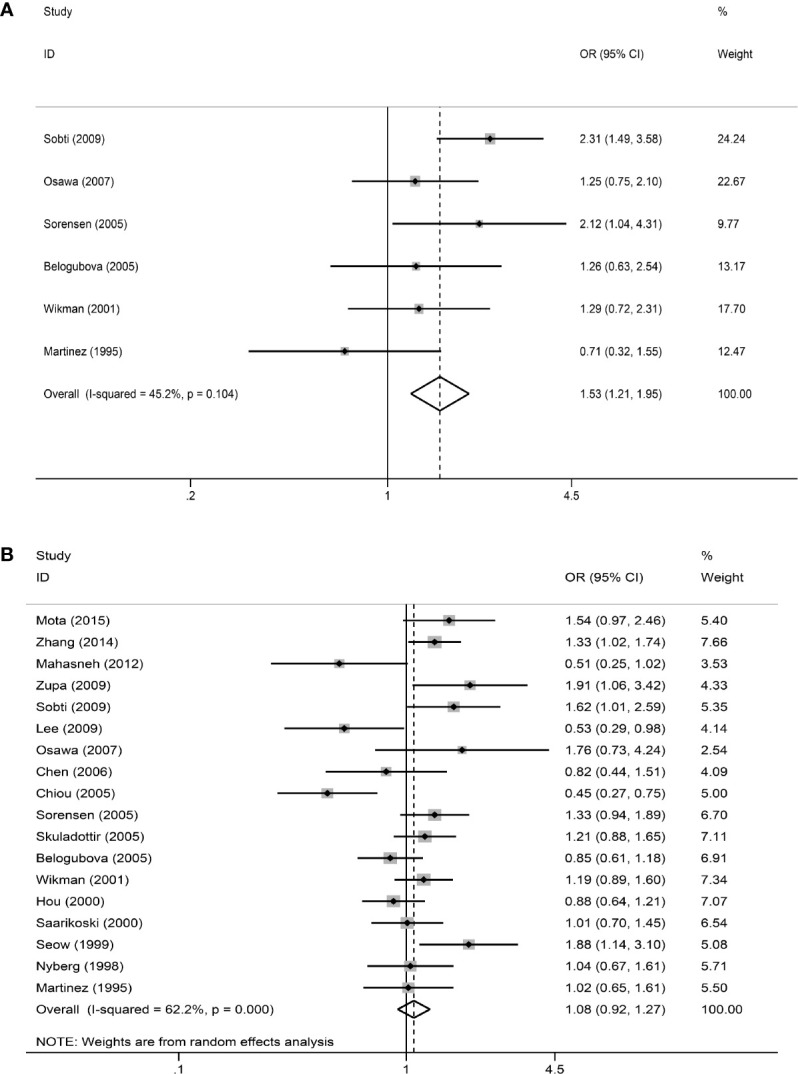
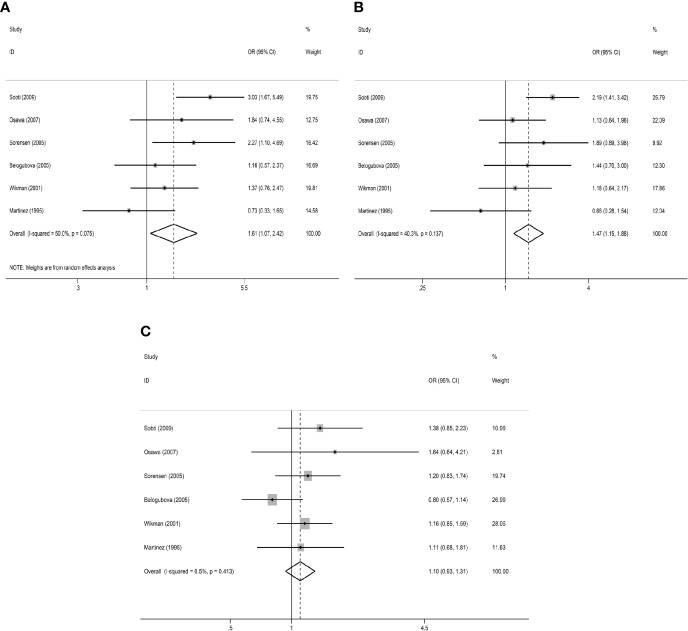
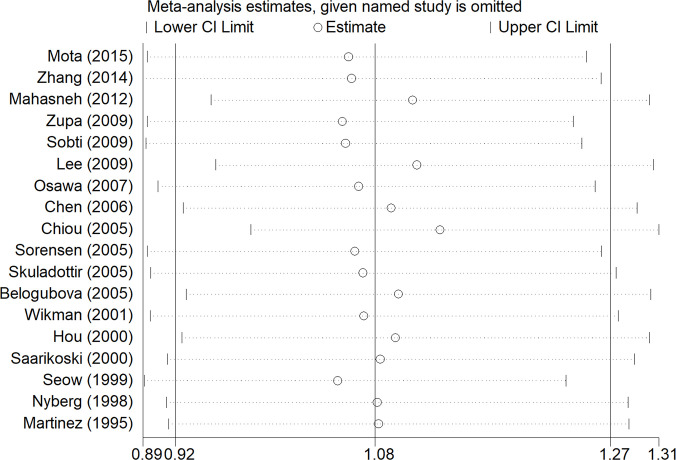
Lung cancer is the leading cause of cancer-related death worldwide and has a high incidence rate. N-Acetyltransferase 2 (NAT2) is a polymorphic xenobiotic enzyme, which can catalyze N-acetylation and O-acetylation of various carcinogens such as aromatic, heterocyclic amines and hydrazines. At present, many studies have explored the effects of NAT2 polymorphism on lung cancer, but we found inconsistent results. We researched 18 published studies, involving 4,016 patients and 5,469 controls, to more accurately assess the effects of NAT2 polymorphism on lung cancer risk and to investigate whether smoking is associated. We used STATA software to analyze the extracted data and used STATA for subgroup analysis, sensitivity analysis, and to perform publication bias tests. To determine the correlation, we used the crude odds ratio (ORs) with 95% confidence interval (CIs). Our study was prospectively registered in PROSPERO (CRD42020159737). The odds ratio was 1.53 (95% CI: 1.21-1.95, I² = 45.2%, P=0.104) for the NAT2 slow + intermediate phenotype versus rapid phenotype. The results suggested that people with NAT2 non-rapid (slow + intermediate) phenotype have a significantly increased risk of lung cancer. In addition, NAT2 rapid phenotype was significantly associated with reduced risk of lung cancer, compared with slow phenotype or intermediate phenotype (slow phenotype vs . rapid phenotype: OR: 1.61, 95% CI: 1.07-2.42, I²= 50%, P= 0.075; intermediate phenotype vs . rapid phenotype: OR: 1.47, 95% CI: 1.15-1.88, I²= 40.3%, P= 0.137).

Keywords: NAT2; genetic polymorphism; lung cancer; phenotype; systematic review.


Conflict of interest statement

The authors declare that the research was conducted in the absence of any commercial or financial relationships that could be construed as a potential conflict of interest. The reviewer SF declared a shared affiliation, with no collaboration, with several of the authors, KZ, BZ, HJ, RW, to the handling editor at the time of review.

Figures

Figure 1
Figure 1
The study selection process of this meta-analysis.
Figure 2
Figure 2
The meta-analysis results. (A) Meta-analysis for the association between NAT2 polymorphism and lung cancer risk (slow + intermediate versus rapid). OR is represented as a square and its 95% CI estimate is represented as two horizontal lines. The weight has reflected the area of the square (inverse variance). The diamond represents the combined results of all the studies. (B) Meta-analysis for the association between NAT2 polymorphism and lung cancer risk (slow versus intermediate + rapid).
Figure 3
Figure 3
Results of comparison of three NAT2 acetylator statuses. (A) Meta-analysis for the association between NAT2 polymorphism and lung cancer risk (slow versus rapid). (B) Meta-analysis for the association between NAT2 polymorphism and lung cancer risk (intermediate versus rapid). (C) Meta-analysis for the association between NAT2 polymorphism and lung cancer risk (slow versus intermediate).
Figure 4
Figure 4
Results of the sensitivity analysis. The middle vertical line represents the combined OR value of 18 studies, and the left and right vertical lines represent the 95% CI. Each dashed line perpendicular to the vertical line represents the results of combined studies after excluding corresponding studies; the circle represents the OR value of combined studies, and the left and right boundaries represent the 95% CI.
Figure 5
Figure 5
Begg’s funnel plots and Egger’s tests for publication bias in the selection of studies. (A) Begg’s Test of the primary model. (B) Egger’s test of the primary model. (C) Begg’s Test of the recessive model. (D) Egger’s test of the recessive model.

Similar articles

Cited by

References

    1. Bray F, Ferlay J, Soerjomataram I, Siegel RL, Torre LA, Jemal A. Global Cancer Statistics 2018: GLOBOCAN Estimates of Incidence and Mortality Worldwide for 36 Cancers in 185 Countries. CA: A Cancer J Clin (2018) 68(6):394–424. 10.3322/caac.21492 - DOI - PubMed
    1. Torre LA, Siegel RL, Jemal A. Lung cancer statistics. Adv Exp Med Biol (2016) 893(1):1–19. 10.1007/978-3-319-24223-1_1 - DOI - PubMed
    1. Alberg AJ, Brock MV, Ford JG, Samet JM, Spivack SD. Epidemiology of lung cancer: diagnosis and management of lung cancer, 3rd ed: American College of Chest Physicians evidence-based clinical practice guidelines. Chest (2013) 143(1):e1S–29S. 10.1378/chest.12-2345 - DOI - PMC - PubMed
    1. Chen G, Hu C, Lai P, Song Y, Xiu M, Zhang H, et al. . Association between TGF-beta1 rs1982073/rs1800469 polymorphism and lung cancer susceptibility: An updated meta-analysis involving 7698 cases and controls. Med (Baltimore) (2019) 98(47):e18028. 10.1097/MD.0000000000018028 - DOI - PMC - PubMed
    1. Thorgeirsson TE, Geller F, Sulem P, Rafnar T, Wiste A, Magnusson KP, et al. . A variant associated with nicotine dependence, lung cancer and peripheral arterial disease. Nature (2008) 452(1):638–42. 10.1038/nature06846 - DOI - PMC - PubMed

Publication types

LinkOut - more resources