. 2021 Mar 11:11:582040.
doi: 10.3389/fonc.2021.582040. eCollection 2021.

The Effects of Autophagy-Related Genes and lncRNAs in Therapy and Prognosis of Colorectal Cancer

Affiliations

The Effects of Autophagy-Related Genes and lncRNAs in Therapy and Prognosis of Colorectal Cancer

Yang Yang et al. Front Oncol. .

Abstract

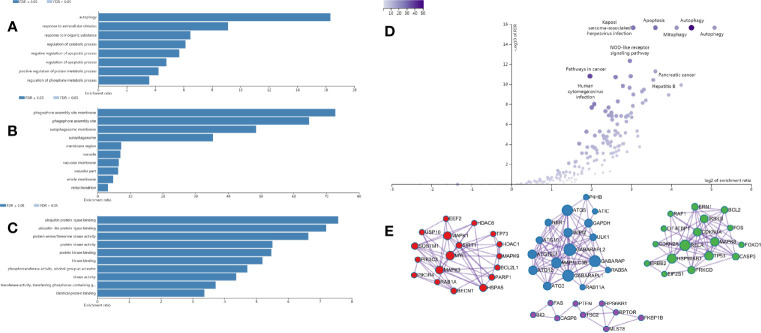
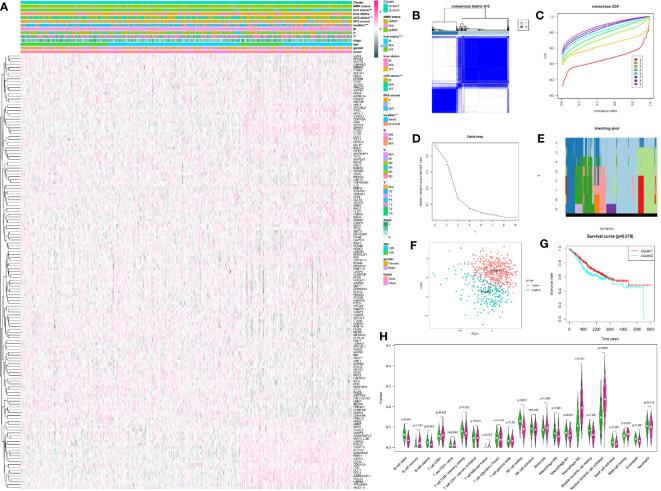
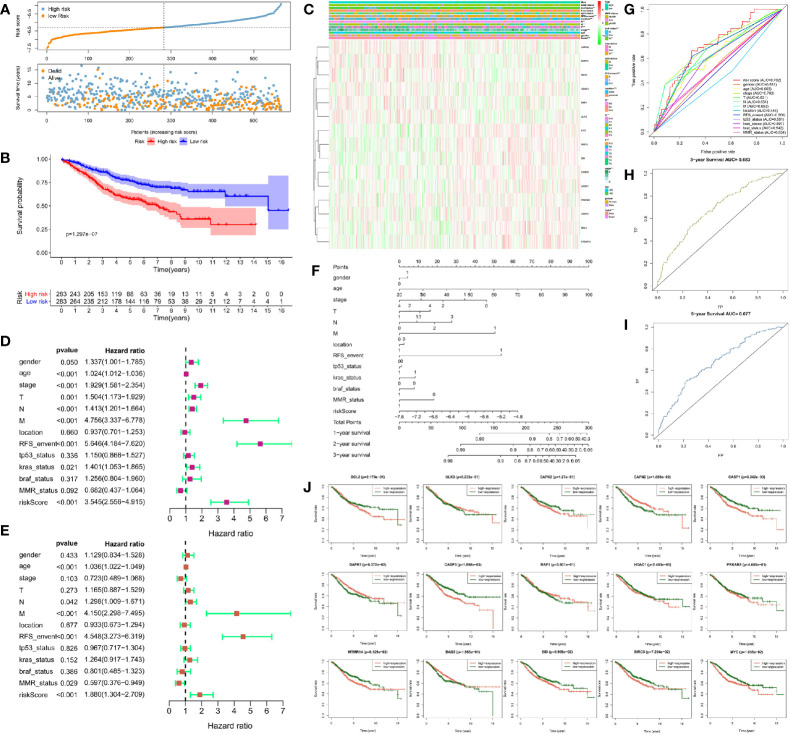
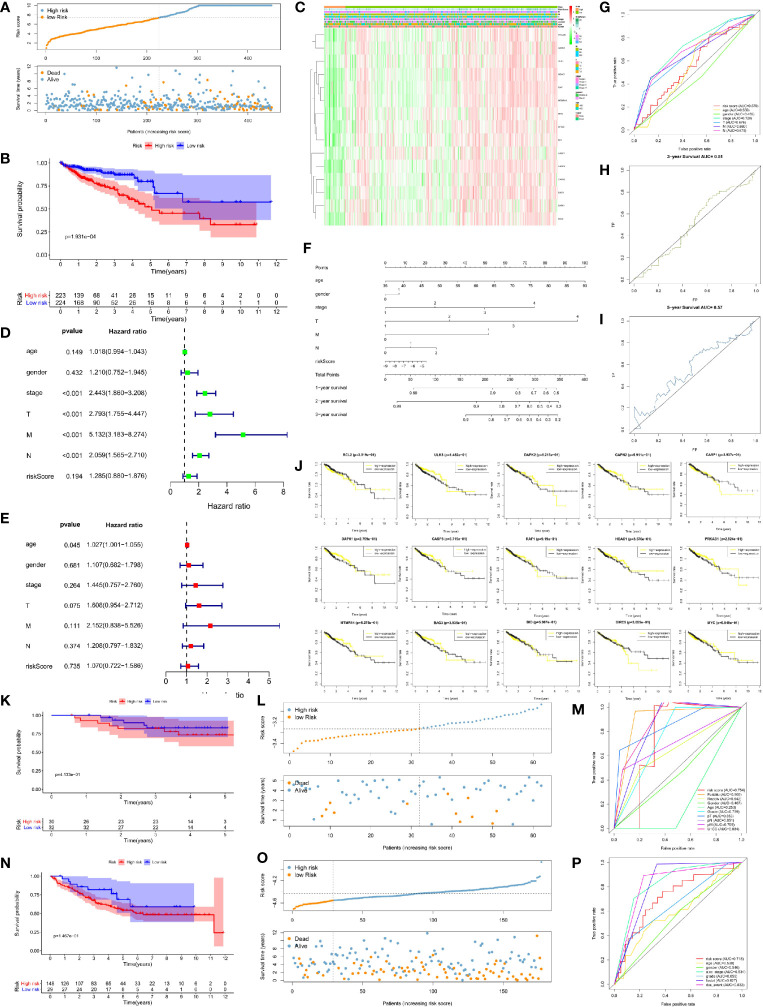
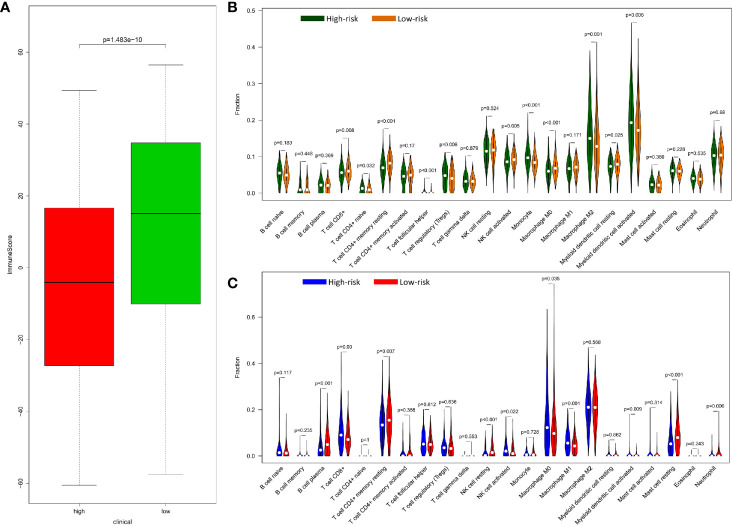
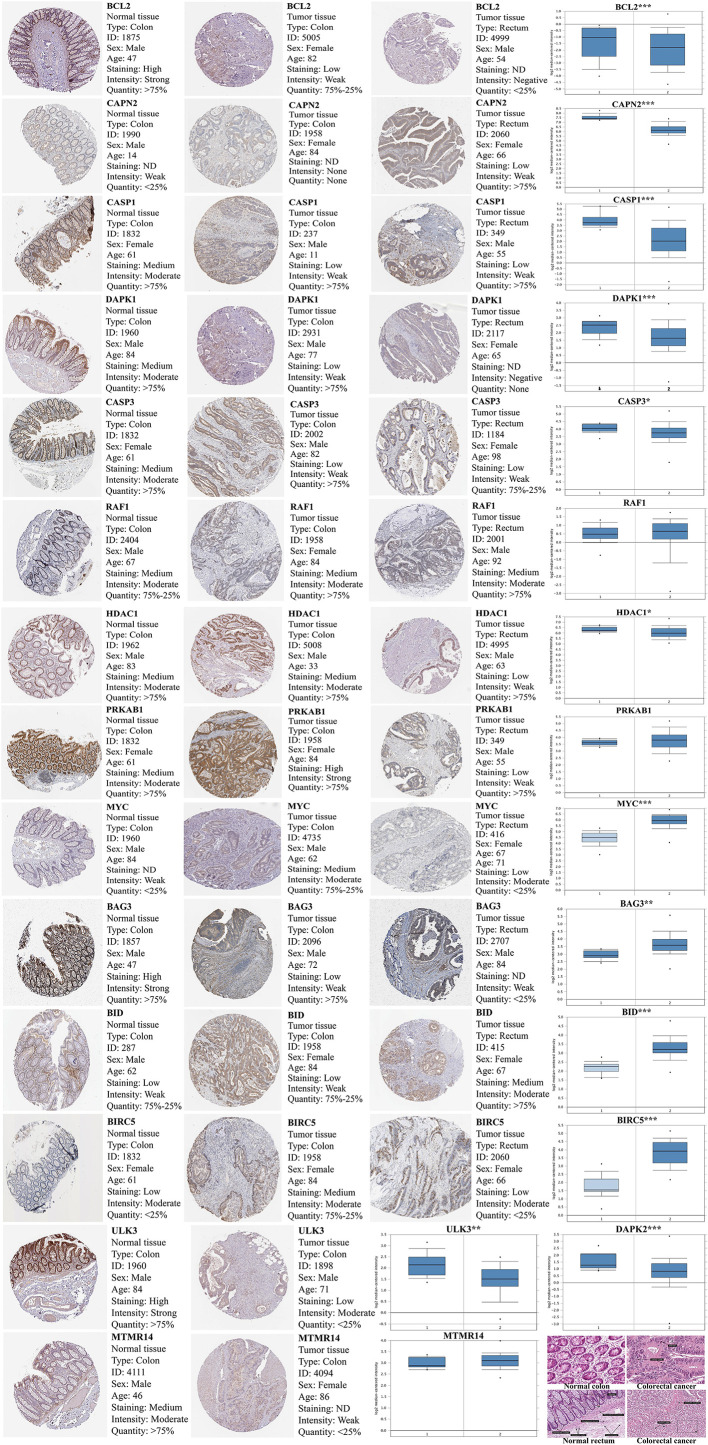
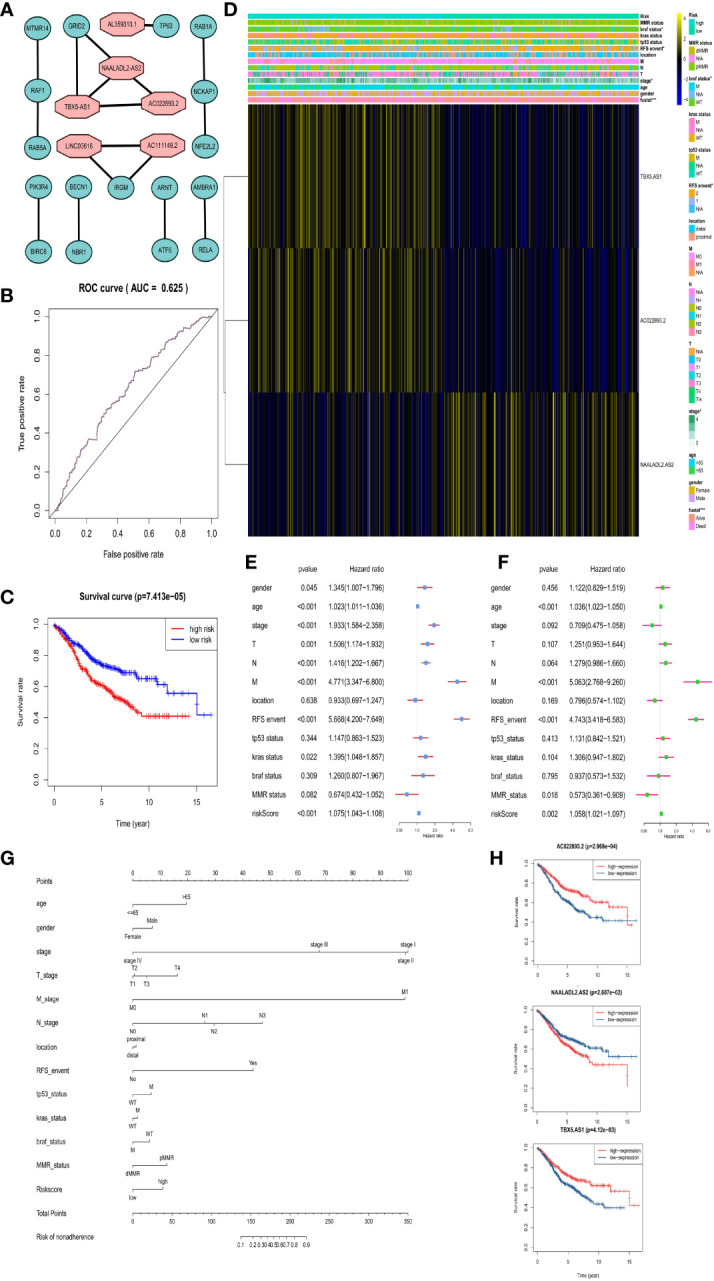
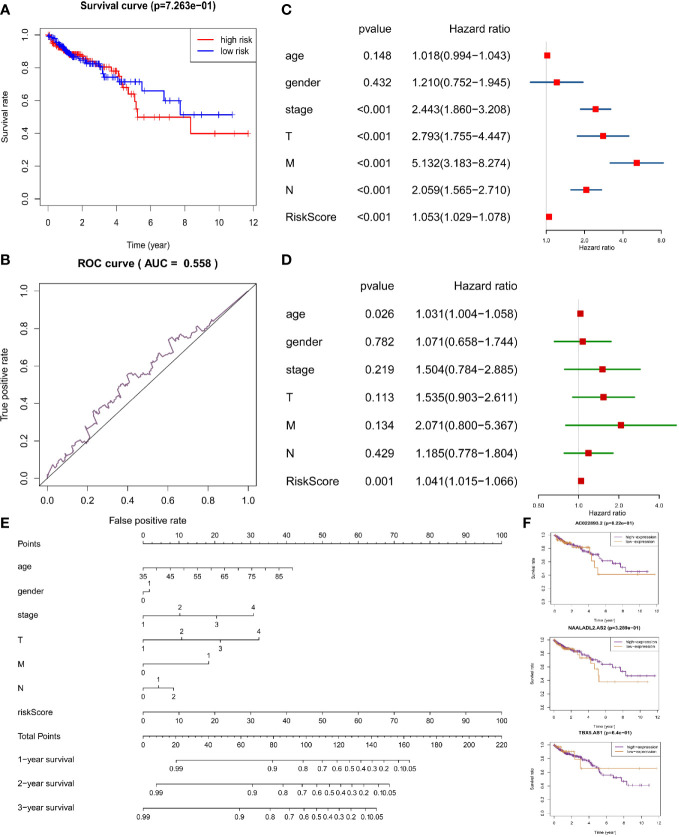
Cellular autophagy plays an important role in the occurrence and development of colorectal cancer (CRC). Whether autophagy-related genes and lncRNAs can be used as ideal markers in CRC is still controversial. The purpose of this study is to identify novel treatment and prognosis markers of CRC. We downloaded transcription and clinical data of CRC from the GEO (GSE40967, GSE12954, GSE17536) and TCGA database, screened for differentially autophagy-related genes (DEAGs) and lncRNAs, constructed prognostic model, and analyzed its relationship with immune infiltration. TCGA and GEO datasets (GSE12954 and GSE17536) were used to validate the effect of the model. Oncomine database and Human Protein Atlas verified the expression of DEAGs. We obtained a total of 151 DEAGs in three verification sets collaboratively. Then we constructed a risk prognostic model through Lasso regression to obtain 15 prognostic DEAGs from the training set and verified the risk prognostic model in three verification sets. The low-risk group survived longer than the high-risk group. Age, gender, pathological stage, and TNM stage were related to the prognostic risk of CRC. On the other hand, BRAF status, RFS event, and tumor location are considered as most significant risk factors of CRC in the training set. Furthermore, we found that the immune score of the low-risk group was higher. The content of CD8 + T cells, active NK cells, macrophages M0, macrophages M1, and active dendritic cells was noted more in the high-risk group. The content of plasma cells, resting memory CD4 + T cells, resting NK cells, resting mast cells, and neutrophil cells was higher in the low-risk group. After all, the Oncomine database and immunohistochemistry verified that the expression level of most key autophagy-related genes was consistent with the results that we found. In addition, we obtained six lncRNAs co-expressed with DEAGs from the training set and found that the survival time was longer in the low-risk group. This finding was verified in the verification set and showed same trend to the results mentioned above. In the final analysis, these results indicate that autophagy-related genes and lncRNAs can be used as prognostic and therapeutic markers for CRC.

Keywords: autophagy; colorectal cancer; gene; immune; lncRNA; prognosis.


Conflict of interest statement

The authors declare that the research was conducted in the absence of any commercial or financial relationships that could be construed as a potential conflict of interest.

Figures

Figure 1
Figure 1
Enrichment analysis results of DEAGs in CRC from the WebGestalt website. (A) The biological process of GO analysis in CRC. (B) The cellular component of GO analysis in CRC. (C) The molecular function of GO analysis in CRC. (D) The signaling pathway of KEGG analysis in CRC. (E) The protein-protein interaction network of DEAGs in CRC.
Figure 2
Figure 2
Unsupervised cluster analysis of CRC by R package “ConsensusClusterPlus.” (A) The expression of DEAGs in GEO database and clinical characteristics in two clusters by R package “pheatmap.” (B) Consensus matrix of unsupervised cluster analysis (k = 2). (C) Consensus CDF curve of unsupervised cluster analysis. (D) Delta area under CDF curve of unsupervised cluster analysis. (E) Tracking plot of unsupervised cluster analysis. (F) Principal component analysis of unsupervised cluster analysis. (G) Survival curve of two main clusters. (H) 22 types of immune cells infiltration in the two clusters. Green showed cluster1 and red showed cluster2. *P < 0.05, **P < 0.01, ***P < 0.001, and ****P < 0.0001.
Figure 3
Figure 3
Risk prognosis model construction of 15 prognostic risk-related DEAGs in GEO data by unicox and Lasso regression. (A) The distribution of risk score and the scatterplot of the relationship between risk scores and survival time by R package “ggplot.” (B) Survival curve comparing high-risk and low-risk groups by R package “survival.” (C) Heat map of prognostic DEAGs and clinical parameters at high-risk and low-risk groups by R package “pheatmap.” (D) The univariate cox forest map of 13 clinical characteristics in the training set by R package “survival” and “forestplot.” (E) The multivariate cox forest plot of 13 clinical characteristics in the training set by R package “survival” and “forestplot.” (F) The nomogram baseline of multivariate cox analysis by R package “rms.” (G) ROC curve of risk sore and other clinical characteristics by R package “survivalROC.” (H) ROC curve of 3-year survival. (I) ROC curve of 5-year survival by R package “survivalROC.” (J) The survival curve of 15 prognostic risk-related DEAGs expression by R package “survival.” *P < 0.05, **P < 0.01, ***P < 0.001, and ****P < 0.0001.
Figure 4
Figure 4
Risk prognosis model verification of 15 prognostic risk-related DEAGs in validation sets with the formula of risk model. (A) The distribution of risk score and the scatterplot of the relationship between risk scores and survival time in TCGA data by R package “ggplot.” (B) Survival curve comparing high-risk and low-risk groups in TCGA data by R package “survival.” (C) Heat map of prognostic DEAGs and clinical parameters at high-risk and low-risk groups in TCGA data by R package “pheatmap.” (D) The univariate cox forest map of clinical characteristics in TCGA data by R package “survival” and “forestplot.” (E) The multivariate cox forest plot of clinical characteristics in TCGA data by R package “survival” and “forestplot.” (F) The nomogram baseline of multivariate cox analysis in TCGA data by R package “rms.” (G) ROC curve of risk sore and other clinical characteristics in TCGA data by R package “survivalROC.” (H) ROC curve of 3-year survival in TCGA data. (I) ROC curve of 5-year survival in TCGA data by R package “survivalROC.” (J) The survival curve of 15 prognostic risk-related DEAGs expression in TCGA data by R package “survival.” (K) Survival curve comparing high-risk and low-risk groups in GSE12954 set by R package “survival.” (L) The distribution of risk score and the scatterplot of the relationship between risk scores and survival time in GSE12954 set by R package “ggplot.” (M) ROC curve of risk sore and other clinical characteristics in GSE12954 set by R package “survivalROC.” (N) Survival curve comparing high-risk and low-risk groups in GSE17536 set by R package “survival.” (O) The distribution of risk score and the scatterplot of the relationship between risk scores and survival time in GSE12954 set by R package “ggplot.” (P) ROC curve of risk sore and other clinical characteristics in GSE17536 set by R package “survivalROC.” *P < 0.05, **P < 0.01, ***P < 0.001, and ****P < 0.0001.
Figure 5
Figure 5
Relationship of between immune and prognostic risk in CRC. (A) Immune microenvironment score of high-risk and low-risk group in GEO data with wilcox.test. (B) 22 types of immune cells infiltration of high risk and low risk group in GEO data by R package “e1071”, “parallel”, and “preprocessCore”. (C) 22 types of immune cells infiltration of high-risk and low-risk group in TCGA data by R package “e1071”, “parallel”, and “preprocessCore”.
Figure 6
Figure 6
The expression of 15 prognosis-related DEAGs in Oncomine database (https://www.oncomine.org/resource/main.html) and Human Protein Atlas database (https://www.proteinatlas.org/). The blue box plot was a visualization of gene expression from Oncomine database. (“1” represented normal tissue and “2” represented tumor tissue.) The results of immunohistochemistry and HE staining were obtained from the HPA database. *P < 0.05, **P < 0.01, ***P < 0.001, and ****P < 0.0001.
Figure 7
Figure 7
Risk prognosis model construction of three prognostic risk-related DAR-lncRNAs in GEO data. (A) Co-expression network diagram of DAR-lncRNAs and DEAGs in the Cytoscape. (B) ROC curve of risk prognosis model in the training set by R package “survivalROC”. (C) Survival curve comparing high-risk and low-risk groups by R package “survival”. (D) Heat map of prognostic DAR-lncRNAs and clinical parameters at high-risk and low-risk groups by R package “pheatmap”. (E) The univariate cox forest map of clinical characteristics in the training set by R package “survival” and “forestplot”. (F) The multivariate cox forest plot of clinical characteristics in the training set by R package “survival” and “forestplot”. (G) The nomogram baseline of multivariate cox analysis by R package “rms”. (H) The survival curve of three prognostic risk-related DAR-lncRNAs by R package “survival”. *P < 0.05, **P < 0.01, ***P < 0.001, and ****P < 0.0001.
Figure 8
Figure 8
Risk prognosis model verification of three prognostic risk-related DAR-lncRNAs in TCGA data. (A) Survival curve comparing high-risk and low-risk groups by R package “survival”. (B) ROC curve of risk prognosis model in the verification set by R package “survivalROC”. (C) The univariate cox forest map of clinical characteristics in the verification set by R package “survival” and “forestplot”. (D) The multivariate cox forest plot of clinical characteristics in the verification set by R package “survival” and “forestplot”. (E) The nomogram baseline of multivariate cox analysis by R package “rms”. (F) The survival curve of three prognostic risk-related DAR-lncRNAs by R package “survival”.

Similar articles

Cited by

References

    1. Qaderi SM, Swartjes H, Custers JAE, Wilt JHW. Health care provider and patient preparedness for alternative colorectal cancer follow-up; a review. Eur J Surg Oncol (2020) 20:S0748. 10.1016/j.ejso.2020.06.017 - DOI - PubMed
    1. Dekker E, Tanis PJ, Vleugels JLA, Kasi PM, Wallace MB. Colorectal cancer. Lancet (2019) 394:1467–80. 10.1016/S0140-6736(19)32319-0 - DOI - PubMed
    1. Brody H. Colorectal cancer. Nature (2015) 521:S1. 10.1038/521S1a - DOI - PubMed
    1. Mokarram P, Albokashy M, Zarghooni M, Moosavi MA, Sepehri Z, Chen QM, et al. . New frontiers in the treatment of colorectal cancer: Autophagy and the unfolded protein response as promising targets. Autophagy (2017) 13:781–819. 10.1080/15548627.2017.1290751 - DOI - PMC - PubMed
    1. Levy JMM, Towers CG, Thorburn A. Targeting autophagy in cancer. Nat Rev Cancer (2017) 17:528–42. 10.1038/nrc.2017.53 - DOI - PMC - PubMed