Review
. 2021 Mar 12:11:630482.
doi: 10.3389/fonc.2021.630482. eCollection 2021.

Aberrations of Genomic Imprinting in Glioblastoma Formation

Affiliations
Review

Aberrations of Genomic Imprinting in Glioblastoma Formation

Anna Lozano-Ureña et al. Front Oncol. .

Abstract

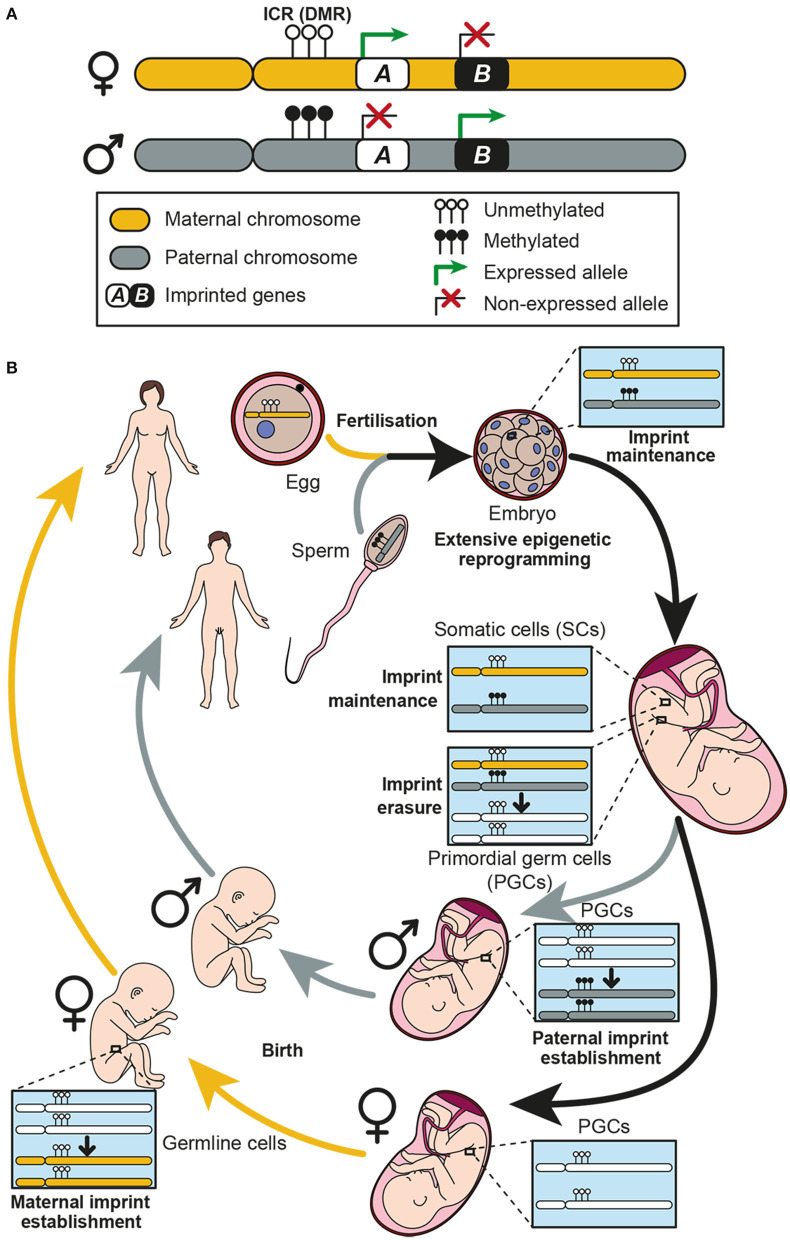
In human glioblastoma (GBM), the presence of a small population of cells with stem cell characteristics, the glioma stem cells (GSCs), has been described. These cells have GBM potential and are responsible for the origin of the tumors. However, whether GSCs originate from normal neural stem cells (NSCs) as a consequence of genetic and epigenetic changes and/or dedifferentiation from somatic cells remains to be investigated. Genomic imprinting is an epigenetic marking process that causes genes to be expressed depending on their parental origin. The dysregulation of the imprinting pattern or the loss of genomic imprinting (LOI) have been described in different tumors including GBM, being one of the earliest and most common events that occurs in human cancers. Here we have gathered the current knowledge of the role of imprinted genes in normal NSCs function and how the imprinting process is altered in human GBM. We also review the changes at particular imprinted loci that might be involved in the development of the tumor. Understanding the mechanistic similarities in the regulation of genomic imprinting between normal NSCs and GBM cells will be helpful to identify molecular players that might be involved in the development of human GBM.

Keywords: genomic imprinting; glioblastoma; methylation; neural stem cells; subventricular zone.


Conflict of interest statement

The authors declare that the research was conducted in the absence of any commercial or financial relationships that could be construed as a potential conflict of interest.

Figures

Figure 1
Figure 1
Genomic imprinting and the establishment of imprints in the germline. (A) Two homolog chromosomes are represented, each one inherited from one progenitor: maternal chromosome in yellow and paternal chromosome in gray. An imprinting cluster containing two imprinted genes (genes A and B) is represented. Gene A is maternally expressed, while gene B is paternally expressed. Expression of both genes is controlled by methylation at the imprinting control region (ICR) which is a differentially methylated region (DMR) between the two chromosomes. (B) Genomic imprinting life cycle is represented. When fertilization occurs, the zygote receives a maternal and a paternal copy of the genome, each one imprinted accordingly. Methylation patterns of each chromosome must be kept in somatic cells, thus imprints are protected against the extensive genome demethylation that occurs after fertilization. Imprints are maintained along the individual life in somatic cells, while they are erased in primordial germ cells (PGCs) during development. Afterwards, a new imprint is established in the germline according to the individual chromosomal sex. These imprints are established during development in males and postnatally in females.
Figure 2
Figure 2
Expression of imprinted genes is altered in human GBM. (A) Pie chart representing average percentages of upregulated (red) and downregulated (blue) genes in GBM when compared with non-tumor (NT) samples and obtained with different human GlioVis datasets. Non-significant gene expression is also included (yellow). The average percentages of genes which data are not available are shown in black (UN, left panel). Venn diagrams represent imprinted genes which are upregulated or downregulated in GBM when compared with NT samples. Each dataset used is represented (right panel). Intersection of all sets shows genes which expression pattern is coincident in every analyzed dataset. Maternally expressed genes are indicated in yellow whereas paternally expressed genes are indicated in gray. Genes with unknown specific-parental expression are in black. (B) Pie chart representing average percentages of imprinted genes which are upregulated (red) or downregulated (blue) in low grade glioma (LGG) compared to NT samples (left panel). Venn diagrams representing imprinted genes which are differentially expressed between LGG and NT samples (right panel). Intersection of all sets represents genes which expression pattern is coincident in every analyzed dataset. (C) Pie charts representing average percentages of imprinted genes which are upregulated (red) or downregulated (blue) in GBM compared to LGG samples and in IDHwt compared to IDHmut LGG samples. Venn diagrams representing imprinted genes which are differentially expressed between GBM and LGG samples (right panel). Intersection of all sets represents genes which expression pattern is coincident in every analyzed dataset. GlioVis datasets used are Bao, CGGA, Gill, TCGA_GBM, TCGA_GBMLGG, Rembrandt, Gravendeel and Kamoun.
Figure 3
Figure 3
NSCs share imprinting gene expression profile with GBM cells. (A) Pie chart representing average percentages of upregulated (red) and downregulated (blue) imprinted genes in GBM when compared with oligodendrocytes (left panel) or NSCs (right panel). Percentage of imprinted genes that do not change their expression levels is also included (yellow). A statistical analysis was performed to determine the changes in the percentage of downregulated, upregulated or unchanged genes in NSCs and oligodendrocytes when compared to GBM. Mean percentage and s.e.m are indicated. P-values: ***p < 0.001. (B) tSNE dimensional reduction plot of single-cell RNAseq data from Neftel et al. (88) (downloaded from GSE131928) showing that the four GBM cell state subtypes and the three non-malignant cell types form discrete clusters based on the expression of 222 imprinted genes. AC-like (astrocytic-like), MES-like (mesenchymal-like), NPC-like (neural progenitor-like) and OPC-like (oligodendroglial progenitor-like). Non-tumoural cells: oligodendrocytes, macrophages and T-cells. Assignment of cell state names to individual GBM cells was based on the reanalysis of the two-dimensional hierarchical representation of cellular states from Neftel et al. (88). From each of the four quadrants, cells that displayed relative meta-module scores > 1 were selected and named according to their corresponding cellular state, as defined in the figure. In total, 2,528 GBM cells and 1,014 non-malignant cells were used to generate the tSNE plot. (C) The tSNE dimensional reduction plot of GBM cells was repeated after converting the scRNAseq data of tumoural states into pseudo-bulk RNAseq data and incorporating to the input expression matrix the four biological replicates of the bulk RNAseq datasets for NSCs from Donega et al. (89) (downloaded from GSE130752).

Similar articles

Cited by

References

    1. Bartolomei MS. Genomic imprinting: employing and avoiding epigenetic processes. Genes Dev. (2009) 23:2124–33. 10.1101/gad.1841409 - DOI - PMC - PubMed
    1. Ferguson-Smith AC. Genomic imprinting: the emergence of an epigenetic paradigm. Nat Rev Genet. (2011) 12:565–75. 10.1038/nrg3032 - DOI - PubMed
    1. Peters J. The role of genomic imprinting in biology and disease: an expanding view. Nat Rev Genet. (2014) 15:517–30. 10.1038/nrg3766 - DOI - PubMed
    1. Barlow DP, Bartolomei MS. Genomic imprinting in mammals. Cold Spring Harb Perspect Biol. (2014) 6:a018382. 10.1101/cshperspect.a018382 - DOI - PMC - PubMed
    1. Ubeda F. Evolution of genomic imprinting with biparental care: implications for Prader-Willi and Angelman syndromes. PLoS Biol. (2008) 6:e208. 10.1371/journal.pbio.0060208 - DOI - PMC - PubMed

LinkOut - more resources