

Serum Metabolic Profiling Analysis of Chronic Gastritis and Gastric Cancer by Untargeted Metabolomics
- PMID: 33777793
- PMCID: PMC7991914
- DOI: 10.3389/fonc.2021.636917
Serum Metabolic Profiling Analysis of Chronic Gastritis and Gastric Cancer by Untargeted Metabolomics
Abstract
Purpose: Gastric cancer is a common tumor of the digestive system. Identification of potential molecules associated with gastric cancer progression and validation of potential biomarkers for gastric cancer diagnosis are very important. Thus, the aim of our study was to determine the serum metabolic characteristics of the serum of patients with chronic gastritis (CG) or gastric cancer (GC) and validate candidate biomarkers for disease diagnosis.
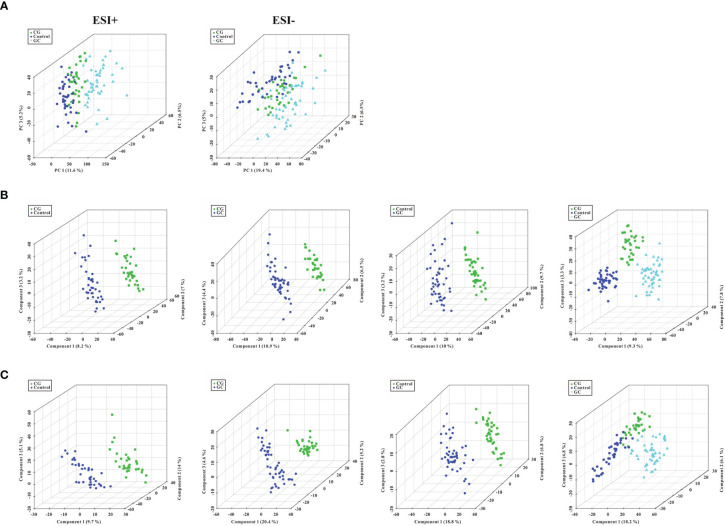
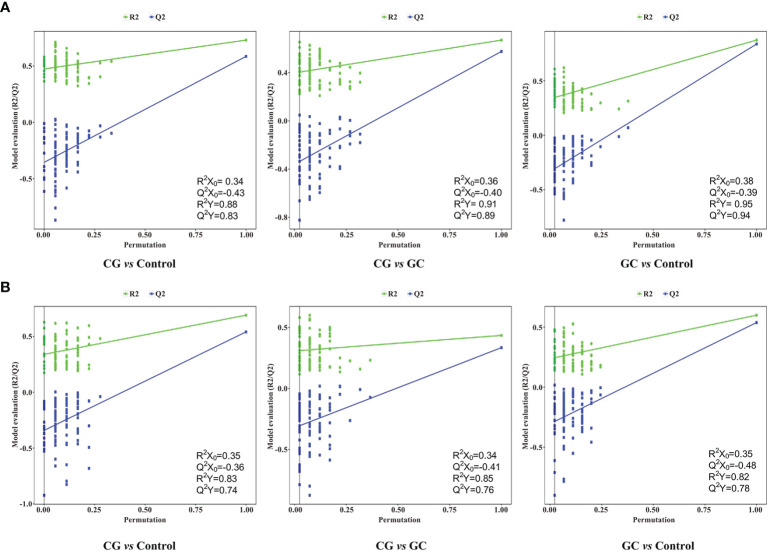
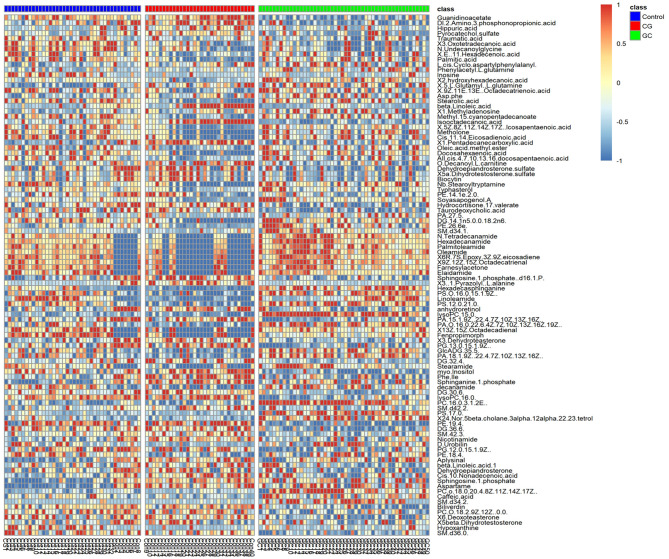
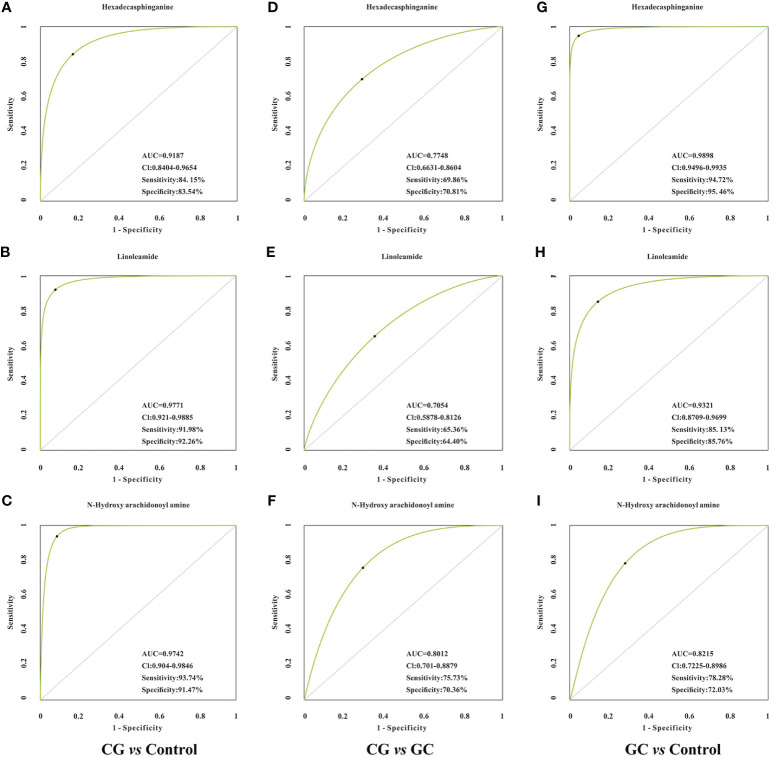
Experimental design: A total of 123 human serum samples from patients with CG or GC were collected for untargeted metabolomic analysis via UHPLC-Q-TOF/MS to determine characteristics of the serum. Principal component analysis (PCA), partial least squares discriminant analysis (PLS-DA), and heat map were used for multivariate analysis. In addition, commercial databases were used to identify the pathways of metabolites. Differential metabolites were identified based on a heat map with a t-test threshold (p < 0.05), fold-change threshold (FC > 1.5 or FC < 2/3) and variable importance in the projection (VIP >1). Then, differential metabolites were analyzed by receiver operating characteristic (ROC) curve to determine candidate biomarkers. All samples were analyzed for fasting lipid profiles.
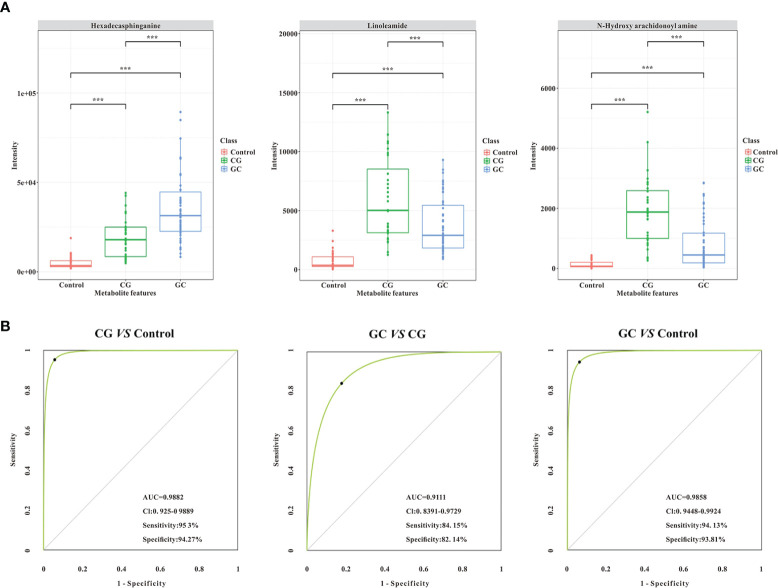
Results: Analysis of serum metabolomic profiles indicated that most of the altered metabolic pathways in the three groups were associated with lipid metabolism (p < 0.05) and lipids and lipid-like molecules were the predominating metabolites within the top 100 differential metabolites (p < 0.05, FC > 1.5 or FC < 2/3, and VIP >1). Moreover, differential metabolites, including hexadecasphinganine, linoleamide, and N-Hydroxy arachidonoyl amine had high diagnostic performance according to PLS-DA. In addition, fasting lipid profile analysis showed the serum levels of total cholesterol (TC), high-density lipoprotein cholesterol (HDL-C) and apolipoprotein A1 (Apo-A1) were decreased concomitant to the progression of the progression of the disease compared with those in the control group (p < 0.05).
Conclusions: Thus, this study demonstrated that lipid metabolism may influence the development of CG to GC. Hexadecasphinganine, linoleamide, and N-Hydroxy arachidonoyl amine were selected as candidate diagnostic markers for CG and GC.
Keywords: candidate biomarkers; chronic gastritis; gastric cancer; lipid metabolism; untargeted metabolomics.
Copyright © 2021 Yu, Lai, Feng, Li, Feng and Xu.
Conflict of interest statement
The authors declare that the research was conducted in the absence of any commercial or financial relationships that could be construed as a potential conflict of interest.
Figures
Similar articles
-
Metabolomics Profiling Discriminates Prostate Cancer From Benign Prostatic Hyperplasia Within the Prostate-Specific Antigen Gray Zone.Front Oncol. 2021 Oct 15;11:730638. doi: 10.3389/fonc.2021.730638. eCollection 2021. Front Oncol. 2021. PMID: 34722271 Free PMC article.
-
[Screening of serum oxysterol biomarkers for colon cancer by liquid chromatography-tandem mass spectrometry].Se Pu. 2022 Jun;40(6):541-546. doi: 10.3724/SP.J.1123.2022.01001. Se Pu. 2022. PMID: 35616199 Free PMC article. Chinese.
-
Targeted metabolomics analysis for serum Helicobacter pylori-positive based on liquid chromatography-tandem mass spectrometry.Biomed Chromatogr. 2023 Jun;37(6):e5622. doi: 10.1002/bmc.5622. Epub 2023 Apr 9. Biomed Chromatogr. 2023. PMID: 36898359
-
Metabolomics of papillary thyroid carcinoma tissues: potential biomarkers for diagnosis and promising targets for therapy.Tumour Biol. 2016 Aug;37(8):11163-75. doi: 10.1007/s13277-016-4996-z. Epub 2016 Mar 2. Tumour Biol. 2016. PMID: 26935059
-
[Risk prediction of metabolic syndrome and coronary artery disease in overweight and obese populations based on serum metabolomics].Zhonghua Xin Xue Guan Bing Za Zhi. 2023 Dec 24;51(12):1247-1255. doi: 10.3760/cma.j.cn112148-20231008-00254. Zhonghua Xin Xue Guan Bing Za Zhi. 2023. PMID: 38123207 Chinese.
Cited by
-
MAGEA11 as a STAD Prognostic Biomarker Associated with Immune Infiltration.Diagnostics (Basel). 2022 Oct 16;12(10):2506. doi: 10.3390/diagnostics12102506. Diagnostics (Basel). 2022. PMID: 36292195 Free PMC article.
-
Lipid metabolism characterization in gastric cancer identifies signatures to predict prognostic and therapeutic responses.Front Genet. 2022 Nov 3;13:959170. doi: 10.3389/fgene.2022.959170. eCollection 2022. Front Genet. 2022. PMID: 36406121 Free PMC article.
-
The metabolites mainly composed of lipids in tongue coating are non-invasive potential biomarkers for chronic gastritis.Sci Rep. 2024 Jul 30;14(1):17574. doi: 10.1038/s41598-024-68261-6. Sci Rep. 2024. PMID: 39079952 Free PMC article.
-
Metabolomics Study of Isocaloric Different Dietary Patterns on the Life Span in Healthy Population.Clin Interv Aging. 2021 Dec 22;16:2111-2123. doi: 10.2147/CIA.S343057. eCollection 2021. Clin Interv Aging. 2021. PMID: 35221682 Free PMC article.
-
Metabolomic profiling of upper GI malignancies in blood and tissue: a systematic review and meta-analysis.J Cancer Res Clin Oncol. 2024 Jul 1;150(7):331. doi: 10.1007/s00432-024-05857-5. J Cancer Res Clin Oncol. 2024. PMID: 38951269 Free PMC article.
References
LinkOut - more resources
Full Text Sources
Other Literature Sources
Miscellaneous