. 2021 Mar 10:8:604560.
doi: 10.3389/fvets.2021.604560. eCollection 2021.

American Mammals Susceptibility to Dengue According to Geographical, Environmental, and Phylogenetic Distances

Affiliations

American Mammals Susceptibility to Dengue According to Geographical, Environmental, and Phylogenetic Distances

Ángel L Robles-Fernández et al. Front Vet Sci. .

Abstract

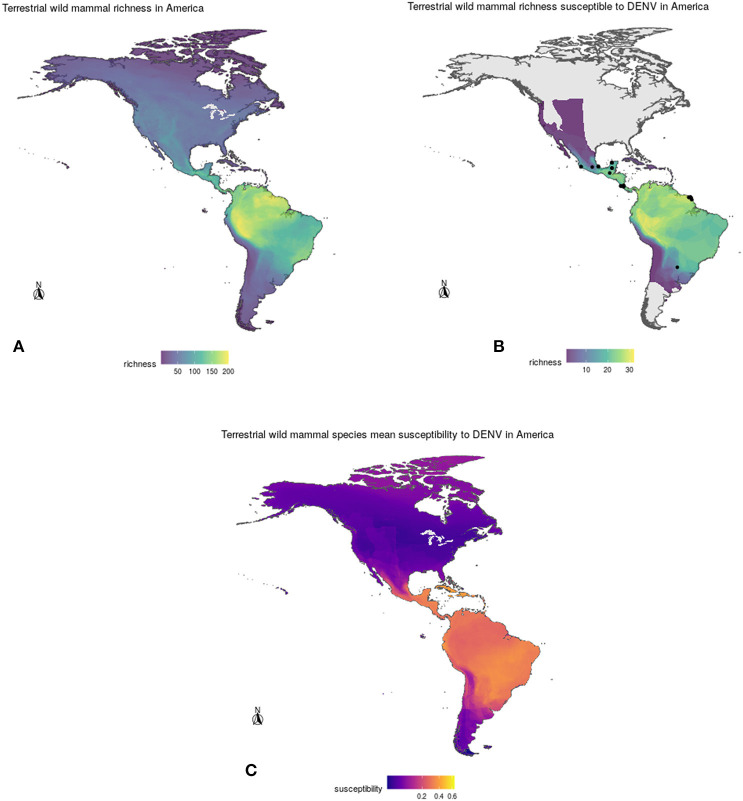
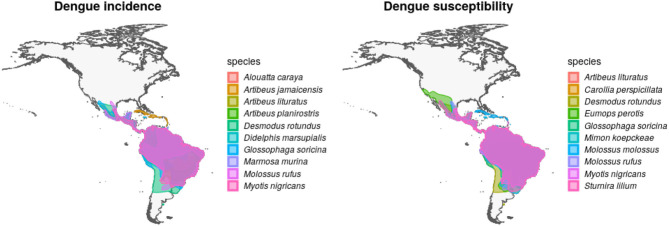
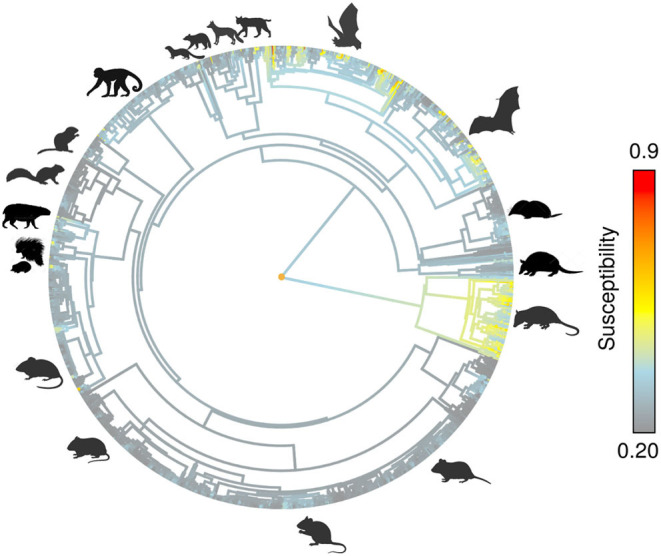
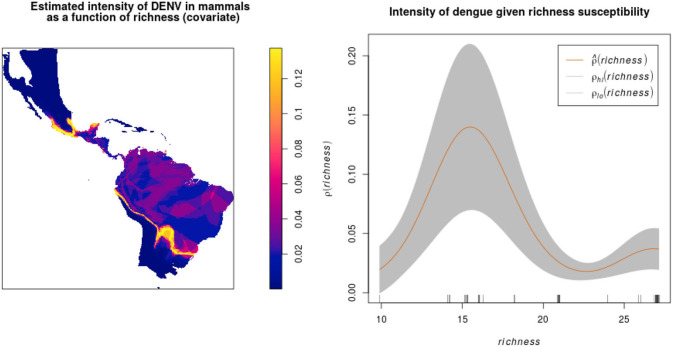
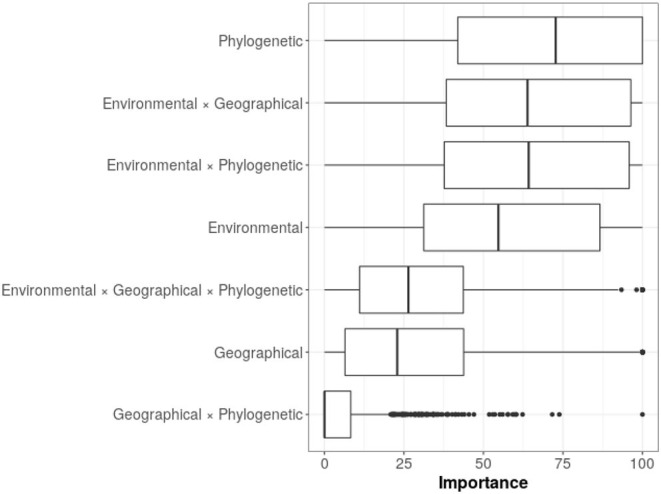
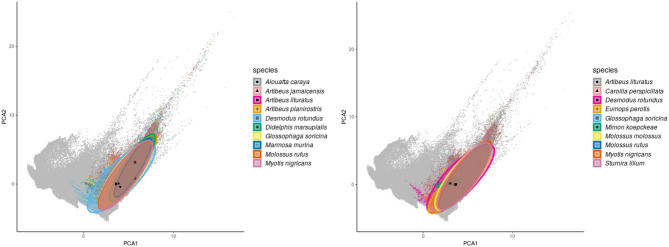
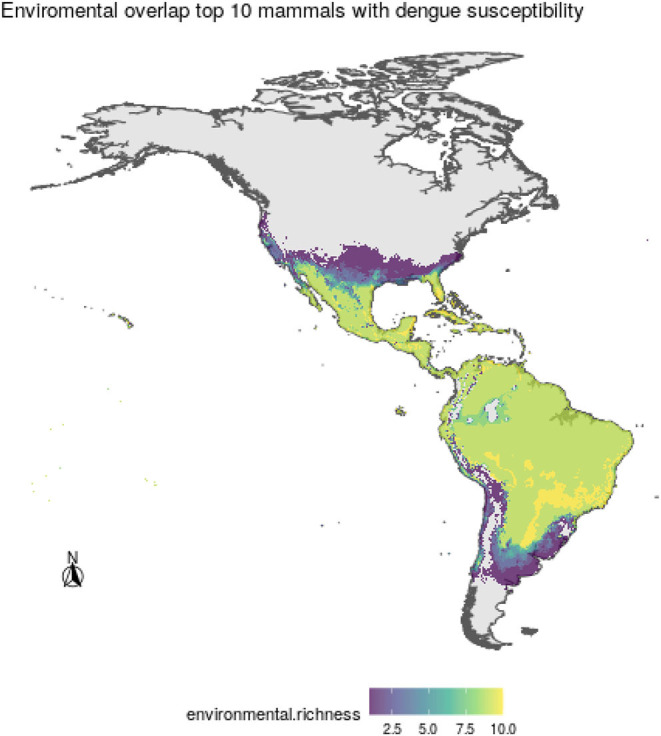
Many human emergent and re-emergent diseases have a sylvatic cycle. Yet, little effort has been put into discovering and modeling the wild mammal reservoirs of dengue (DENV), particularly in the Americas. Here, we show a species-level susceptibility prediction to dengue of wild mammals in the Americas as a function of the three most important biodiversity dimensions (ecological, geographical, and phylogenetic spaces), using machine learning protocols. Model predictions showed that different species of bats would be highly susceptible to DENV infections, where susceptibility mostly depended on phylogenetic relationships among hosts and their environmental requirement. Mammal species predicted as highly susceptible coincide with sets of species that have been reported infected in field studies, but it also suggests other species that have not been previously considered or that have been captured in low numbers. Also, the environment (i.e., the distance between the species' optima in bioclimatic dimensions) in combination with geographic and phylogenetic distance is highly relevant in predicting susceptibility to DENV in wild mammals. Our results agree with previous modeling efforts indicating that temperature is an important factor determining DENV transmission, and provide novel insights regarding other relevant factors and the importance of considering wild reservoirs. This modeling framework will aid in the identification of potential DENV reservoirs for future surveillance efforts.

Keywords: DENV 1-4; biotic interactions; machine learning; random forest; risk assessment; sylvatic cycle; wild reservoir.


Conflict of interest statement

The authors declare that the research was conducted in the absence of any commercial or financial relationships that could be construed as a potential conflict of interest.

Figures

Figure 1
Figure 1
(A) Geographic distribution of total mammal species richness (top left), (B) richness of DENV susceptible species (top right), and (C) mean susceptibility to DENV (bottom) of wild mammals in the Americas according to model projections. See section 2 for details.
Figure 2
Figure 2
Geographic distribution of mammal species with high incidence and susceptibility to DENV. Left panel shows the top 10 wild mammal species with highest DENV incidence according to published information. Right panel shows the top 10 most DENV susceptible wild mammal species according to the random forest models.
Figure 3
Figure 3
Predicted susceptibility as continuous trait on mammals phylogeny.
Figure 4
Figure 4
Estimated DENV intensity among American wild mammals given susceptible species richness as a covariate. The plot shows ρ^(richness) against covariate values of richness, together with 95% confidence bands (between ρlo and ρhi) assuming a non-homogeneous Poisson point process.
Figure 5
Figure 5
Variable importance from random forest models. The mean percentage values for the variable importance are as follows: phylogenetic = 67.5; environmental*geographical = 62.6; environmental*phylogenetic = 62.3; environmental = 55.8; environmental*geographical*phylogenetic = 29.9; geographical = 28.5; geographical*phylogenetic = 6.38.
Figure 6
Figure 6
Environmental ellipsoids with centroids. Left panel shows the top 10 wild mammal species with highest DENV incidence according to published information. Right panel shows the top 10 wild mammal species most susceptible according to random forest models.
Figure 7
Figure 7
Areas of environmental overlap for the top 10 most susceptible wild mammal species to DENV, where higher values indicate more coincidence among species ecological niches.

Similar articles

Cited by

References

    1. Maxwell SL, Fuller RA, Brooks TM, Watson JE. Biodiversity: the ravages of guns, nets and bulldozers. Nat News. (2016) 536:143–5. 10.1038/536143a - DOI - PubMed
    1. Jones-Engel L, May CC, Engel GA, Steinkraus KA, Schillaci MA, Fuentes A, et al. . Diverse contexts of zoonotic transmission of simian foamy viruses in Asia. Emerg Infect Dis. (2008) 14:1200. 10.3201/eid1408.071430 - DOI - PMC - PubMed
    1. Allen T, Murray KA, Zambrana-Torrelio C, Morse SS, Rondinini C, Di Marco M, et al. . Global hotspots and correlates of emerging zoonotic diseases. Nat Commun. (2017) 8:1–10. 10.1038/s41467-017-00923-8 - DOI - PMC - PubMed
    1. Olival KJ, Hosseini PR, Zambrana-Torrelio C, Ross N, Bogich TL, Daszak P. Host and viral traits predict zoonotic spillover from mammals. Nature. (2017) 546:646–50. 10.1038/nature22975 - DOI - PMC - PubMed
    1. Gibb R, Redding DW, Chin KQ, Donnelly CA, Blackburn TM, Newbold T, et al. . Zoonotic host diversity increases in human-dominated ecosystems. Nature. (2020) 584:398–402. 10.1038/s41586-020-2562-8 - DOI - PubMed

LinkOut - more resources