. 2020 Dec 8;4(1):e1131.
doi: 10.1002/jsp2.1131. eCollection 2021 Mar.

The effects of 3D culture on the expansion and maintenance of nucleus pulposus progenitor cell multipotency

Affiliations

The effects of 3D culture on the expansion and maintenance of nucleus pulposus progenitor cell multipotency

Julien Guerrero et al. JOR Spine. .

Abstract

Introduction: Low back pain (LBP) is a global health concern. Increasing evidence implicates intervertebral disk (IVD) degeneration as a major contributor. In this respect, tissue-specific progenitors may play a crucial role in tissue regeneration, as these cells are perfectly adapted to their niche. Recently, a novel progenitor cell population was described in the nucleus pulposus (NP) that is positive for Tie2 marker. These cells have self-renewal capacity and in vitro multipotency potential. However, extremely low numbers of the NP progenitors limit the feasibility of cell therapy strategies.

Objective: Here, we studied the influence of the culture method and of the microenvironment on the proliferation rate and the differentiation potential of human NP progenitors in vitro.

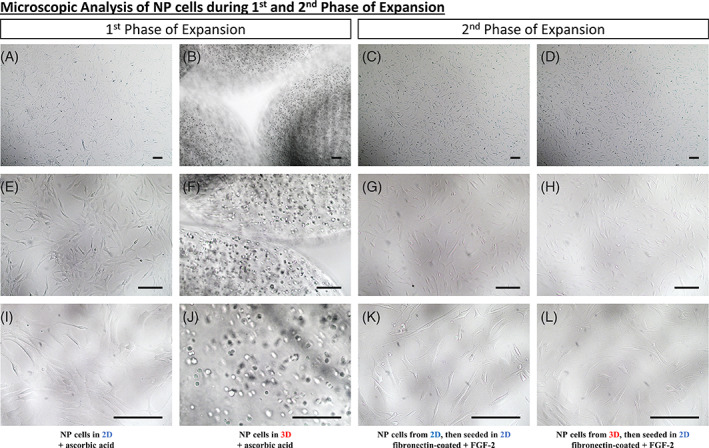
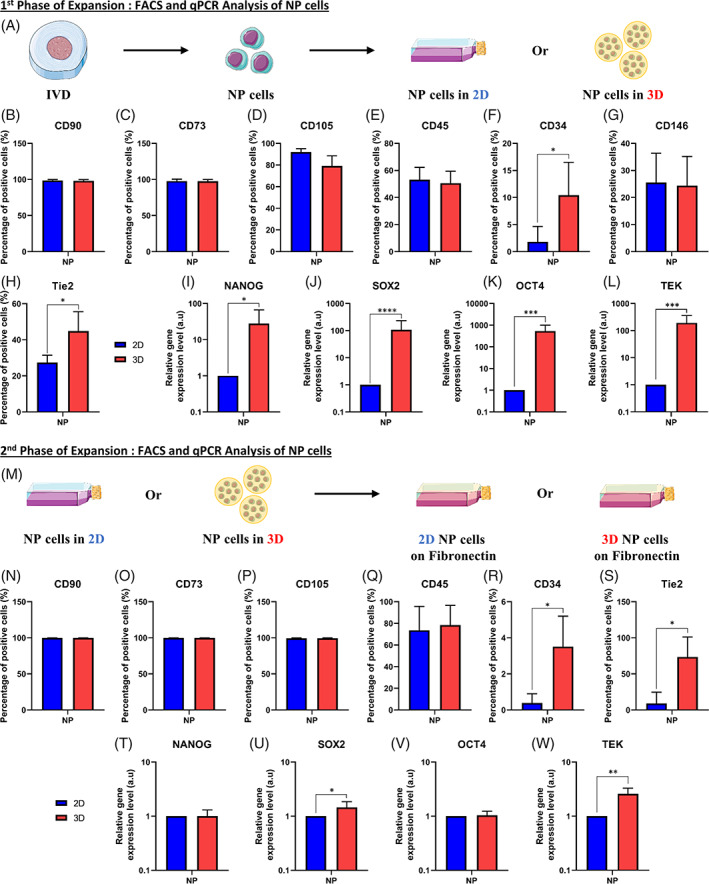
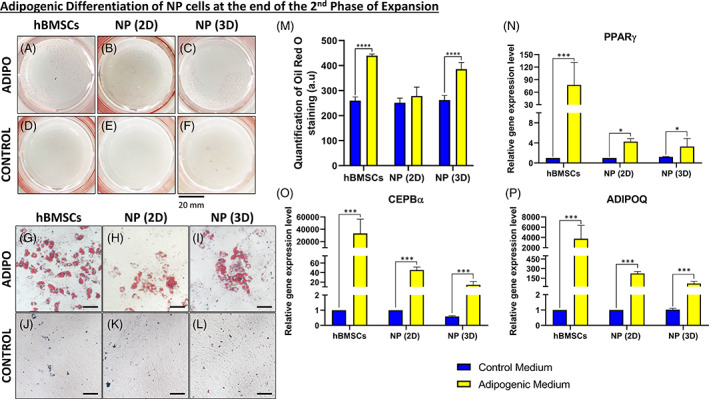
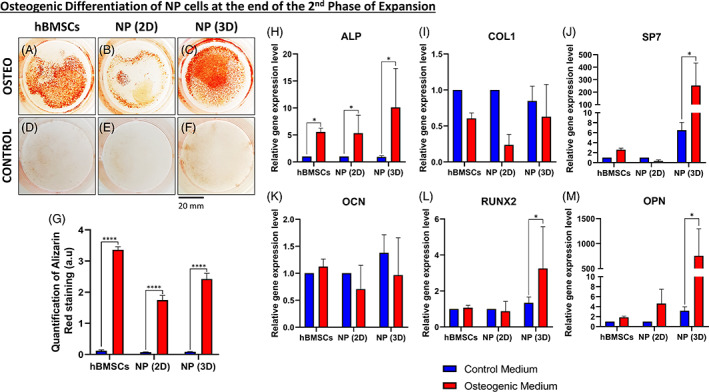
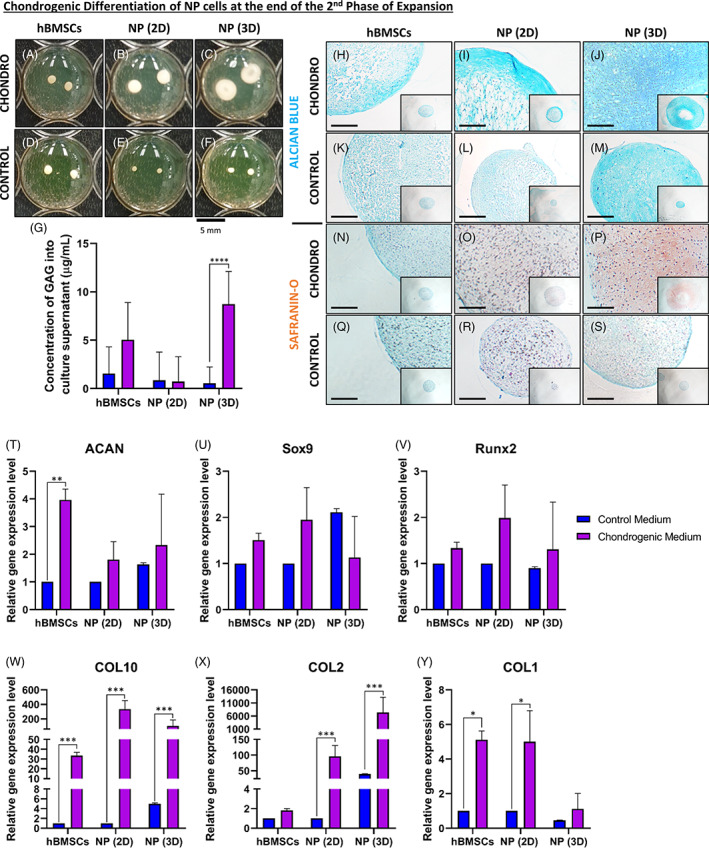
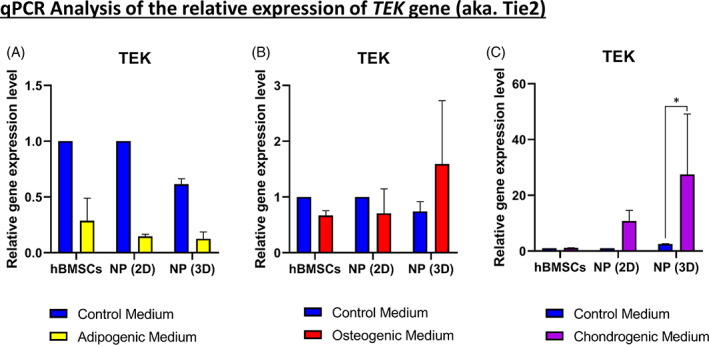
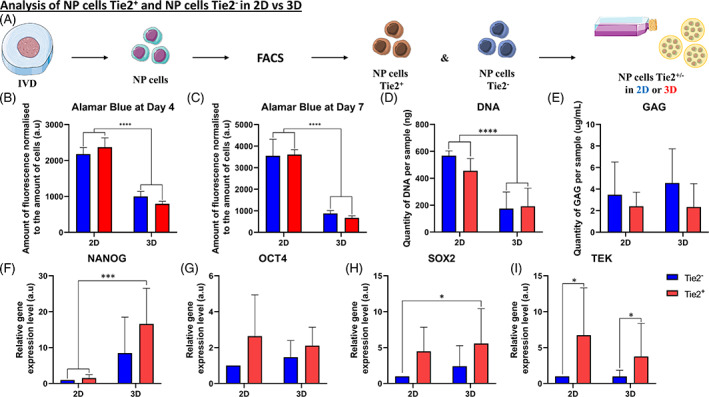
Method: Cells were obtained from human NP tissue from trauma patients. Briefly, the NP tissue cells were cultured in two-dimensional (2D) (monolayer) or three-dimensional (3D) (alginate beads) conditions. After 1 week, cells from 2D or 3D culture were expanded on fibronectin-coated flasks. Subsequently, expanded NP cells were then characterized by cytometry and tri-lineage differentiation, which was analyzed by qPCR and histology. Moreover, experiments using Tie2+ and Tie2- NP cells were also performed.

Results: The present study aims to demonstrate that 3D expansion of NP cells better preserves the Tie2+ cell populations and increases the chondrogenic and osteogenic differentiation potential compared to 2D expansion. Moreover, the cell sorting experiments reveal that only Tie2+ cells were able to maintain the pluripotent gene expression if cultured in 3D within alginate beads. Therefore, our results highly suggest that the maintenance of the cell's multipotency is mainly, but not exclusively, due to the higher presence of Tie2+ cells due to 3D culture.

Conclusion: This project not only might have a scientific impact by evaluating the influence of a two-step expansion protocol on the functionality of NP progenitors, but it could also lead to an innovative clinical approach.

Keywords: adipogenesis; alginate bead; angiopoietin‐1 receptor; chondrogenesis; differentiation; flow cytometry; intervertebral disk; microenvironment; nucleus pulposus; osteogenesis; qPCR; three‐dimensional culture; tissue‐specific progenitor cells.


Conflict of interest statement

The authors indicated no potential conflict of interest.

Figures

FIGURE 1
FIGURE 1
Microscopic analysis of NP cells during the first and second phase of Expansion. A‐L, Microscopic analysis of human NP cells seeded within different conditions. A, E, and I, Human NP cells seeded in two‐dimensional (2D) with a culture medium supplemented with ascorbic acid. B, F, J, Human NP cells seeded in three‐dimensional (3D) (alginate beads) with a culture medium supplemented in ascorbic acid. C, G, K, Human NP cells seeded 2D and then in 2D on fibronectin‐coated flasks with fibroblast growth factor (FGF‐2) supplemented culture medium. D, H, L, Human NP cells seeded 3D and then in 2D on fibronectin‐coated flasks with FGF‐2 supplemented culture medium. Scale bar: For pictures, A, until, L, the scale bar represents 150 μm
FIGURE 2
FIGURE 2
Analysis of NP cells after the first and second phase of expansion. A, Schematic representation of the first phase of expansion of nucleus pulposus (NP) cells. Briefly, after dissection and digestion of the NP tissue from the intervertebral disk (IVD), NP cells were seeded in two‐dimensional (2D) or three‐dimensional (3D) into alginate beads. B‐H, Quantification by flow cytometry analysis of the amount of NP cells positive for different markers after culture in 2D or 3D for 1 week of culture. B‐H, Percentage of NP cells positive in 2D or 3D for, B, CD90 marker, C, CD73 marker, D, CD105 marker, E, CD45 marker, F, CD34 marker, G, CD146 marker, and, H, Tie2 marker. I‐L, Quantification of the relative gene on NP cells for different genes after culture in 2D or 3D for 1 week of culture. I, Relative gene expression of NANOG in NP cells in 2D or 3D. J, Relative gene expression of SOX2 in NP cells in 2D or 3D. K, Relative gene expression of OCT4 in NP cells in 2D or 3D. L, Relative gene expression of TEK in NP cells in 2D or 3D. M, Schematic representation of the second phase of expansion of NP cells. Briefly, after the first phase of expansion, NP cells cultured in 2D or 3D were putting back in the fibronectin‐coated flask/surface. N‐S, Quantification by flow cytometry analysis of the amount of NP cells (previously cultivated in 2D or 3D) positive for different markers after culture in the fibronectin‐coated surface for 1 week of culture for, N, CD90 marker, O, CD73 marker, P, CD105 marker, Q, CD45 marker, R, CD34 marker, and, S, Tie2 marker. T‐W, Quantification of the relative gene on NP cells (previously cultivated in 2D or 3D) for different genes after culture on the fibronectin‐coated surface. T, Relative gene expression of NANOG in NP cells. U, Relative gene expression of SOX2 in NP cells. V, Relative gene expression of OCT4 in NP cells. W, Relative gene expression of TEK in NP cells (n = 6) for each gene. Data are presented as mean ± SD. NP cells cultured in 2D during the first expansion phase = blue bars. NP cells cultured in 3D during the first expansion phase = red bars. Tie2, angiopoietin‐1 receptor; NANOG, homeobox protein NANOG; SOX2, SRY (sex‐determining region Y)‐box 2; OCT4, octamer‐binding transcription factor 4; TEK, angiopoietin‐1 receptor
FIGURE 3
FIGURE 3
Adipogenic differentiation of NP cells at the end of the second expansion phase. A‐C, Macroscopic analysis of Oil‐Red‐O staining after 21 days of culture into the adipogenic medium for, A, human Bone marrow mesenchymal stromal cells (hBMSCs), B, nucleus pulposus (NP) cells previously cultured in two‐dimensional (2D) (NP [2D]), and, C, NP cells previously cultured in three‐dimensional (3D) (NP [3D]). D‐F, Macroscopic analysis of Oil‐Red‐O staining after 21 days of culture into control medium for, D, hBMSCs, E, NP cells previously cultured in 2D (NP [2D]), and, F, NP cells previously cultured in 3D (NP [3D]). G‐L, Microscopic analysis of Oil‐Red‐O staining after 21 days of culture into the adipogenic medium for, G, hBMSCs, H, NP cells previously cultured in 2D (NP [2D]) and, I, NP cells previously cultured in 3D (NP [3D]). J‐L, Macroscopic analysis of Oil‐Red‐O staining after 21 days of culture into control medium for, J, hBMSCs, K, NP cells previously cultured in 2D (NP [2D]), and, L, NP cells previously cultured in 3D (NP [3D]). M, Quantification of Oil‐Red‐O staining for hBMSCs, NP cells previously cultured in 2D (NP [2D]), and NP cells previously cultured in 3D (NP [3D]) after 21 days in the adipogenic and control medium. N‐P, Quantification of the relative gene on NP cells (previously cultivated in 2D or 3D) for different adipogenic related genes after culture on the fibronectin‐coated surface with the adipogenic or control medium. N, Relative gene expression of peroxisome proliferator‐activated receptor gamma (PPARγ) in NP cells. O, Relative gene expression of CCAAT/enhancer‐binding protein alpha (CEPBα) in NP cells. P, Relative gene expression of adiponectin (ADIPOQ) in NP cells (n = 6) for each gene. Data are presented as mean ± SD. NP cells cultured in the control medium = blue bars. NP cells cultured in the adipogenic medium = yellow bars. Scale bar: For pictures, G, until, L, the scale bar represent 100 μm
FIGURE 4
FIGURE 4
Osteogenic differentiation of NP cells at the end of the second expansion phase. A‐C, Macroscopic analysis of Alizarin Red staining after 21 days of culture into the osteogenic medium for, A, human bone marrow mesenchymal stromal cells (hBMSCs), B, nucleus pulposus (NP) cells previously cultured in two‐dimensional (2D) (NP [2D]), and, C, NP cells previously cultured in three‐dimensional (3D) (NP [3D]). D‐F, Macroscopic analysis of Alizarin Red staining after 21 days of culture into the control medium for, D, hBMSCs, E, NP cells previously cultured in 2D (NP [2D]), and, F, NP cells previously cultured in 3D (NP [3D]). G, Quantification of Alizarin Red staining for hBMSCs, NP cells previously cultured in 2D (NP [2D]), and NP cells previously cultured in 3D (NP [3D]) after 21 days in the osteogenic and control medium. H‐M, Quantification of the relative gene on NP cells (previously cultivated in 2D or 3D) for different osteogenic related genes after culture on the fibronectin‐coated surface with the osteogenic or control medium. H, Relative gene expression of alkaline phosphatase (ALPL) in NP cells. I, Relative gene expression of collagen type I (COL1) in NP cells. J, Relative gene expression of osterix (SP7) in NP cells. K, Relative gene expression of osteocalcin (OCN) in NP cells. L, Relative gene expression of runt‐related transcription factor 2 (RUNX2) in NP cells. M, Relative gene expression of osteopontin (OPN) in NP cells (n = 5) for each gene. Data are presented as mean ± SD. NP cells cultured in the control medium = blue bars. NP cells cultured in the osteogenic medium = red bars
FIGURE 5
FIGURE 5
Chondrogenic differentiation of nucleus pulposus (NP) cells at the end of the second expansion phase. A‐C, Macroscopic analysis of samples fixed after 21 days of culture into chondrogenic medium for, A, human bone marrow mesenchymal stromal cells (hBMSCs), B, NP cells previously cultured in two‐dimensional (2D) (NP [2D]), and, C, NP cells previously cultured in three‐dimensional (3D) (NP [3D]). D‐F, Macroscopic analysis of samples fixed after 21 days of culture into control medium for, D, hBMSCs, E, NP cells previously cultured in 2D (NP [2D]), and, F, NP cells previously cultured in 3D (NP [3D]). G, Quantification of GAG into culture supernatant for hBMSCs, NP cells previously cultured in 2D (NP [2D]), and NP cells previously cultured in 3D (NP [3D]) after 21 days in chondrogenic and control Medium. H‐M, Microscopic analysis of Alcian Blue staining after 21 days of culture into chondrogenic medium for, H, hBMSCs, I, NP cells previously cultured in 2D (NP [2D]) and, J, NP cells previously cultured in 3D (NP [3D]). K‐M, Macroscopic analysis of Alcian Blue staining after 21 days of culture into control medium for, K, hBMSCs, L, NP cells previously cultured in 2D (NP [2D]), and, M, NP cells previously cultured in 3D (NP [3D]). N‐P, Microscopic analysis of Safranin‐O and Fast Green staining after 21 days of culture into chondrogenic medium for, N, hBMSCs, O, NP cells previously cultured in 2D (NP [2D]), and P, NP cells previously cultured in 3D (NP [3D]). Q‐S, Macroscopic analysis of Safranin‐O and Fast Green staining after 21 days of culture into control medium for, Q, hBMSCs, R, NP cells previously cultured in 2D (NP [2D]) and, S, NP cells previously cultured in 3D (NP [3D]). T‐Y, Quantification of the relative gene on NP cells (previously cultivated in 2D or 3D) for different chondrogenic‐related genes after culture on the fibronectin‐coated surface with chondrogenic or control medium. T, Relative gene expression of aggrecan (ACAN) in NP cells. U, Relative gene expression of transcription factor Sox‐9 (SOX9) in NP cells. V, Relative gene expression of runt‐related transcription factor 2 (RUNX2) in NP cells. W, Relative gene expression of collagen type X (COL10) in NP cells. X, Relative gene expression of collagen type II (COL2) in NP cells. Y, Relative gene expression of collagen type I (COL1) in NP cells (n = 5) for each gene. Data are presented as mean ± SD. NP cells cultured in the control medium = blue bars. NP cells cultured in the chondrogenic medium = violet bars. Scale bar: For pictures, H, until, S, the scale bar represents 500 μm
FIGURE 6
FIGURE 6
Expression of angiopoietin‐1 receptor (TEK) gene after 21 days of tri‐lineage differentiation. A,B, Quantification of the relative gene on nucleus pulposus (NP) cells (previously cultivated in two‐dimensional [2D] or three‐dimensional [3D]) for TEK gene after tri‐lineage differentiation. A, Relative gene expression of TEK in human bone marrow mesenchymal stromal cells (hBMSCs) and NP cells cultivated in the adipogenic medium. B, Relative gene expression of TEK in hBMSCs and NP cells cultivated in the osteogenic medium. C, Relative gene expression of TEK in hBMSCs and NP cells cultivated in the chondrogenic medium (n = 5) for each differentiation medium. Data are presented as mean ± SD. NP cells cultured in control medium = blue bars. NP cells cultured in the adipogenic medium = yellow bars. NP cells cultured in the osteogenic medium = red bars. NP cells cultured in the chondrogenic medium = violet bars
FIGURE 7
FIGURE 7
Comparison of nucleus pulposus (NP) cells Tie2+ and NP cells Tie2. A, Schematic representation of the process leading to the comparison of NP cells Tie2+ and NP cells Tie2. Briefly, after dissection and digestion of the NP tissue from intervertebral disk (IVD), NP cells were sorted for angiopoietin‐1 receptor (Tie2) marker. Positive (Tie2+) and negative (Tie2) cells were seeded in two‐dimensional (2D) or in three‐dimensional (3D) (into alginate beads) and analyzed. A,B, Quantification of cell metabolism by Alamar Blue assay on Tie2+ and Tie2 NP cells (cultivated in 2D or 3D) at, A, day 4 and, B, day 7. D, Quantification of GAG produced in NP cells (Tie2+ and Tie2) in 2D or in 3D at day 7. E, Quantification of DNA measured in NP cells (Tie2+ and Tie2) in 2D or in 3D after day 7. F‐I, Quantification of the relative gene expression on NP cells (Tie2+ and Tie2) after culture in 2D or in 3D for 1 week of culture. F, Relative gene expression of homeobox protein NANOG (NANOG) in NP cells (Tie2+ and Tie2) in 2D or in 3D. G, Relative gene expression of SRY (sex determining region Y)‐box 2 (SOX2) in NP cells (Tie2+ and Tie2) in 2D or in 3D. H, Relative gene expression of octamer‐binding transcription factor 4 (OCT4) in NP cells (Tie2+ and Tie2) in 2D or in 3D. I, Relative gene expression of angiopoietin‐1 receptor (TEK) in NP cells (Tie2+ and Tie2) in 2D or in 3D (n = 5) for each gene. Data are presented as mean ± SD. Culture of NP cells (Tie2) = blue bars. Culture of NP cells (Tie2+) = red bars

Similar articles

Cited by

References

    1. Risbud MV, Shapiro IM. Role of cytokines in intervertebral disc degeneration: pain and disc content. Nat Rev Rheumatol. 2014;10(1):44‐56. - PMC - PubMed
    1. Martin BI, Deyo RA, Mirza SK, et al. Expenditures and health status among adults with back and neck problems. JAMA. 2008;299(6):656‐664. - PubMed
    1. Hoy D, Bain C, Williams G, et al. A systematic review of the global prevalence of low back pain. Arthritis Rheum. 2012;64(6):2028‐2037. - PubMed
    1. GBD 2017 Disease and Injury Incidence and Prevalence Collaborators . Global, regional, and national incidence, prevalence, and years lived with disability for 354 diseases and injuries for 195 countries and territories, 1990–2017: a systematic analysis for the global burden of Disease study 2017. Lancet. 2018;392(10159):1789‐1858. - PMC - PubMed
    1. Sakai D, Andersson GB. Stem cell therapy for intervertebral disc regeneration: obstacles and solutions. Nat Rev Rheumatol. 2015;11(4):243‐256. - PubMed