

Body mass index trajectories during mid to late life and risks of mortality and cardiovascular outcomes: Results from four prospective cohorts
- PMID: 33778436
- PMCID: PMC7985466
- DOI: 10.1016/j.eclinm.2021.100790
Body mass index trajectories during mid to late life and risks of mortality and cardiovascular outcomes: Results from four prospective cohorts
Abstract
Background: Our understanding of the weight-outcome association mainly comes from single-time body mass index (BMI) measurement. However, data on long-term trajectories of within-person changes in BMI on diverse study outcomes are sparse. Therefore, this study is to determine the associations of individual BMI trajectories and cardiovascular outcomes.
Methods: The present analysis was based on data from 4 large prospective cohorts and restricted to participants aged ≥45 years with at least two BMI measurements. Hazard ratios (HR) and 95% confidence intervals(95%CI) for each outcome according to different BMI trajectories were calculated in Cox regression models.
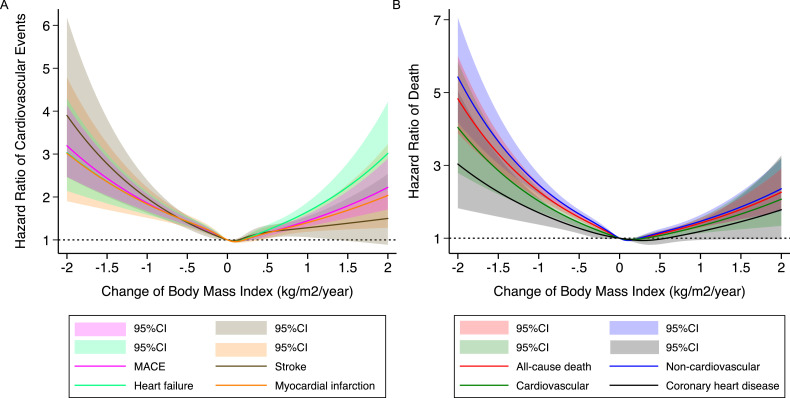
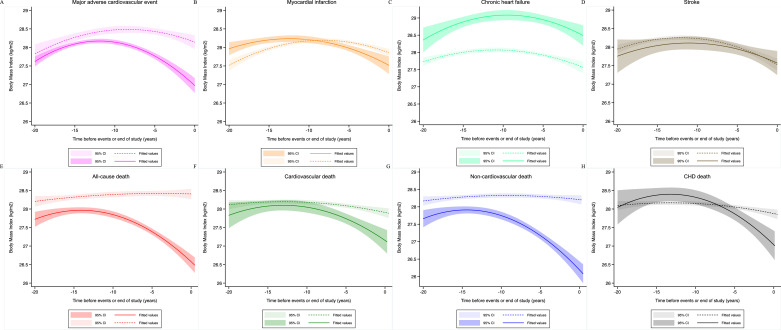
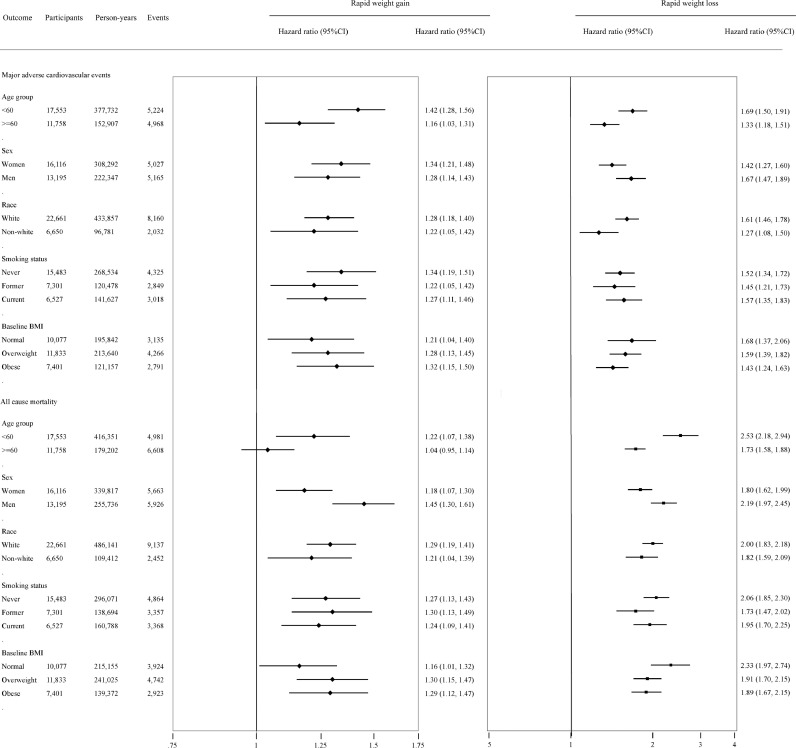
Findings: The final sample comprised 29,311 individuals (mean age 58.31 years, and 77.31% were white), with a median 4 BMI measurements used in this study. During a median follow-up of 21.16 years, there were a total of 10,192 major adverse cardiovascular events (MACE) and 11,589 deaths. A U-shaped relation was seen with all study outcomes. Compared with maintaining stable weight, the multivariate adjusted HR for MACE were 1.53 (95%CI 1.40-1.66), 1.26 (95%CI 1.16-1.37) and 1.08 (95%CI 1.02-1.15) respectively for rapid, moderate and slow weight loss; 1.01 (95%CI 0.95-1.07), 1.13 (95%CI 1.05-1.21) and 1.29 (95%CI 1.20-1.40) respectively for slow, moderate and rapid weight gain. Identical patterns of association were observed for all other outcomes. The development of BMI differed markedly between the outcome-free individuals and those who went on to experience adverse events, generally beginning to diverge 10 years before the occurrence of the events.
Interpretation: Our findings may signal an underlying high-risk population and inspire future studies on weight management.
Funding: National Natural Science Foundation of China, Guangdong Natural Science Foundation.
Keywords: Body mass index; Cardiovascular events; Mid-to-late life; Mortality; Trajectories.
© 2021 The Authors.
Conflict of interest statement
We declare no competing interests.
Figures
References
-
- Ogden C.L., Carroll M.D., Fryar C.D., Flegal K.M. Prevalence of obesity among adults and youth: United States, 2011-2014. NCHS Data Brief. 2015;(219):1–8. - PubMed
-
- Gu D., He J., Duan X. Body weight and mortality among men and women in China. JAMA. 2006;295(7):776–783. - PubMed
-
- Pan X.F., Yuan J.M., Koh W.P., Pan A. Weight change in relation to mortality in middle-aged and elderly Chinese: the Singapore Chinese health study. Int J Obes (Lond) 2019;43(8):1590–1600. - PubMed
-
- Xu W., Shubina M., Goldberg S.I., Turchin A. Body mass index and all-cause mortality in patients with hypertension. Obesity. 2015;23(8):1712–1720. - PubMed
LinkOut - more resources
Full Text Sources
Other Literature Sources
