

FoundationOne CDx testing accurately determines whole arm 1p19q codeletion status in gliomas
- PMID: 33778493
- PMCID: PMC7986056
- DOI: 10.1093/noajnl/vdab017
FoundationOne CDx testing accurately determines whole arm 1p19q codeletion status in gliomas
Erratum in
-
Erratum to: FoundationOne CDx testing accurately determines whole arm 1p19q codeletion status in gliomas.Neurooncol Adv. 2021 Jun 22;3(1):vdab059. doi: 10.1093/noajnl/vdab059. eCollection 2021 Jan-Dec. Neurooncol Adv. 2021. PMID: 34169283 Free PMC article.
Abstract
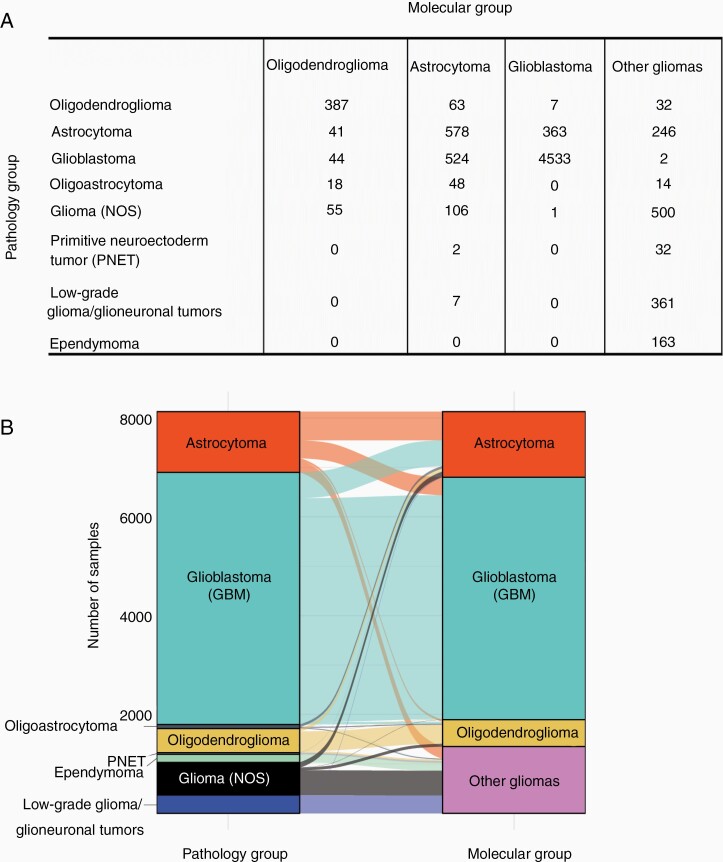
Background: Molecular profiling of gliomas is vital to ensure diagnostic accuracy, inform prognosis, and identify clinical trial options for primary and recurrent tumors. This study aimed to determine the accuracy of reporting the whole arm 1p19q codeletion status from the FoundationOne platform.
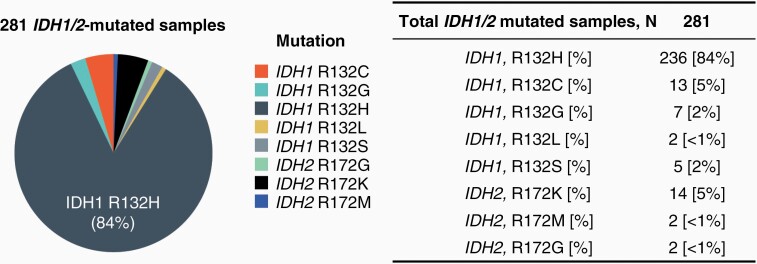
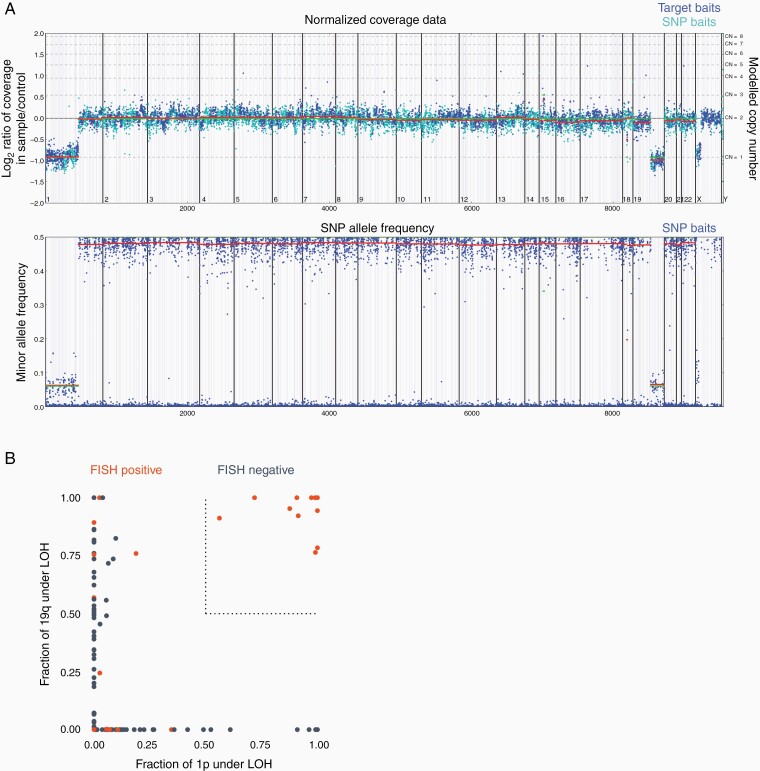
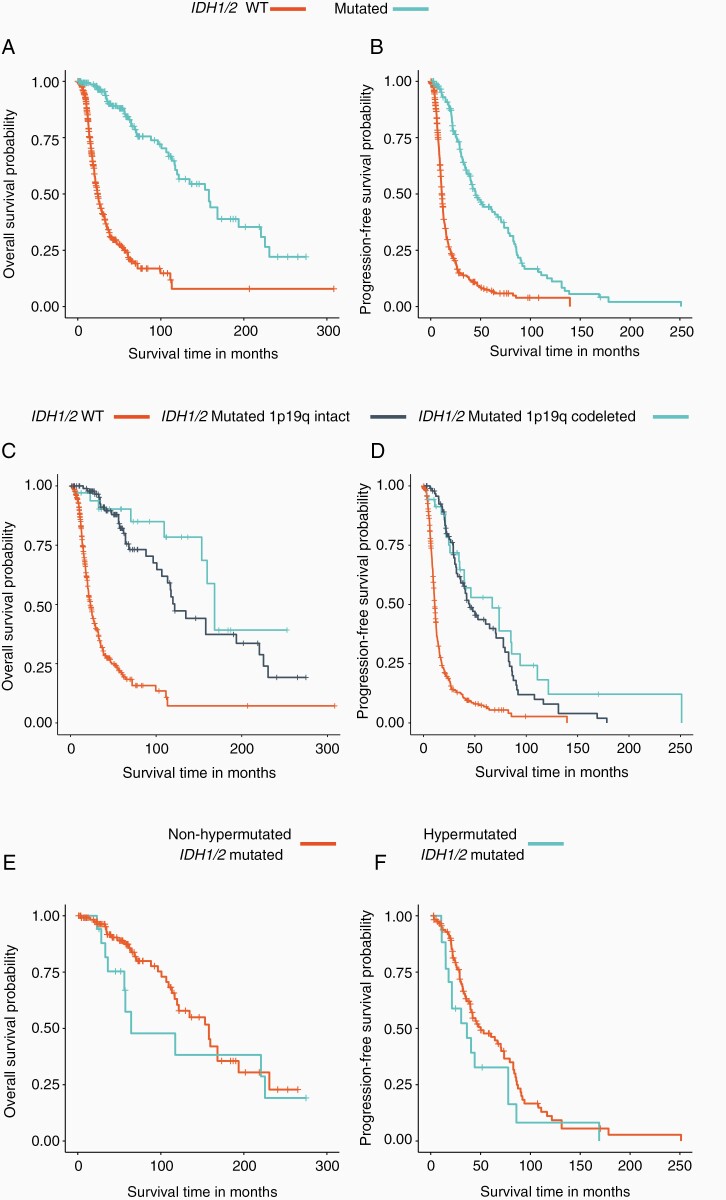
Methods: Testing was performed on glioma samples as part of clinical care and analyzed up to 395 cancer-associated genes (including IDH1/2). The whole arm 1p19q codeletion status was predicted from the same assay using a custom research-use only algorithm, which was validated using 463 glioma samples with available fluorescence in-situ hybridization (FISH) data. For 519 patients with available outcomes data, progression-free and overall survival were assessed based on whole arm 1p19q codeletion status derived from sequencing data.
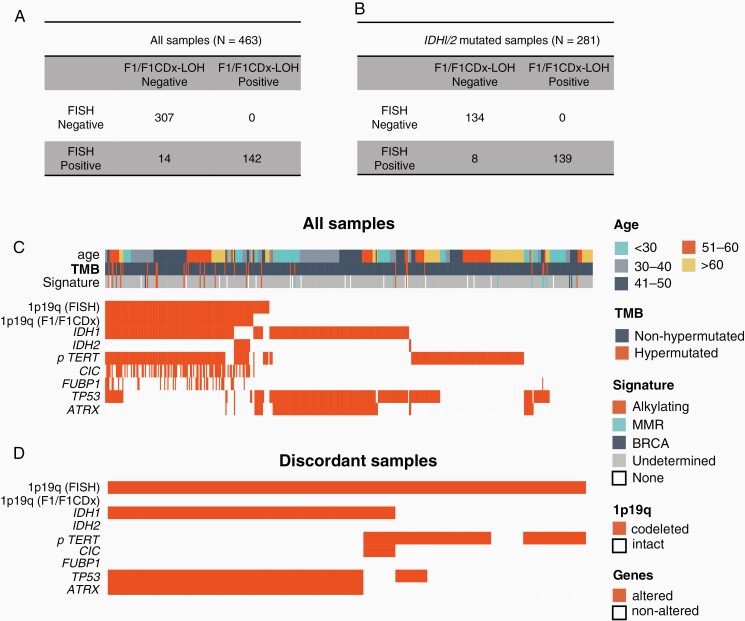
Results: Concordance between 1p19q status based on FISH and our algorithm was 96.7% (449/463) with a positive predictive value (PPV) of 100% and a positive percent agreement (PPA) of 91.0%. All discordant samples were positive for codeletion by FISH and harbored genomic alterations inconsistent with oligodendrogliomas. Median overall survival was 168 months for the IDH1/2 mutant, codeleted group, and 122 months for IDH1/2 mutant-only (hazard ratio (HR): 0.42; P < .05).
Conclusions: 1p19q codeletion status derived from FoundationOne testing is highly concordant with FISH results. Genomic profiling may be a reliable substitute for traditional FISH testing while also providing IDH1/2 status.
Keywords: 1p19q; CGP; F1CDx; FoundationOne; comprehensive genomic profiling; glioma.
© The Author(s) 2021. Published by Oxford University Press, the Society for Neuro-Oncology and the European Association of Neuro-Oncology.
Figures
Similar articles
-
Diagnostic and prognostic value of alpha internexin expression in a series of 409 gliomas.Eur J Cancer. 2011 Mar;47(5):802-8. doi: 10.1016/j.ejca.2010.11.031. Epub 2010 Dec 29. Eur J Cancer. 2011. PMID: 21194923
-
Erratum to: FoundationOne CDx testing accurately determines whole arm 1p19q codeletion status in gliomas.Neurooncol Adv. 2021 Jun 22;3(1):vdab059. doi: 10.1093/noajnl/vdab059. eCollection 2021 Jan-Dec. Neurooncol Adv. 2021. PMID: 34169283 Free PMC article.
-
Molecular genetics of adult grade II gliomas: towards a comprehensive tumor classification system.J Neurooncol. 2012 Nov;110(2):205-13. doi: 10.1007/s11060-012-0953-x. Epub 2012 Aug 14. J Neurooncol. 2012. PMID: 22890969
-
Histomolecular classification of adult diffuse gliomas: the diagnostic value of immunohistochemical markers.Rev Neurol (Paris). 2011 Oct;167(10):683-90. doi: 10.1016/j.neurol.2011.07.006. Epub 2011 Sep 1. Rev Neurol (Paris). 2011. PMID: 21889777 Review.
-
Noninvasive Determination of IDH and 1p19q Status of Lower-grade Gliomas Using MRI Radiomics: A Systematic Review.AJNR Am J Neuroradiol. 2021 Jan;42(1):94-101. doi: 10.3174/ajnr.A6875. Epub 2020 Nov 26. AJNR Am J Neuroradiol. 2021. PMID: 33243896 Free PMC article.
Cited by
-
A Retrospective Genomic Landscape of 661 Young Adult Glioblastomas Diagnosed Using 2016 WHO Guidelines for Central Nervous System Tumors.Oncologist. 2024 Jan 5;29(1):e47-e58. doi: 10.1093/oncolo/oyad224. Oncologist. 2024. PMID: 37619245 Free PMC article.
-
Interpretation of cancer mutations using a multiscale map of protein systems.Science. 2021 Oct;374(6563):eabf3067. doi: 10.1126/science.abf3067. Epub 2021 Oct 1. Science. 2021. PMID: 34591613 Free PMC article.
-
Targeted Treatment of Non-Small Cell Lung Cancer: Focus on Capmatinib with Companion Diagnostics.Onco Targets Ther. 2021 Nov 23;14:5321-5331. doi: 10.2147/OTT.S273357. eCollection 2021. Onco Targets Ther. 2021. PMID: 34853516 Free PMC article. Review.
-
Comprehensive clinical assays for molecular diagnostics of gliomas: the current state and future prospects.Front Mol Biosci. 2023 Oct 16;10:1216102. doi: 10.3389/fmolb.2023.1216102. eCollection 2023. Front Mol Biosci. 2023. PMID: 37908227 Free PMC article. Review.
-
The development of a custom RNA-sequencing panel for the identification of predictive and diagnostic biomarkers in glioma.J Neurooncol. 2024 Mar;167(1):75-88. doi: 10.1007/s11060-024-04563-z. Epub 2024 Feb 16. J Neurooncol. 2024. PMID: 38363490 Free PMC article.
References
Grants and funding
LinkOut - more resources
Full Text Sources
Other Literature Sources
Miscellaneous