

Reproducibility and Agreement of Tissue Tracking versus Feature Tracking for Strain Measurement on Cardiac MR Images in Patients with Repaired Tetralogy of Fallot
- PMID: 33778498
- PMCID: PMC7977742
- DOI: 10.1148/ryct.2019180005
Reproducibility and Agreement of Tissue Tracking versus Feature Tracking for Strain Measurement on Cardiac MR Images in Patients with Repaired Tetralogy of Fallot
Abstract
Purpose: To evaluate differences in strain measurements by using tissue-tracking (TT) and feature-tracking (FT) software on cardiovascular MR images in patients with repaired tetralogy of Fallot (TOF).
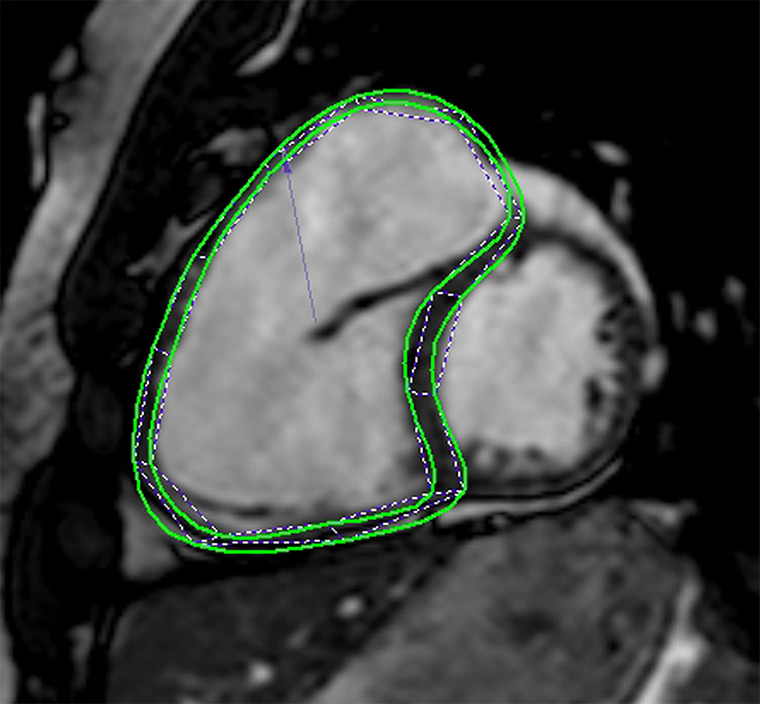
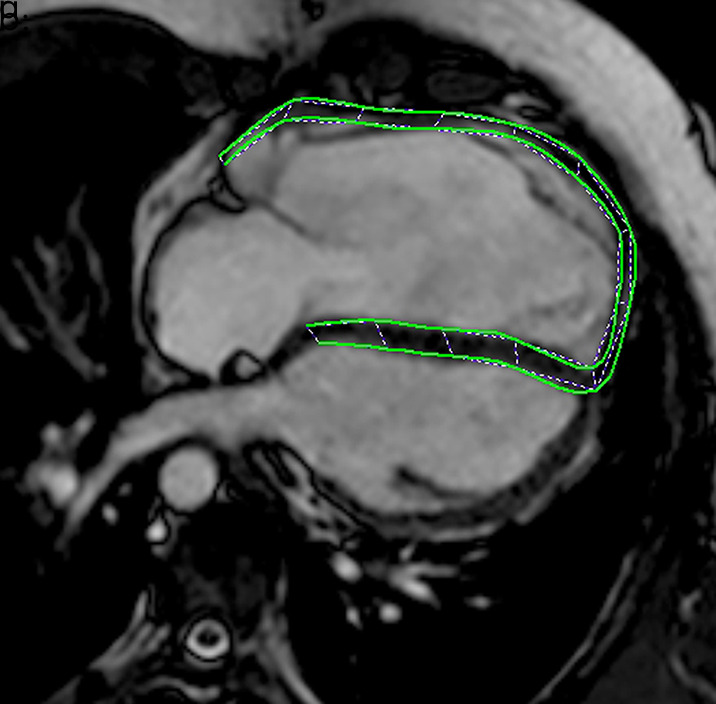
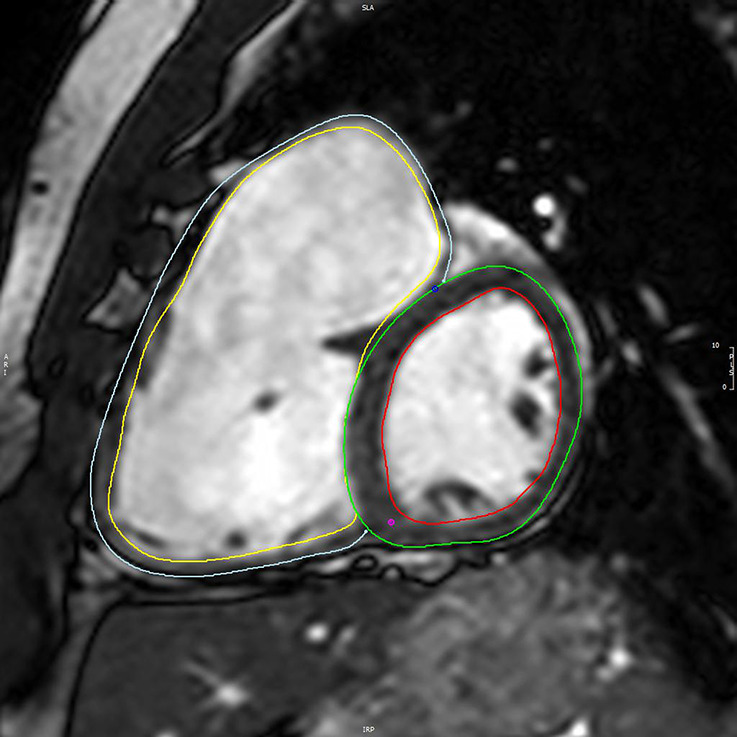
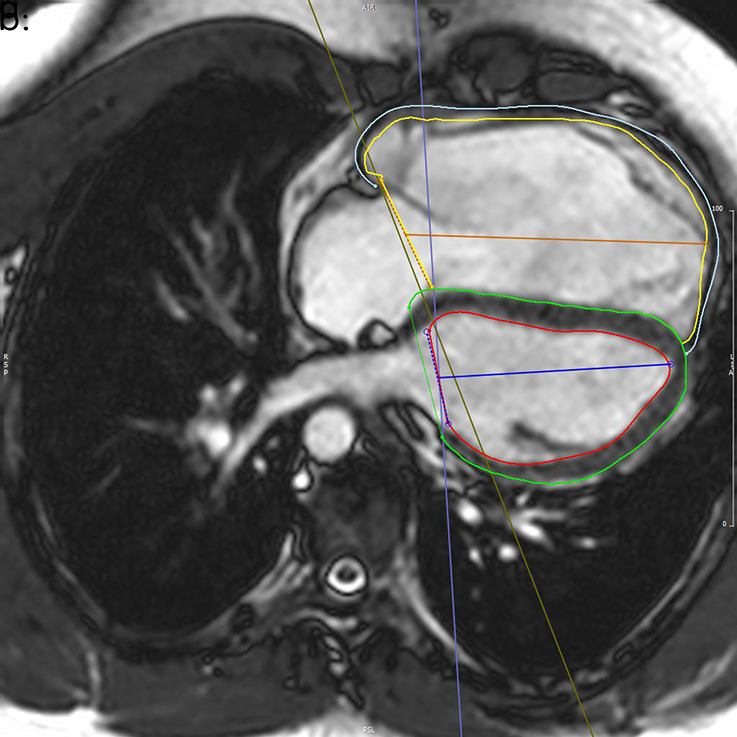
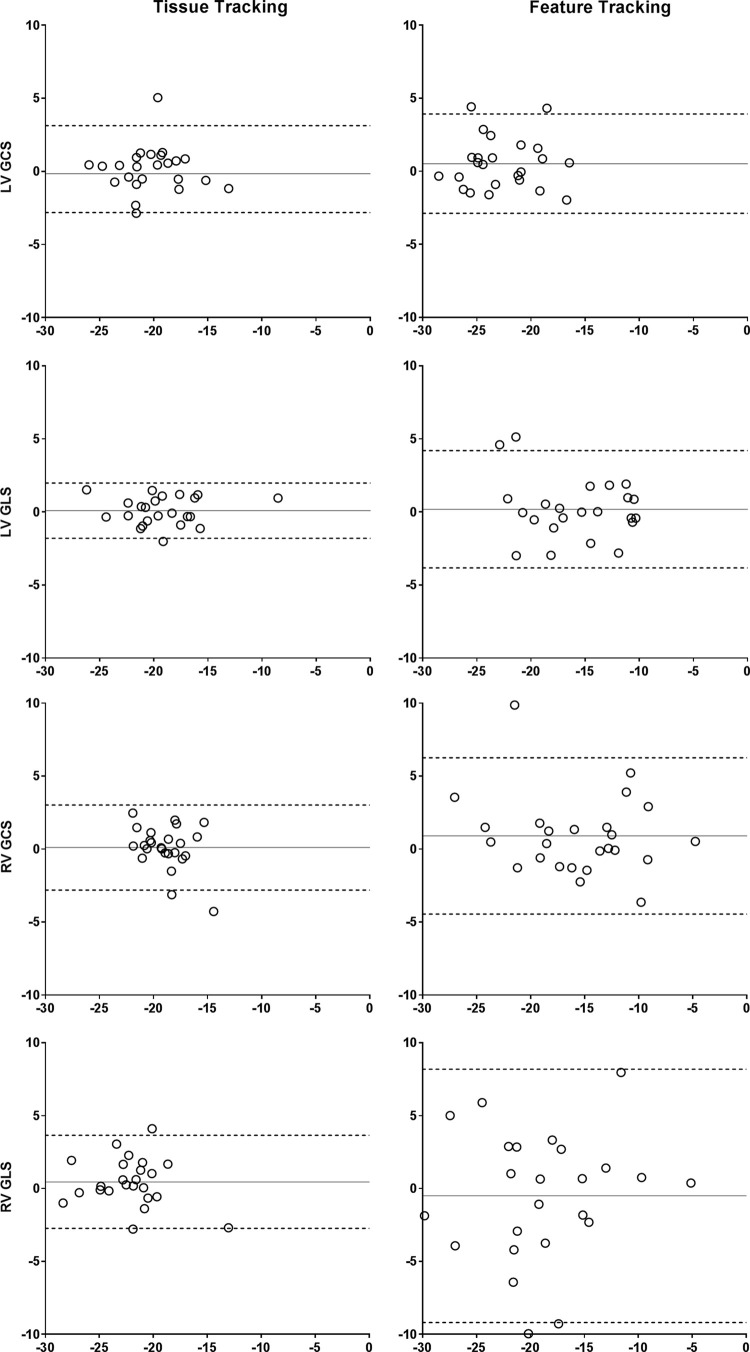
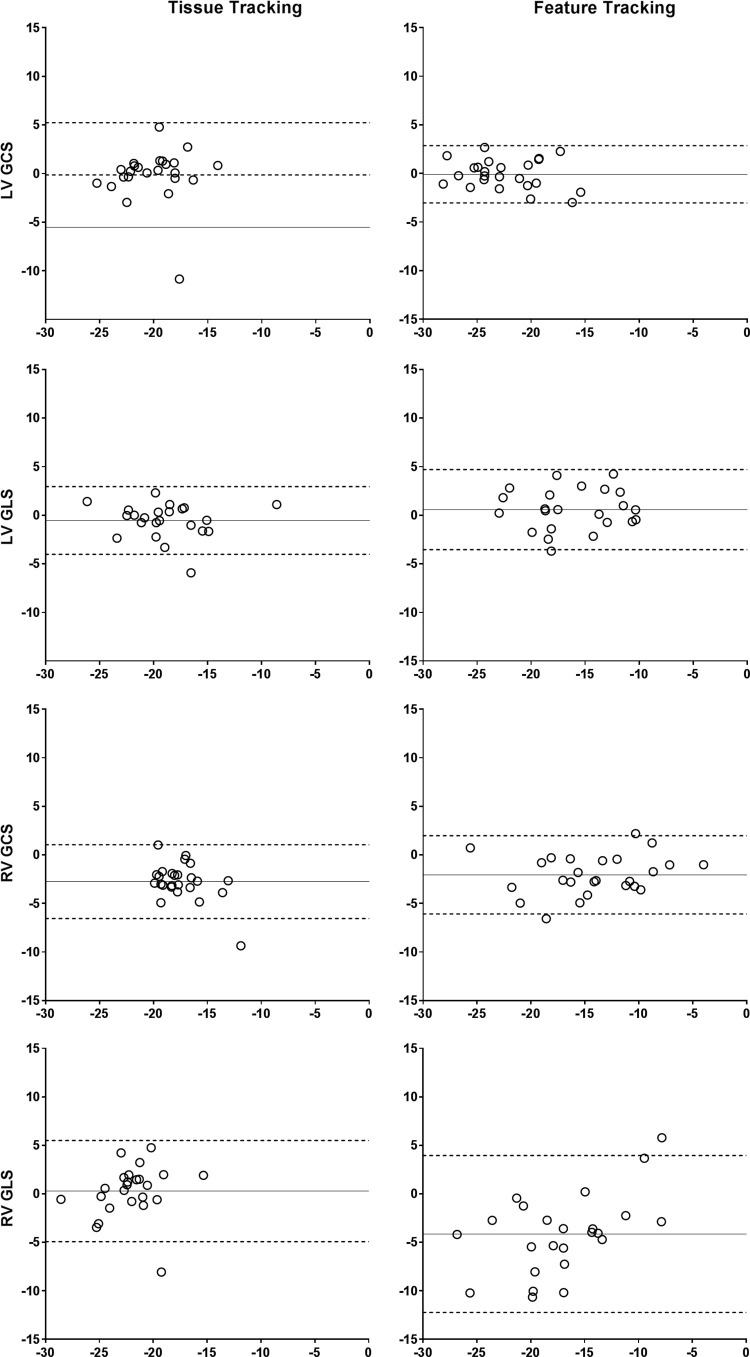
Materials and methods: In this retrospective cross-sectional study of 25 patients with repaired TOF (median age, 33.1 years; interquartile range, 25.3-38.3 years) from 2008 through 2014, left ventricular (LV) and right ventricular (RV) global circumferential and longitudinal strain were measured from cardiac MR images by using TT and FT software. Time to process was measured from opening the study to acceptance of contours. Intra- and interobserver reproducibility were evaluated with Bland-Altman analysis, coefficient of variation, and intraclass correlation coefficient.
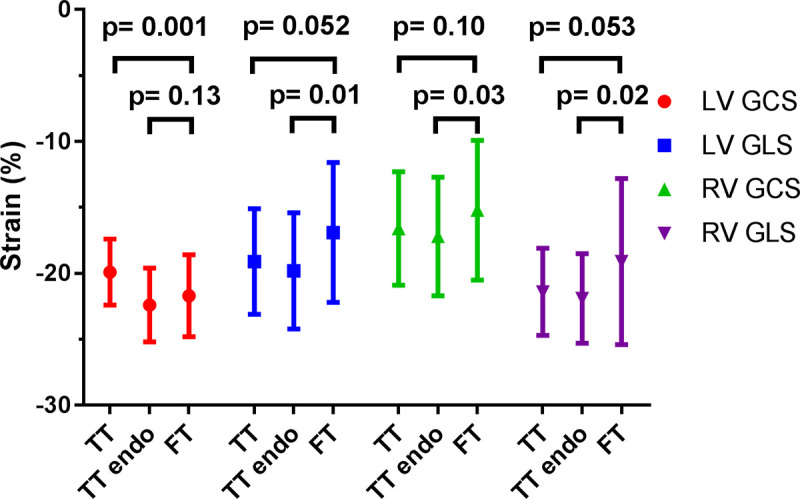
Results: Time to process was slightly longer for TT (10.2 minutes ± 3.1 [standard deviation] vs 9.0 minutes ± 1.7, P = .04). Fewer patients required contour revision with TT than with FT. Both TT and FT measurements had similar moderate-to-strong correlations with LV and RV ejection fractions; correlation of RV longitudinal strain with RV ejection fraction did not reach significance by using either method. With the exception of LV circumferential strain, strain measurements were lower with FT relative to TT. Intra- and interobserver reproducibility were lower with FT for longitudinal strain measurements.
Conclusion: TT and FT have systematic differences in strain values and reproducibility, particularly for longitudinal strain. Software-specific normative data are necessary, as are studies to evaluate correlation with clinical outcomes for each modality.© RSNA, 2019.
2019 by the Radiological Society of North America, Inc.
Conflict of interest statement
Disclosures of Conflicts of Interest: J.C.L. disclosed no relevant relationships. S.B. disclosed no relevant relationships. S.Y. disclosed no relevant relationships. M.G.M. disclosed no relevant relationships. P.P.A. Activities related to the present article: disclosed no relevant relationships. Activities not related to the present article: employed by Michigan Medicine. Other relationships: disclosed no relevant relationships. A.L.D. disclosed no relevant relationships.
Figures
Similar articles
-
Cardiac Magnetic Resonance Feature Tracking Biventricular Two-Dimensional and Three-Dimensional Strains to Evaluate Ventricular Function in Children After Repaired Tetralogy of Fallot as Compared with Healthy Children.Pediatr Cardiol. 2017 Mar;38(3):566-574. doi: 10.1007/s00246-016-1549-6. Epub 2017 Jan 5. Pediatr Cardiol. 2017. PMID: 28058478
-
Evaluation and Comparison of Quantitative Right Ventricular Strain Assessment by Cardiac Magnetic Resonance in Pulmonary Hypertension Using Feature Tracking and Deformable Registration Algorithms.Acad Radiol. 2021 Oct;28(10):e306-e313. doi: 10.1016/j.acra.2020.06.015. Epub 2020 Jul 3. Acad Radiol. 2021. PMID: 32624401
-
A comparison of the reproducibility of two cine-derived strain software programmes in disease states.Eur J Radiol. 2019 Apr;113:51-58. doi: 10.1016/j.ejrad.2019.01.026. Epub 2019 Jan 23. Eur J Radiol. 2019. PMID: 30927959
-
Impact of residual right ventricular outflow tract obstruction on biventricular strain and synchrony in patients after repair of tetralogy of Fallot: a cardiac magnetic resonance feature tracking study.Eur J Cardiothorac Surg. 2015 Jul;48(1):83-90. doi: 10.1093/ejcts/ezu396. Epub 2014 Nov 5. Eur J Cardiothorac Surg. 2015. PMID: 25378364
-
Detection of persistent systolic and diastolic abnormalities in asymptomatic pediatric repaired tetralogy of Fallot patients with preserved ejection fraction: a CMR feature tracking study.Eur Radiol. 2021 Aug;31(8):6156-6168. doi: 10.1007/s00330-020-07643-6. Epub 2021 Jan 25. Eur Radiol. 2021. PMID: 33492469
Cited by
-
Contemporary multimodality non-invasive cardiac imaging protocols for tetralogy of Fallot.Pediatr Radiol. 2024 Jun;54(7):1075-1092. doi: 10.1007/s00247-024-05942-4. Epub 2024 May 23. Pediatr Radiol. 2024. PMID: 38782776 Review.
References
-
- Meadows J, Powell AJ, Geva T, Dorfman A, Gauvreau K, Rhodes J. Cardiac magnetic resonance imaging correlates of exercise capacity in patients with surgically repaired tetralogy of Fallot. Am J Cardiol 2007;100(9):1446–1450. - PubMed
-
- Therrien J, Siu SC, McLaughlin PR, Liu PP, Williams WG, Webb GD. Pulmonary valve replacement in adults late after repair of tetralogy of fallot: are we operating too late? J Am Coll Cardiol 2000;36(5):1670–1675. - PubMed
LinkOut - more resources
Full Text Sources
