

Thin-Section Chest CT Imaging of COVID-19 Pneumonia: A Comparison Between Patients with Mild and Severe Disease
- PMID: 33778568
- PMCID: PMC7233444
- DOI: 10.1148/ryct.2020200126
Thin-Section Chest CT Imaging of COVID-19 Pneumonia: A Comparison Between Patients with Mild and Severe Disease
Abstract
Purpose: To compare radiologic characteristics of coronavirus disease 2019 (COVID-19) pneumonia at thin-section CT on admission between patients with mild and severe disease.
Materials and methods: Seventy patients with COVID-19 pneumonia who were admitted to Zhongnan Hospital of Wuhan University between January 20, 2020 and January 27, 2020 were enrolled. On the basis of the World Health Organization guidelines, 50 patients were categorized with the mild form and 20 with the severe form based on clinical conditions. Imaging features, clinical, and laboratory data were reviewed and compared.
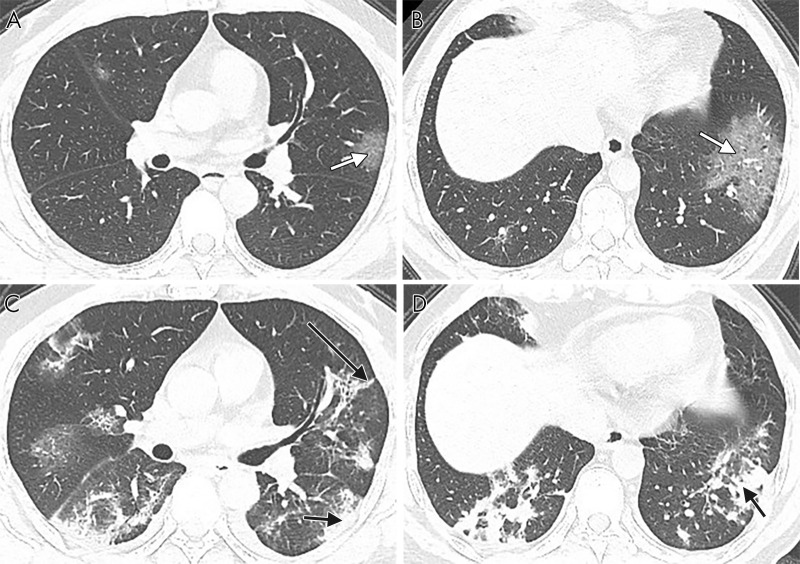
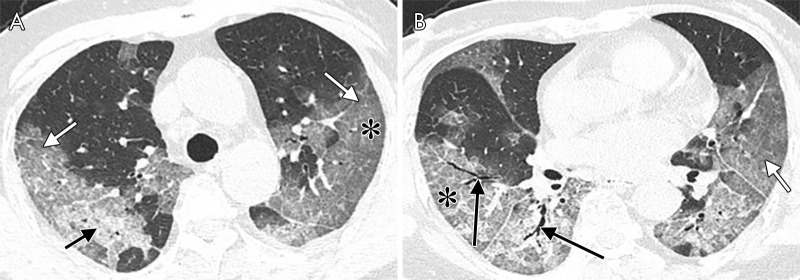
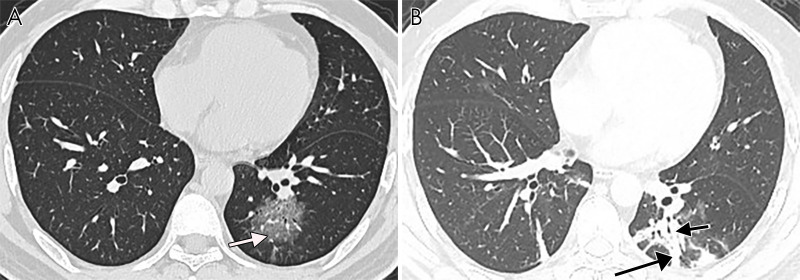
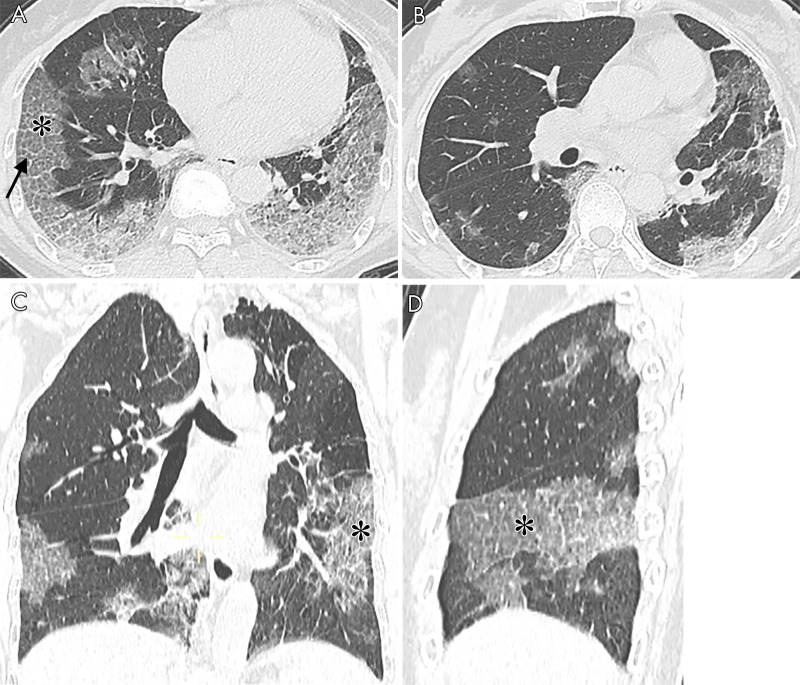
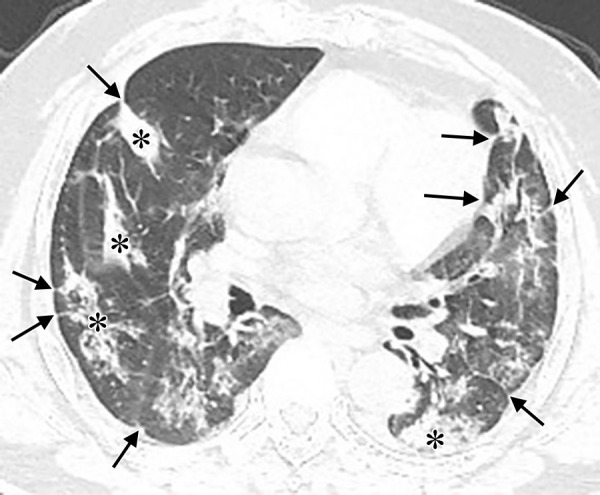
Results: Patients with the severe form (median age, 65 years; interquartile range [IQR]: 54.75-75.00 years) were older than those with the mild form of disease (median age, 42.5 years; IQR: 32.75-58.50 years) (P < .001). Patients with the severe form of disease had more lung segments involved (median number of segments: 17.5 vs 7.5, P ≤ .001) and also larger opacities (median number of segments with opacities measuring 3 cm to less than 50% of the lung segment: 5.5 vs 2.0, P = .006; ≥ 50% of lung segment: 7.5 vs 0.0, P < .001). They also had more interlobular septal thickening (75% vs 28%, P < .001), higher prevalence of air bronchograms (70% vs 32%, P = .004), and pleural effusions (40% vs 14%, P = .017).
Conclusion: Ground-glass opacities with or without consolidation in a peripheral and basilar predominant distribution were the most common findings in COVID-19 pneumonia. Patients with the severe form of the disease had more extensive opacification of the lung parenchyma than did patients with mild disease. Interlobular septal thickening, air bronchograms, and pleural effusions were also more prevalent in severe COVID-19.© RSNA, 2020.
2020 by the Radiological Society of North America, Inc.
Conflict of interest statement
Disclosures of Conflicts of Interest: M.Y. Activities related to the present article: institution received grant from and study supported by National Natural Science Foundation of China (grant no. 81771819). Activities not related to the present article: disclosed no relevant relationships. Other relationships: disclosed no relevant relationships. D.X. disclosed no relevant relationships. L.L. disclosed no relevant relationships. M.T. disclosed no relevant relationships. R.L. Activities related to the present article: institution received grant from and study supported by National Natural Science Foundation of China (grant no. 81771819). Activities not related to the present article: disclosed no relevant relationships. Other relationships: disclosed no relevant relationships. S.C. disclosed no relevant relationships. Y.C. disclosed no relevant relationships. L.X. Activities related to the present article: institution received grant from and study supported by National Natural Science Foundation of China (grant no. 81771819). Activities not related to the present article: disclosed no relevant relationships. Other relationships: disclosed no relevant relationships. M.L. Activities related to the present article: institution received grant from and study supported by National Natural Science Foundation of China (grant no. 81771819). Activities not related to the present article: disclosed no relevant relationships. Other relationships: disclosed no relevant relationships. X.Z. Activities related to the present article: institution received grant from and study supported by National Natural Science Foundation of China (grant no. 81771819). Activities not related to the present article: disclosed no relevant relationships. Other relationships: disclosed no relevant relationships. S.Y.X. disclosed no relevant relationships. Y.L. Activities related to the present article: author received National Key Research and Development Program of China grant (2018YFE0204502). Activities not related to the present article: disclosed no relevant relationships. Other relationships: disclosed no relevant relationships. H.X. disclosed no relevant relationships.
Figures
References
-
- World Health Organization. Global Surveillance for human infection with coronavirus disease (COVID-19). https://www.who.int/publications-detail/global-surveillance-for-human-in.... Published February 27, 2020. Updated March 20, 2020. Accessed March 25, 2020.
LinkOut - more resources
Full Text Sources
