. 2020 Apr 21;2(2):e200196.
doi: 10.1148/ryct.2020200196. eCollection 2020 Apr.

Accuracy and Reproducibility of Low-Dose Submillisievert Chest CT for the Diagnosis of COVID-19

Affiliations

Accuracy and Reproducibility of Low-Dose Submillisievert Chest CT for the Diagnosis of COVID-19

Anthony Dangis et al. Radiol Cardiothorac Imaging. .

Abstract

Purpose: To demonstrate the accuracy and reproducibility of low-dose submillisievert chest CT for the diagnosis of coronavirus disease 2019 (COVID-19) infection in patients in the emergency department.

Materials and methods: This was a Health Insurance Portability and Accountability Act-compliant, institutional review board-approved retrospective study. From March 14 to 24, 2020, 192 patients in the emergency department with symptoms suggestive of COVID-19 infection were studied by using low-dose chest CT and real-time reverse transcription polymerase chain reaction (RT-PCR). Image analysis included the likelihood of COVID-19 infection and the semiquantitative extent of lung involvement. CT images were analyzed by two radiologists blinded to the RT-PCR results. Reproducibility was assessed using the McNemar test and intraclass correlation coefficient. Time between CT acquisition and report was measured.

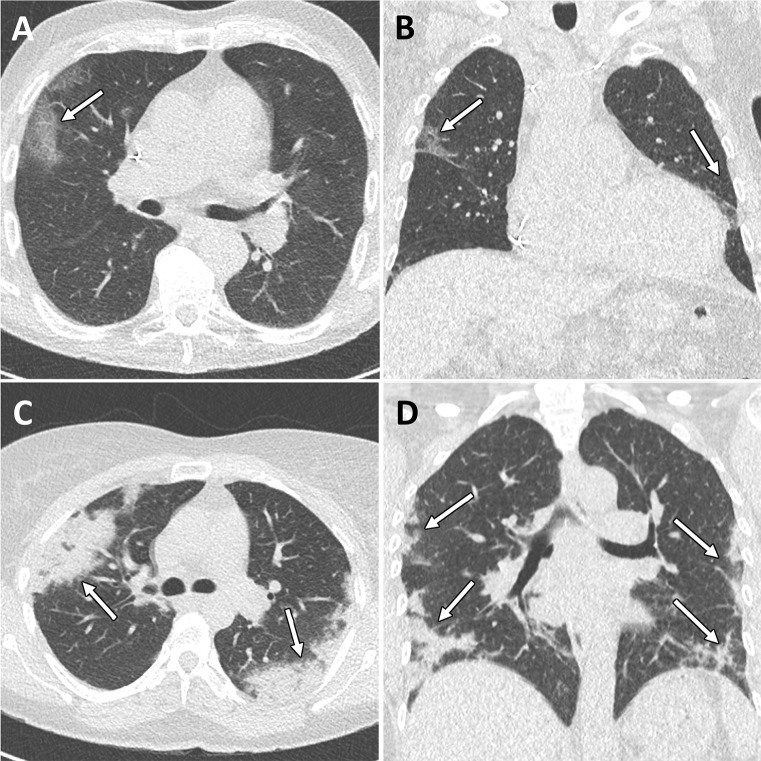
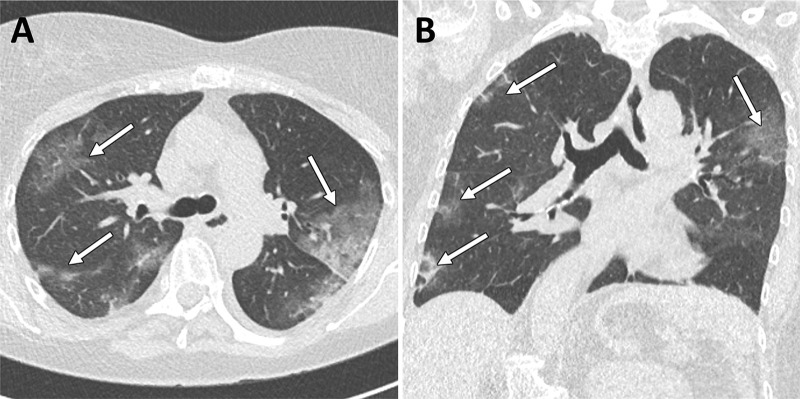
Results: When compared with RT-PCR, low-dose submillisievert chest CT demonstrated excellent sensitivity, specificity, positive predictive value, negative predictive value, and accuracy for diagnosis of COVID-19 (86.7%, 93.6%, 91.1%, 90.3%, and 90.2%, respectively), in particular in patients with clinical symptoms for more than 48 hours (95.6%, 93.2%, 91.5%, 96.5%, and 94.4%, respectively). In patients with a positive CT result, the likelihood of disease increased from 43.2% (pretest probability) to 91.1% or 91.4% (posttest probability), while in patients with a negative CT result, the likelihood of disease decreased to 9.6% or 3.7% for all patients or those with clinical symptoms for >48 hours. The prevalence of alternative diagnoses based on chest CT in patients without COVID-19 infection was 17.6%. The mean effective radiation dose was 0.56 mSv ± 0.25 (standard deviation). Median time between CT acquisition and report was 25 minutes (interquartile range: 13-49 minutes). Intra- and interreader reproducibility of CT was excellent (all intraclass correlation coefficients ≥ 0.95) without significant bias in the Bland-Altman analysis.

Conclusion: Low-dose submillisievert chest CT allows for rapid, accurate, and reproducible assessment of COVID-19 infection in patients in the emergency department, in particular in patients with symptoms lasting longer than 48 hours. Chest CT has the additional advantage of offering alternative diagnoses in a significant subset of patients.© RSNA, 2020.


Conflict of interest statement

Disclosures of Conflicts of Interest: A. Dangis disclosed no relevant relationships. C.G. disclosed no relevant relationships. Y.D.B. disclosed no relevant relationships. L.J. disclosed no relevant relationships. H.V. disclosed no relevant relationships. D.O. disclosed no relevant relationships. M.G. disclosed no relevant relationships. M.V.R. disclosed no relevant relationships. J.F. disclosed no relevant relationships. A. Demeyere disclosed no relevant relationships. R.S. disclosed no relevant relationships.

Figures

Example CT images in two patients with COVID-19. A, Axial and, B, coronal CT images in an 85-year-old woman presenting with dyspnea and fever for 3 days. CT images show typical early COVID-19 findings with bilateral subpleural areas of ground-glass opacities (arrows). Total CT involvement score was 7/25. Effective radiation dose was 0.52 mSv. C, Axial and, D, coronal CT images in a 41-year-old woman presenting with cough and fever for 14 days. CT images show typical late COVID-19 findings with multifocal bilateral subpleural areas of consolidation (arrows). Total CT involvement score was 15/25. Effective radiation dose was 0.53 mSv. Window center, −600 HU; window width, 1600 HU; slice thickness, 1 mm; and increment, 0.7 mm for all images.
Figure 1:
Example CT images in two patients with COVID-19. A, Axial and, B, coronal CT images in an 85-year-old woman presenting with dyspnea and fever for 3 days. CT images show typical early COVID-19 findings with bilateral subpleural areas of ground-glass opacities (arrows). Total CT involvement score was 7/25. Effective radiation dose was 0.52 mSv. C, Axial and, D, coronal CT images in a 41-year-old woman presenting with cough and fever for 14 days. CT images show typical late COVID-19 findings with multifocal bilateral subpleural areas of consolidation (arrows). Total CT involvement score was 15/25. Effective radiation dose was 0.53 mSv. Window center, −600 HU; window width, 1600 HU; slice thickness, 1 mm; and increment, 0.7 mm for all images.
Fagan nomogram for, A, all patients and, B, patients with clinical symptoms for more than 48 hours illustrates pretest and posttest probabilities based on the positive likelihood ratio and negative likelihood ratio of chest CT in patients with possible COVID-19 infection.
Figure 2:
Fagan nomogram for, A, all patients and, B, patients with clinical symptoms for more than 48 hours illustrates pretest and posttest probabilities based on the positive likelihood ratio and negative likelihood ratio of chest CT in patients with possible COVID-19 infection.
Example alternative diagnoses suggested by chest CT in patients with possible COVID-19 infection. A, Axial and, B, coronal CT images in a 59-year-old woman presenting with cough and fever for 7 days. CT images show lobar consolidation of the anterior segments of the left lower lobe with surrounding ground-glass opacities compatible with bacterial lobar pneumonia (arrows). Sputum culture confirmed Streptococcus pneumoniae pneumonia. C, Axial and, D, coronal CT images in a 53-year-old man presenting with cough and dyspnea for 3 weeks. CT images show an irregular mass in the right upper lobe with associated lymphangitic carcinomatosis and multiple hypodense liver lesions compatible with lung cancer with liver metastases (arrows). Biopsy results confirmed adenocarcinoma of the lung with liver metastases. E, F, Axial CT images in an 18-year-old woman presenting with cough and fever for 7 days. CT images show bilateral axillary lymphadenopathy and splenomegaly compatible with Epstein–Barr virus infection, which was confirmed by Epstein–Barr virus immunoglobulin M antibody detection (arrows). A–C, Window center, −600 HU; window width, 1600 HU; slice thickness, 1 mm; and increment, 0.7 mm. D–F, Window center, 40 HU; window width, 400 HU; slice thickness, 3 mm; and increment, 3 mm.
Figure 3:
Example alternative diagnoses suggested by chest CT in patients with possible COVID-19 infection. A, Axial and, B, coronal CT images in a 59-year-old woman presenting with cough and fever for 7 days. CT images show lobar consolidation of the anterior segments of the left lower lobe with surrounding ground-glass opacities compatible with bacterial lobar pneumonia (arrows). Sputum culture confirmed Streptococcus pneumoniae pneumonia. C, Axial and, D, coronal CT images in a 53-year-old man presenting with cough and dyspnea for 3 weeks. CT images show an irregular mass in the right upper lobe with associated lymphangitic carcinomatosis and multiple hypodense liver lesions compatible with lung cancer with liver metastases (arrows). Biopsy results confirmed adenocarcinoma of the lung with liver metastases. E, F, Axial CT images in an 18-year-old woman presenting with cough and fever for 7 days. CT images show bilateral axillary lymphadenopathy and splenomegaly compatible with Epstein–Barr virus infection, which was confirmed by Epstein–Barr virus immunoglobulin M antibody detection (arrows). A–C, Window center, −600 HU; window width, 1600 HU; slice thickness, 1 mm; and increment, 0.7 mm. D–F, Window center, 40 HU; window width, 400 HU; slice thickness, 3 mm; and increment, 3 mm.
Example images from a 60-year-old female patient with clinical and CT findings suggestive of COVID-19 infection but repeated negative RT-PCR analysis. A, Axial and, B, coronal CT images show typical bilateral subpleural areas of ground-glass opacities. The patient was considered to be probably COVID-19 positive and quarantined. Note the incidental finding of moderate thoracic dextroscoliosis. Window center, −600 HU; window width, 1600 HU; slice thickness, 1 mm; and increment, 0.7 mm for all images.
Figure 4:
Example images from a 60-year-old female patient with clinical and CT findings suggestive of COVID-19 infection but repeated negative RT-PCR analysis. A, Axial and, B, coronal CT images show typical bilateral subpleural areas of ground-glass opacities. The patient was considered to be probably COVID-19 positive and quarantined. Note the incidental finding of moderate thoracic dextroscoliosis. Window center, −600 HU; window width, 1600 HU; slice thickness, 1 mm; and increment, 0.7 mm for all images.

Similar articles

Cited by

References

    1. Corman VM, Muth D, Niemeyer D, Drosten C. Hosts and sources of endemic human coronaviruses. Adv Virus Res 2018;100:163–188. - PMC - PubMed
    1. Huang C, Wang Y, Li X, et al. Clinical features of patients infected with 2019 novel coronavirus in Wuhan, China. Lancet 2020;395(10223):497–506 [Published correction appears in Lancet 2020;395(10223):496.]. - PMC - PubMed
    1. World Health Organization . Coronavirus disease (COVID-19) outbreak. https://www.who.int/emergencies/diseases/novel-coronavirus-2019. 2020. Accessed April 15, 2020.
    1. Fang Y, Zhang H, Xie J, et al. Sensitivity of chest CT for COVID-19: comparison to RT-PCR. Radiology 2020 Feb 19:200432 [Epub ahead of print]. - PMC - PubMed
    1. Pan F, Ye T, Sun P, et al. Time course of lung changes on chest CT during recovery from 2019 novel coronavirus (COVID-19) pneumonia. Radiology 2020 Feb 13:200370 [Epub ahead of print]. - PMC - PubMed

LinkOut - more resources