Review
. 2020 Jan 31;2(1):e190024.
doi: 10.1148/rycan.2020190024. eCollection 2020 Jan.

MRI Assessment of Hepatocellular Carcinoma after Local-Regional Therapy: A Comprehensive Review

Affiliations
Review

MRI Assessment of Hepatocellular Carcinoma after Local-Regional Therapy: A Comprehensive Review

Mishal Mendiratta-Lala et al. Radiol Imaging Cancer. .

Abstract

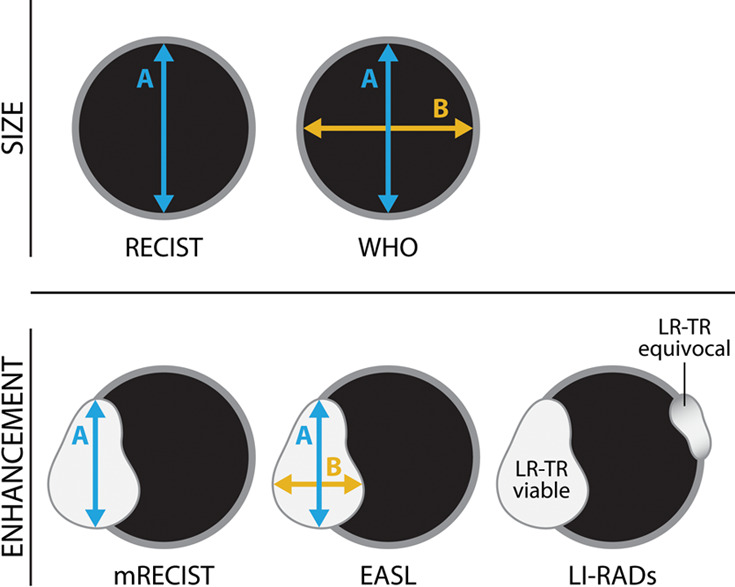
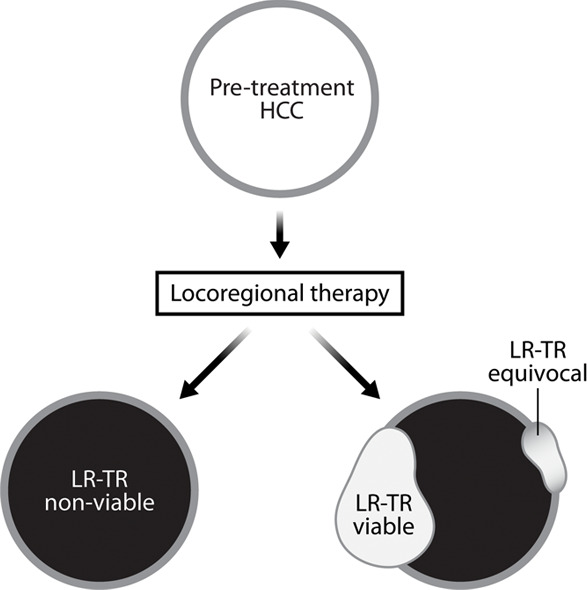
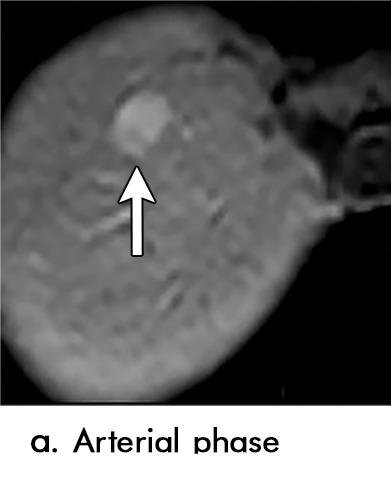
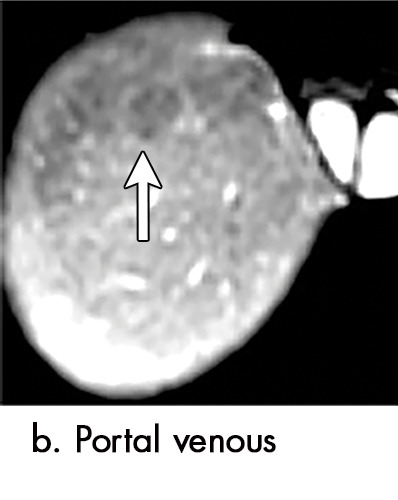
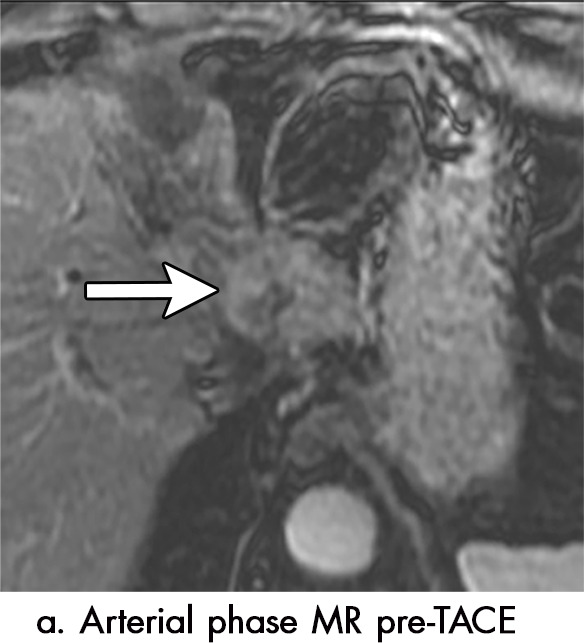
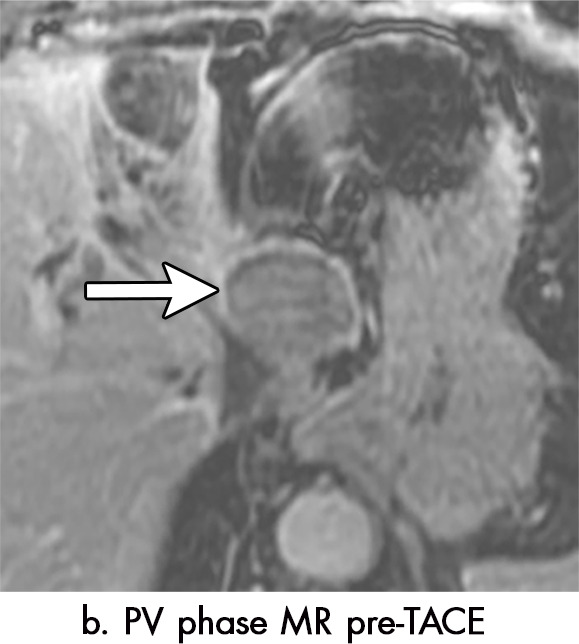
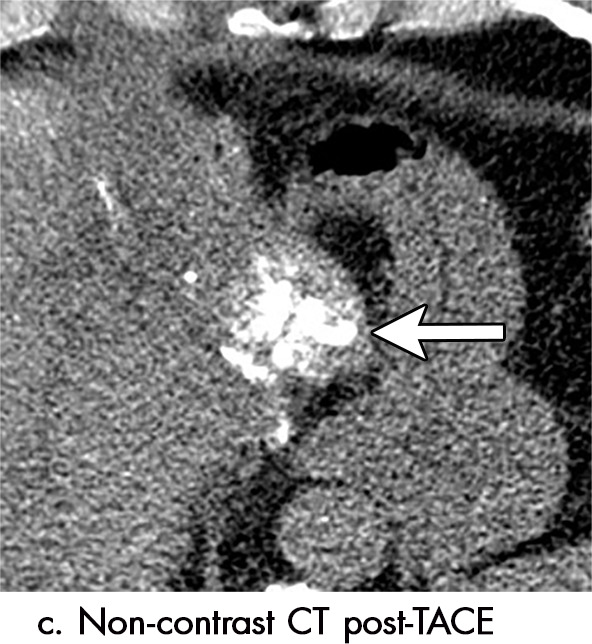
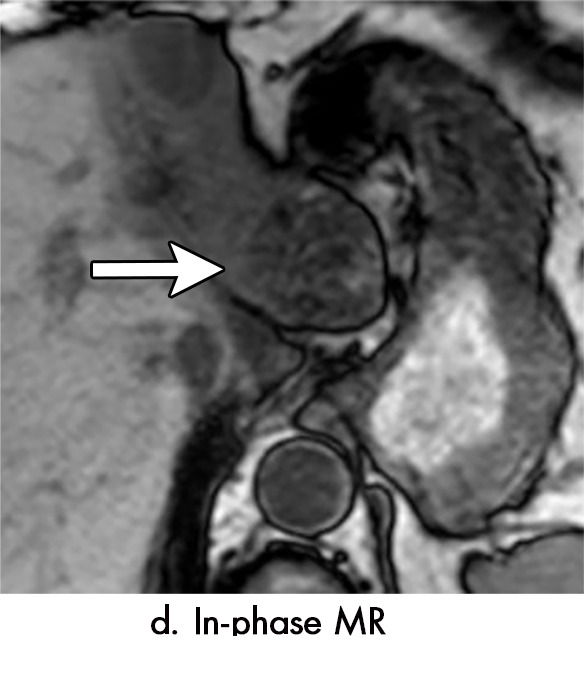
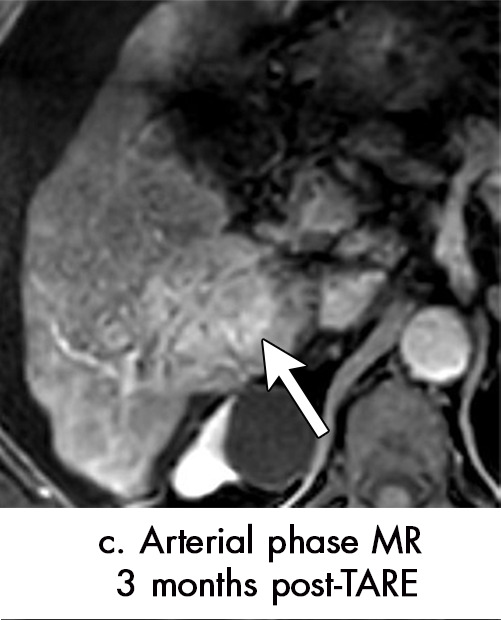
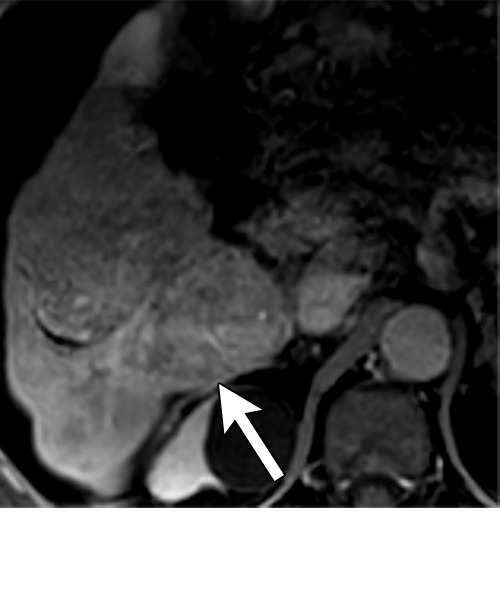
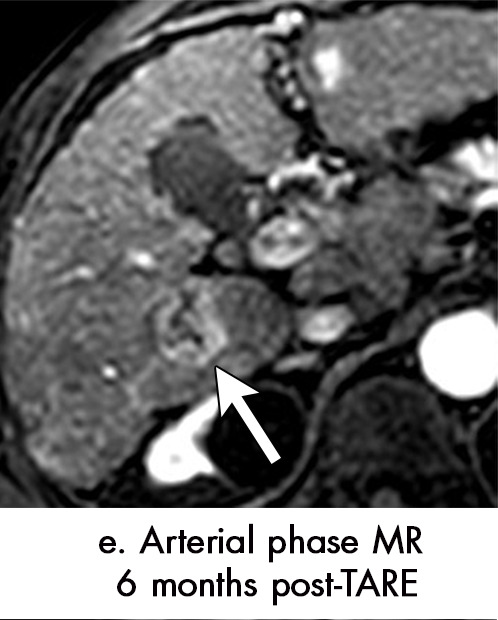
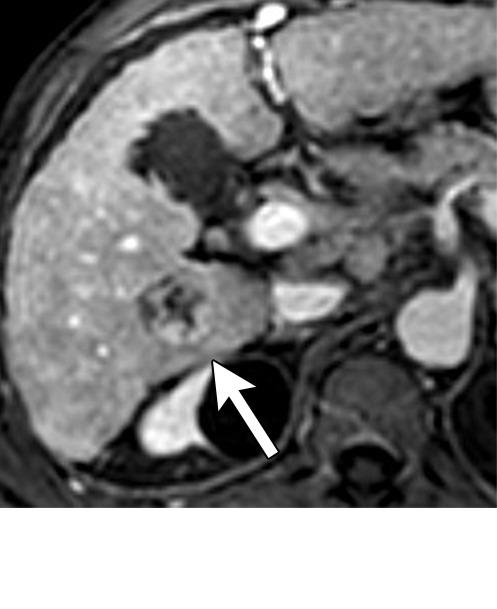
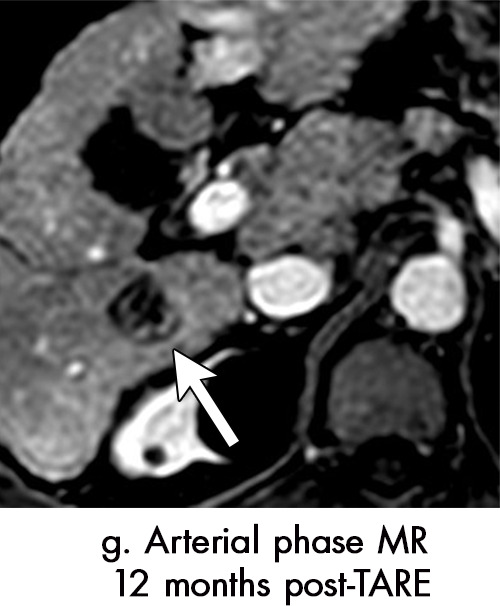
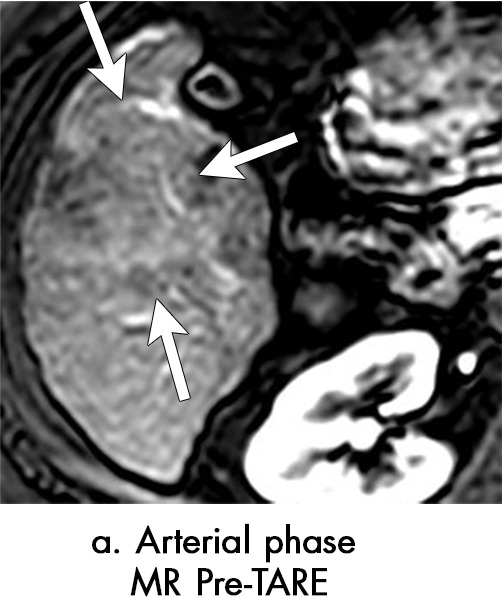
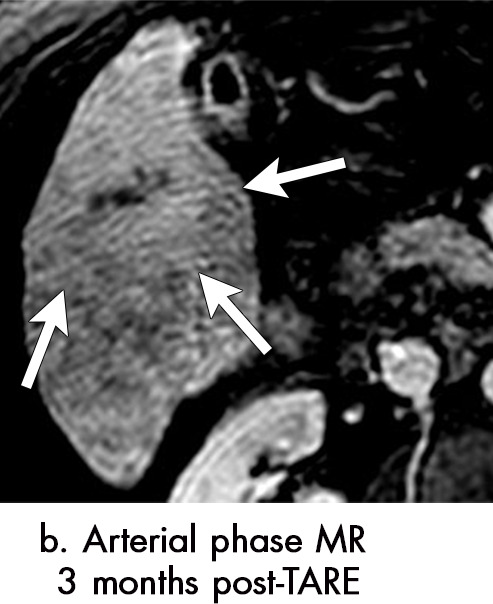
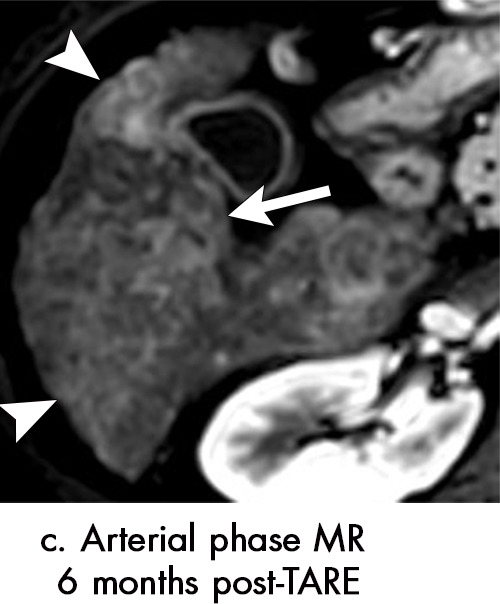
Nearly 80% of cirrhotic patients diagnosed with hepatocellular carcinoma (HCC) are not eligible for surgical resection and instead undergo local-regional treatment. After therapy for HCC, patients undergo imaging surveillance to assess treatment efficacy and identify potential sites of progressive tumor elsewhere within the liver. Accurate interpretation of posttreatment imaging is essential for guiding further management decisions, and radiologists must understand expected treatment-specific imaging findings for each of the local-regional therapies. Of interest, expected imaging findings seen after radiation-based therapies (transarterial radioembolization and stereotactic body radiation therapy) are different than those seen after thermal ablation and transarterial chemoembolization. Given differences in expected posttreatment imaging findings, the current radiologic treatment response assessment algorithms used for HCC (modified Response Evaluation Criteria in Solid Tumors classification, European Association for the Study of Liver Diseases criteria, and Liver Imaging and Reporting Data System Treatment Response Algorithm) must be applied cautiously for radiation-based therapies in which persistent arterial phase hyperenhancement in the early posttreatment period is common and expected. This article will review the concept of tumor response assessment for HCC, the forms of local-regional therapy for HCC, and the expected posttreatment findings for each form of therapy. Keywords: Abdomen/GI, Liver, MR-Imaging, Treatment Effects, Tumor Response © RSNA, 2020.


Conflict of interest statement

Disclosures of Conflicts of Interest: M.M. disclosed no relevant relationships. W.R.M. disclosed no relevant relationships. K.S. disclosed no relevant relationships. A.Z. disclosed no relevant relationships. A.S.J. disclosed no relevant relationships. S.M. disclosed no relevant relationships. A.A. disclosed no relevant relationships. K.E.M. Activities related to the present article: disclosed no relevant relationships. Activities not related to the present article: receives royalties from Wolters Kluwer and Elsevier. Other relationships: disclosed no relevant relationships. M.S.D. Activities related to the present article: disclosed no relevant relationships. Activities not related to the present article: receives royalties from Wolters Kluwer and uptodate.com. Other relationships: disclosed no relevant relationships.

Figures

Figure 1a:
Figure 1a:
(a) Current tumor response classification systems used to report tumor response after treatment. Size-based classification systems include World Health Organization (WHO) criteria (bidimensional) and RECIST (unidimensional), where the size of the treated lesion is measured, regardless of enhancement. Enhancement-based classification systems include EASL (bidimensional), mRECIST (unidimensional), and more recently, LI-RADs (presence or absence of enhancement), where the size of the residual enhancing component is measured for the former two. (b) The LI-RADS treatment response classification system is shown. EASL = European Association for the Study of Liver Diseases, HCC = hepatocellular carcinoma, LI-RAD = Liver Imaging and Reporting Data System, LR-TR = LI-RADS treatment response, mRECIST = modified RECIST, RECIST = Response Evaluation Criteria for Solid Tumors.
Figure 1b:
Figure 1b:
(a) Current tumor response classification systems used to report tumor response after treatment. Size-based classification systems include World Health Organization (WHO) criteria (bidimensional) and RECIST (unidimensional), where the size of the treated lesion is measured, regardless of enhancement. Enhancement-based classification systems include EASL (bidimensional), mRECIST (unidimensional), and more recently, LI-RADs (presence or absence of enhancement), where the size of the residual enhancing component is measured for the former two. (b) The LI-RADS treatment response classification system is shown. EASL = European Association for the Study of Liver Diseases, HCC = hepatocellular carcinoma, LI-RAD = Liver Imaging and Reporting Data System, LR-TR = LI-RADS treatment response, mRECIST = modified RECIST, RECIST = Response Evaluation Criteria for Solid Tumors.
Figure 2a:
Figure 2a:
Expected imaging findings after microwave ablation (MWA). Axial images from a 57-year-old woman with cirrhosis show a (a) 2.3-cm arterial enhancing lesion (arrow) with washout (b), consistent with hepatocellular carcinoma LI-RADS 5/OPTN 5B. (c) One month after MWA, the tumor size increased by more than 25%, with central T1 precontrast hyperintense signal secondary to coagulation necrosis after MWA. (d) Arterial phase imaging 1 month after MWA shows no residual central tumoral enhancement, confirmed with subtraction images (not shown) (mRECIST CR, LI-RADS TR nonviable). Peripheral rim of smooth continuous enhancement represents granulation tissue (arrowhead). (e) Image from 9 months after MWA shows the lesion regressed in size, with persistence of the thin smooth continuous peripheral rim of enhancement. CR = complete response, LI-RADS = Liver Imaging and Reporting Data System, mRECIST = modified Response Evaluation Criteria for Solid Tumors, OPTN = Organ Procurement and Transplantation Network, TR = treatment response.
Figure 2b:
Figure 2b:
Expected imaging findings after microwave ablation (MWA). Axial images from a 57-year-old woman with cirrhosis show a (a) 2.3-cm arterial enhancing lesion (arrow) with washout (b), consistent with hepatocellular carcinoma LI-RADS 5/OPTN 5B. (c) One month after MWA, the tumor size increased by more than 25%, with central T1 precontrast hyperintense signal secondary to coagulation necrosis after MWA. (d) Arterial phase imaging 1 month after MWA shows no residual central tumoral enhancement, confirmed with subtraction images (not shown) (mRECIST CR, LI-RADS TR nonviable). Peripheral rim of smooth continuous enhancement represents granulation tissue (arrowhead). (e) Image from 9 months after MWA shows the lesion regressed in size, with persistence of the thin smooth continuous peripheral rim of enhancement. CR = complete response, LI-RADS = Liver Imaging and Reporting Data System, mRECIST = modified Response Evaluation Criteria for Solid Tumors, OPTN = Organ Procurement and Transplantation Network, TR = treatment response.
Figure 2c:
Figure 2c:
Expected imaging findings after microwave ablation (MWA). Axial images from a 57-year-old woman with cirrhosis show a (a) 2.3-cm arterial enhancing lesion (arrow) with washout (b), consistent with hepatocellular carcinoma LI-RADS 5/OPTN 5B. (c) One month after MWA, the tumor size increased by more than 25%, with central T1 precontrast hyperintense signal secondary to coagulation necrosis after MWA. (d) Arterial phase imaging 1 month after MWA shows no residual central tumoral enhancement, confirmed with subtraction images (not shown) (mRECIST CR, LI-RADS TR nonviable). Peripheral rim of smooth continuous enhancement represents granulation tissue (arrowhead). (e) Image from 9 months after MWA shows the lesion regressed in size, with persistence of the thin smooth continuous peripheral rim of enhancement. CR = complete response, LI-RADS = Liver Imaging and Reporting Data System, mRECIST = modified Response Evaluation Criteria for Solid Tumors, OPTN = Organ Procurement and Transplantation Network, TR = treatment response.
Figure 2d:
Figure 2d:
Expected imaging findings after microwave ablation (MWA). Axial images from a 57-year-old woman with cirrhosis show a (a) 2.3-cm arterial enhancing lesion (arrow) with washout (b), consistent with hepatocellular carcinoma LI-RADS 5/OPTN 5B. (c) One month after MWA, the tumor size increased by more than 25%, with central T1 precontrast hyperintense signal secondary to coagulation necrosis after MWA. (d) Arterial phase imaging 1 month after MWA shows no residual central tumoral enhancement, confirmed with subtraction images (not shown) (mRECIST CR, LI-RADS TR nonviable). Peripheral rim of smooth continuous enhancement represents granulation tissue (arrowhead). (e) Image from 9 months after MWA shows the lesion regressed in size, with persistence of the thin smooth continuous peripheral rim of enhancement. CR = complete response, LI-RADS = Liver Imaging and Reporting Data System, mRECIST = modified Response Evaluation Criteria for Solid Tumors, OPTN = Organ Procurement and Transplantation Network, TR = treatment response.
Figure 2e:
Figure 2e:
Expected imaging findings after microwave ablation (MWA). Axial images from a 57-year-old woman with cirrhosis show a (a) 2.3-cm arterial enhancing lesion (arrow) with washout (b), consistent with hepatocellular carcinoma LI-RADS 5/OPTN 5B. (c) One month after MWA, the tumor size increased by more than 25%, with central T1 precontrast hyperintense signal secondary to coagulation necrosis after MWA. (d) Arterial phase imaging 1 month after MWA shows no residual central tumoral enhancement, confirmed with subtraction images (not shown) (mRECIST CR, LI-RADS TR nonviable). Peripheral rim of smooth continuous enhancement represents granulation tissue (arrowhead). (e) Image from 9 months after MWA shows the lesion regressed in size, with persistence of the thin smooth continuous peripheral rim of enhancement. CR = complete response, LI-RADS = Liver Imaging and Reporting Data System, mRECIST = modified Response Evaluation Criteria for Solid Tumors, OPTN = Organ Procurement and Transplantation Network, TR = treatment response.
Figure 3a:
Figure 3a:
Evolution of imaging findings after microwave ablation (MWA) with subsequent recurrent disease. Images from a 62-year-old woman with biopsy-proven hepatocellular carcinoma (HCC) (arrow). (a) A 3.0-cm peripheral arterial enhancing lesion with central hypoenhancement pretreatment, compatible with an LR M lesion. (b) One month after MWA therapy there was an expected increase in size of the treated lesion with a complete lack of central enhancement, consistent with treated HCC (mRECIST CR, LI-RADS TR nonviable). Adjacent to the ablation zone there was a peripheral wedge-shaped area of arterial phase hyperenhancement (arrowhead) which persists on the portal venous phase without washout (c), favored to represent posttreatment perfusional changes. (d) Twelve months after ablation, the treated HCC continues to decrease in size with no central enhancement. However, there is a large nodular area of arterial enhancement (arrowhead in d) demonstrating washout (arrowhead in e), compatible with recurrent HCC (mRECIST PD, LI-RADS TR viable). CR = complete response, LI-RADS = Liver Imaging and Reporting Data System, mRECIST = modified Response Evaluation Criteria for Solid Tumors, PD = progressive disease, TR = treatment response.
Figure 3b:
Figure 3b:
Evolution of imaging findings after microwave ablation (MWA) with subsequent recurrent disease. Images from a 62-year-old woman with biopsy-proven hepatocellular carcinoma (HCC) (arrow). (a) A 3.0-cm peripheral arterial enhancing lesion with central hypoenhancement pretreatment, compatible with an LR M lesion. (b) One month after MWA therapy there was an expected increase in size of the treated lesion with a complete lack of central enhancement, consistent with treated HCC (mRECIST CR, LI-RADS TR nonviable). Adjacent to the ablation zone there was a peripheral wedge-shaped area of arterial phase hyperenhancement (arrowhead) which persists on the portal venous phase without washout (c), favored to represent posttreatment perfusional changes. (d) Twelve months after ablation, the treated HCC continues to decrease in size with no central enhancement. However, there is a large nodular area of arterial enhancement (arrowhead in d) demonstrating washout (arrowhead in e), compatible with recurrent HCC (mRECIST PD, LI-RADS TR viable). CR = complete response, LI-RADS = Liver Imaging and Reporting Data System, mRECIST = modified Response Evaluation Criteria for Solid Tumors, PD = progressive disease, TR = treatment response.
Figure 3c:
Figure 3c:
Evolution of imaging findings after microwave ablation (MWA) with subsequent recurrent disease. Images from a 62-year-old woman with biopsy-proven hepatocellular carcinoma (HCC) (arrow). (a) A 3.0-cm peripheral arterial enhancing lesion with central hypoenhancement pretreatment, compatible with an LR M lesion. (b) One month after MWA therapy there was an expected increase in size of the treated lesion with a complete lack of central enhancement, consistent with treated HCC (mRECIST CR, LI-RADS TR nonviable). Adjacent to the ablation zone there was a peripheral wedge-shaped area of arterial phase hyperenhancement (arrowhead) which persists on the portal venous phase without washout (c), favored to represent posttreatment perfusional changes. (d) Twelve months after ablation, the treated HCC continues to decrease in size with no central enhancement. However, there is a large nodular area of arterial enhancement (arrowhead in d) demonstrating washout (arrowhead in e), compatible with recurrent HCC (mRECIST PD, LI-RADS TR viable). CR = complete response, LI-RADS = Liver Imaging and Reporting Data System, mRECIST = modified Response Evaluation Criteria for Solid Tumors, PD = progressive disease, TR = treatment response.
Figure 3d:
Figure 3d:
Evolution of imaging findings after microwave ablation (MWA) with subsequent recurrent disease. Images from a 62-year-old woman with biopsy-proven hepatocellular carcinoma (HCC) (arrow). (a) A 3.0-cm peripheral arterial enhancing lesion with central hypoenhancement pretreatment, compatible with an LR M lesion. (b) One month after MWA therapy there was an expected increase in size of the treated lesion with a complete lack of central enhancement, consistent with treated HCC (mRECIST CR, LI-RADS TR nonviable). Adjacent to the ablation zone there was a peripheral wedge-shaped area of arterial phase hyperenhancement (arrowhead) which persists on the portal venous phase without washout (c), favored to represent posttreatment perfusional changes. (d) Twelve months after ablation, the treated HCC continues to decrease in size with no central enhancement. However, there is a large nodular area of arterial enhancement (arrowhead in d) demonstrating washout (arrowhead in e), compatible with recurrent HCC (mRECIST PD, LI-RADS TR viable). CR = complete response, LI-RADS = Liver Imaging and Reporting Data System, mRECIST = modified Response Evaluation Criteria for Solid Tumors, PD = progressive disease, TR = treatment response.
Figure 3e:
Figure 3e:
Evolution of imaging findings after microwave ablation (MWA) with subsequent recurrent disease. Images from a 62-year-old woman with biopsy-proven hepatocellular carcinoma (HCC) (arrow). (a) A 3.0-cm peripheral arterial enhancing lesion with central hypoenhancement pretreatment, compatible with an LR M lesion. (b) One month after MWA therapy there was an expected increase in size of the treated lesion with a complete lack of central enhancement, consistent with treated HCC (mRECIST CR, LI-RADS TR nonviable). Adjacent to the ablation zone there was a peripheral wedge-shaped area of arterial phase hyperenhancement (arrowhead) which persists on the portal venous phase without washout (c), favored to represent posttreatment perfusional changes. (d) Twelve months after ablation, the treated HCC continues to decrease in size with no central enhancement. However, there is a large nodular area of arterial enhancement (arrowhead in d) demonstrating washout (arrowhead in e), compatible with recurrent HCC (mRECIST PD, LI-RADS TR viable). CR = complete response, LI-RADS = Liver Imaging and Reporting Data System, mRECIST = modified Response Evaluation Criteria for Solid Tumors, PD = progressive disease, TR = treatment response.
Figure 4a:
Figure 4a:
Multiple different MRI appearances seen after transarterial chemoembolization (TACE) therapy of hepatocellular carcinoma (HCC) (arrow in a and d) in three different patients (b and c in the same patient). (a) Axial T1-weighted postcontrast fat-suppressed image 1 month after TACE therapy shows a smooth continuous rim of arterial phase hyperenhancement (APHE), an expected posttreatment finding. There was no central APHE, consistent with treated tumor (mRECIST CR, LR-TR nonviable). (b) Axial T2-weighted image 1 month after TACE therapy shows high signal with a fluid-fluid level (arrow in b and c) within the treatment cavity with corresponding T1 precontrast hypointense signal (c), compatible with TACE liquefaction necrosis after treatment. Additionally, the lesion has areas of T2 hypointense signal (* in b) and T1 hyperintense signal (* in c) in other areas of the treated lesion. (d) Axial T1-weighted precontrast fat-suppressed image 1 month after TACE shows intrinsic hyperintense signal in the treated lesion, which did not enhance (confirmed on subtraction images, not shown), thus consistent with nonviable treated HCC. CR = complete response, LR = LI-RADS, mRECIST = modified Response Evaluation Criteria for Solid Tumors, TR = treatment response.
Figure 4b:
Figure 4b:
Multiple different MRI appearances seen after transarterial chemoembolization (TACE) therapy of hepatocellular carcinoma (HCC) (arrow in a and d) in three different patients (b and c in the same patient). (a) Axial T1-weighted postcontrast fat-suppressed image 1 month after TACE therapy shows a smooth continuous rim of arterial phase hyperenhancement (APHE), an expected posttreatment finding. There was no central APHE, consistent with treated tumor (mRECIST CR, LR-TR nonviable). (b) Axial T2-weighted image 1 month after TACE therapy shows high signal with a fluid-fluid level (arrow in b and c) within the treatment cavity with corresponding T1 precontrast hypointense signal (c), compatible with TACE liquefaction necrosis after treatment. Additionally, the lesion has areas of T2 hypointense signal (* in b) and T1 hyperintense signal (* in c) in other areas of the treated lesion. (d) Axial T1-weighted precontrast fat-suppressed image 1 month after TACE shows intrinsic hyperintense signal in the treated lesion, which did not enhance (confirmed on subtraction images, not shown), thus consistent with nonviable treated HCC. CR = complete response, LR = LI-RADS, mRECIST = modified Response Evaluation Criteria for Solid Tumors, TR = treatment response.
Figure 4c:
Figure 4c:
Multiple different MRI appearances seen after transarterial chemoembolization (TACE) therapy of hepatocellular carcinoma (HCC) (arrow in a and d) in three different patients (b and c in the same patient). (a) Axial T1-weighted postcontrast fat-suppressed image 1 month after TACE therapy shows a smooth continuous rim of arterial phase hyperenhancement (APHE), an expected posttreatment finding. There was no central APHE, consistent with treated tumor (mRECIST CR, LR-TR nonviable). (b) Axial T2-weighted image 1 month after TACE therapy shows high signal with a fluid-fluid level (arrow in b and c) within the treatment cavity with corresponding T1 precontrast hypointense signal (c), compatible with TACE liquefaction necrosis after treatment. Additionally, the lesion has areas of T2 hypointense signal (* in b) and T1 hyperintense signal (* in c) in other areas of the treated lesion. (d) Axial T1-weighted precontrast fat-suppressed image 1 month after TACE shows intrinsic hyperintense signal in the treated lesion, which did not enhance (confirmed on subtraction images, not shown), thus consistent with nonviable treated HCC. CR = complete response, LR = LI-RADS, mRECIST = modified Response Evaluation Criteria for Solid Tumors, TR = treatment response.
Figure 4d:
Figure 4d:
Multiple different MRI appearances seen after transarterial chemoembolization (TACE) therapy of hepatocellular carcinoma (HCC) (arrow in a and d) in three different patients (b and c in the same patient). (a) Axial T1-weighted postcontrast fat-suppressed image 1 month after TACE therapy shows a smooth continuous rim of arterial phase hyperenhancement (APHE), an expected posttreatment finding. There was no central APHE, consistent with treated tumor (mRECIST CR, LR-TR nonviable). (b) Axial T2-weighted image 1 month after TACE therapy shows high signal with a fluid-fluid level (arrow in b and c) within the treatment cavity with corresponding T1 precontrast hypointense signal (c), compatible with TACE liquefaction necrosis after treatment. Additionally, the lesion has areas of T2 hypointense signal (* in b) and T1 hyperintense signal (* in c) in other areas of the treated lesion. (d) Axial T1-weighted precontrast fat-suppressed image 1 month after TACE shows intrinsic hyperintense signal in the treated lesion, which did not enhance (confirmed on subtraction images, not shown), thus consistent with nonviable treated HCC. CR = complete response, LR = LI-RADS, mRECIST = modified Response Evaluation Criteria for Solid Tumors, TR = treatment response.
Figure 5a:
Figure 5a:
Imaging findings seen after transarterial chemoembolization (TACE) therapy with residual disease. Axial images from a 59-year-old woman with LR 5/OPTN 5B hepatocellular carcinoma (arrow). (a) A 3.8-cm arterial phase hyperenhancement hepatocellular carcinoma with washout (b) at pretreatment imaging. (c) Noncontrast CT image confirms ethiodized oil within the entire volume of tumor at immediate posttreatment imaging. (d) One month after TACE, the treatment cavity was unchanged in size, with loss of signal on the out-of-phase images, when compared with in-phase images (e). (f) Arterial phase postcontrast images 1 month after TACE demonstrate peripheral nodular enhancement, with washout (not shown), confirmed on subtraction images, with some central areas of necrosis (*), compatible with residual disease (mRECIST PR, LR-TR viable). LR = LI-RADS, mRECIST = modified Response Evaluation Criteria for Solid Tumors, OPTN = Organ Procurement and Transplantation Network, PR = partial response, PV = portal venous, TR = treatment response.
Figure 5b:
Figure 5b:
Imaging findings seen after transarterial chemoembolization (TACE) therapy with residual disease. Axial images from a 59-year-old woman with LR 5/OPTN 5B hepatocellular carcinoma (arrow). (a) A 3.8-cm arterial phase hyperenhancement hepatocellular carcinoma with washout (b) at pretreatment imaging. (c) Noncontrast CT image confirms ethiodized oil within the entire volume of tumor at immediate posttreatment imaging. (d) One month after TACE, the treatment cavity was unchanged in size, with loss of signal on the out-of-phase images, when compared with in-phase images (e). (f) Arterial phase postcontrast images 1 month after TACE demonstrate peripheral nodular enhancement, with washout (not shown), confirmed on subtraction images, with some central areas of necrosis (*), compatible with residual disease (mRECIST PR, LR-TR viable). LR = LI-RADS, mRECIST = modified Response Evaluation Criteria for Solid Tumors, OPTN = Organ Procurement and Transplantation Network, PR = partial response, PV = portal venous, TR = treatment response.
Figure 5c:
Figure 5c:
Imaging findings seen after transarterial chemoembolization (TACE) therapy with residual disease. Axial images from a 59-year-old woman with LR 5/OPTN 5B hepatocellular carcinoma (arrow). (a) A 3.8-cm arterial phase hyperenhancement hepatocellular carcinoma with washout (b) at pretreatment imaging. (c) Noncontrast CT image confirms ethiodized oil within the entire volume of tumor at immediate posttreatment imaging. (d) One month after TACE, the treatment cavity was unchanged in size, with loss of signal on the out-of-phase images, when compared with in-phase images (e). (f) Arterial phase postcontrast images 1 month after TACE demonstrate peripheral nodular enhancement, with washout (not shown), confirmed on subtraction images, with some central areas of necrosis (*), compatible with residual disease (mRECIST PR, LR-TR viable). LR = LI-RADS, mRECIST = modified Response Evaluation Criteria for Solid Tumors, OPTN = Organ Procurement and Transplantation Network, PR = partial response, PV = portal venous, TR = treatment response.
Figure 5d:
Figure 5d:
Imaging findings seen after transarterial chemoembolization (TACE) therapy with residual disease. Axial images from a 59-year-old woman with LR 5/OPTN 5B hepatocellular carcinoma (arrow). (a) A 3.8-cm arterial phase hyperenhancement hepatocellular carcinoma with washout (b) at pretreatment imaging. (c) Noncontrast CT image confirms ethiodized oil within the entire volume of tumor at immediate posttreatment imaging. (d) One month after TACE, the treatment cavity was unchanged in size, with loss of signal on the out-of-phase images, when compared with in-phase images (e). (f) Arterial phase postcontrast images 1 month after TACE demonstrate peripheral nodular enhancement, with washout (not shown), confirmed on subtraction images, with some central areas of necrosis (*), compatible with residual disease (mRECIST PR, LR-TR viable). LR = LI-RADS, mRECIST = modified Response Evaluation Criteria for Solid Tumors, OPTN = Organ Procurement and Transplantation Network, PR = partial response, PV = portal venous, TR = treatment response.
Figure 5e:
Figure 5e:
Imaging findings seen after transarterial chemoembolization (TACE) therapy with residual disease. Axial images from a 59-year-old woman with LR 5/OPTN 5B hepatocellular carcinoma (arrow). (a) A 3.8-cm arterial phase hyperenhancement hepatocellular carcinoma with washout (b) at pretreatment imaging. (c) Noncontrast CT image confirms ethiodized oil within the entire volume of tumor at immediate posttreatment imaging. (d) One month after TACE, the treatment cavity was unchanged in size, with loss of signal on the out-of-phase images, when compared with in-phase images (e). (f) Arterial phase postcontrast images 1 month after TACE demonstrate peripheral nodular enhancement, with washout (not shown), confirmed on subtraction images, with some central areas of necrosis (*), compatible with residual disease (mRECIST PR, LR-TR viable). LR = LI-RADS, mRECIST = modified Response Evaluation Criteria for Solid Tumors, OPTN = Organ Procurement and Transplantation Network, PR = partial response, PV = portal venous, TR = treatment response.
Figure 5f:
Figure 5f:
Imaging findings seen after transarterial chemoembolization (TACE) therapy with residual disease. Axial images from a 59-year-old woman with LR 5/OPTN 5B hepatocellular carcinoma (arrow). (a) A 3.8-cm arterial phase hyperenhancement hepatocellular carcinoma with washout (b) at pretreatment imaging. (c) Noncontrast CT image confirms ethiodized oil within the entire volume of tumor at immediate posttreatment imaging. (d) One month after TACE, the treatment cavity was unchanged in size, with loss of signal on the out-of-phase images, when compared with in-phase images (e). (f) Arterial phase postcontrast images 1 month after TACE demonstrate peripheral nodular enhancement, with washout (not shown), confirmed on subtraction images, with some central areas of necrosis (*), compatible with residual disease (mRECIST PR, LR-TR viable). LR = LI-RADS, mRECIST = modified Response Evaluation Criteria for Solid Tumors, OPTN = Organ Procurement and Transplantation Network, PR = partial response, PV = portal venous, TR = treatment response.
Figure 6a:
Figure 6a:
Persistent tumoral enhancement (diffuse central, nodular central, or peripheral) after transarterial radioembolization (TARE) in a 67-year-old man. (a) Axial arterial phase pretreatment MR image demonstrates a 7.2-cm LI-RADS 5/OPTN 5× hepatocellular carcinoma (arrow) with arterial phase hyperenhancement (APHE), “washout” and “capsule” (b). (c) Axial arterial phase MR image 3 months after TARE shows the tumor is unchanged in size with persistent diffuse central APHE, “washout” and “capsule” (d) (mRECIST SD, LR-TR equivocal vs nonviable). (e) Six months after TARE therapy, the tumor measures 3.3 cm with decreasing central enhancement and persistent peripheral nodular APHE, seen at arterial phase MRI, which persists at portal venous (PV) phase of imaging (f) (mRECIST PR, LR-TR nonviable). (g) Twelve months after TARE, the tumor continues to decrease in size, measuring 3.0 cm, with no residual tumoral enhancement, confirmed with subtraction imaging (mRECIST CR, LR-TR nonviable). CR = complete response, LR = LI-RADS, mRECIST = modified Response Evaluation Criteria for Solid Tumors, OPTN = Organ Procurement and Transplantation Network, SD = stable disease, TR = treatment response.
Figure 6b:
Figure 6b:
Persistent tumoral enhancement (diffuse central, nodular central, or peripheral) after transarterial radioembolization (TARE) in a 67-year-old man. (a) Axial arterial phase pretreatment MR image demonstrates a 7.2-cm LI-RADS 5/OPTN 5× hepatocellular carcinoma (arrow) with arterial phase hyperenhancement (APHE), “washout” and “capsule” (b). (c) Axial arterial phase MR image 3 months after TARE shows the tumor is unchanged in size with persistent diffuse central APHE, “washout” and “capsule” (d) (mRECIST SD, LR-TR equivocal vs nonviable). (e) Six months after TARE therapy, the tumor measures 3.3 cm with decreasing central enhancement and persistent peripheral nodular APHE, seen at arterial phase MRI, which persists at portal venous (PV) phase of imaging (f) (mRECIST PR, LR-TR nonviable). (g) Twelve months after TARE, the tumor continues to decrease in size, measuring 3.0 cm, with no residual tumoral enhancement, confirmed with subtraction imaging (mRECIST CR, LR-TR nonviable). CR = complete response, LR = LI-RADS, mRECIST = modified Response Evaluation Criteria for Solid Tumors, OPTN = Organ Procurement and Transplantation Network, SD = stable disease, TR = treatment response.
Figure 6c:
Figure 6c:
Persistent tumoral enhancement (diffuse central, nodular central, or peripheral) after transarterial radioembolization (TARE) in a 67-year-old man. (a) Axial arterial phase pretreatment MR image demonstrates a 7.2-cm LI-RADS 5/OPTN 5× hepatocellular carcinoma (arrow) with arterial phase hyperenhancement (APHE), “washout” and “capsule” (b). (c) Axial arterial phase MR image 3 months after TARE shows the tumor is unchanged in size with persistent diffuse central APHE, “washout” and “capsule” (d) (mRECIST SD, LR-TR equivocal vs nonviable). (e) Six months after TARE therapy, the tumor measures 3.3 cm with decreasing central enhancement and persistent peripheral nodular APHE, seen at arterial phase MRI, which persists at portal venous (PV) phase of imaging (f) (mRECIST PR, LR-TR nonviable). (g) Twelve months after TARE, the tumor continues to decrease in size, measuring 3.0 cm, with no residual tumoral enhancement, confirmed with subtraction imaging (mRECIST CR, LR-TR nonviable). CR = complete response, LR = LI-RADS, mRECIST = modified Response Evaluation Criteria for Solid Tumors, OPTN = Organ Procurement and Transplantation Network, SD = stable disease, TR = treatment response.
Figure 6d:
Figure 6d:
Persistent tumoral enhancement (diffuse central, nodular central, or peripheral) after transarterial radioembolization (TARE) in a 67-year-old man. (a) Axial arterial phase pretreatment MR image demonstrates a 7.2-cm LI-RADS 5/OPTN 5× hepatocellular carcinoma (arrow) with arterial phase hyperenhancement (APHE), “washout” and “capsule” (b). (c) Axial arterial phase MR image 3 months after TARE shows the tumor is unchanged in size with persistent diffuse central APHE, “washout” and “capsule” (d) (mRECIST SD, LR-TR equivocal vs nonviable). (e) Six months after TARE therapy, the tumor measures 3.3 cm with decreasing central enhancement and persistent peripheral nodular APHE, seen at arterial phase MRI, which persists at portal venous (PV) phase of imaging (f) (mRECIST PR, LR-TR nonviable). (g) Twelve months after TARE, the tumor continues to decrease in size, measuring 3.0 cm, with no residual tumoral enhancement, confirmed with subtraction imaging (mRECIST CR, LR-TR nonviable). CR = complete response, LR = LI-RADS, mRECIST = modified Response Evaluation Criteria for Solid Tumors, OPTN = Organ Procurement and Transplantation Network, SD = stable disease, TR = treatment response.
Figure 6e:
Figure 6e:
Persistent tumoral enhancement (diffuse central, nodular central, or peripheral) after transarterial radioembolization (TARE) in a 67-year-old man. (a) Axial arterial phase pretreatment MR image demonstrates a 7.2-cm LI-RADS 5/OPTN 5× hepatocellular carcinoma (arrow) with arterial phase hyperenhancement (APHE), “washout” and “capsule” (b). (c) Axial arterial phase MR image 3 months after TARE shows the tumor is unchanged in size with persistent diffuse central APHE, “washout” and “capsule” (d) (mRECIST SD, LR-TR equivocal vs nonviable). (e) Six months after TARE therapy, the tumor measures 3.3 cm with decreasing central enhancement and persistent peripheral nodular APHE, seen at arterial phase MRI, which persists at portal venous (PV) phase of imaging (f) (mRECIST PR, LR-TR nonviable). (g) Twelve months after TARE, the tumor continues to decrease in size, measuring 3.0 cm, with no residual tumoral enhancement, confirmed with subtraction imaging (mRECIST CR, LR-TR nonviable). CR = complete response, LR = LI-RADS, mRECIST = modified Response Evaluation Criteria for Solid Tumors, OPTN = Organ Procurement and Transplantation Network, SD = stable disease, TR = treatment response.
Figure 6f:
Figure 6f:
Persistent tumoral enhancement (diffuse central, nodular central, or peripheral) after transarterial radioembolization (TARE) in a 67-year-old man. (a) Axial arterial phase pretreatment MR image demonstrates a 7.2-cm LI-RADS 5/OPTN 5× hepatocellular carcinoma (arrow) with arterial phase hyperenhancement (APHE), “washout” and “capsule” (b). (c) Axial arterial phase MR image 3 months after TARE shows the tumor is unchanged in size with persistent diffuse central APHE, “washout” and “capsule” (d) (mRECIST SD, LR-TR equivocal vs nonviable). (e) Six months after TARE therapy, the tumor measures 3.3 cm with decreasing central enhancement and persistent peripheral nodular APHE, seen at arterial phase MRI, which persists at portal venous (PV) phase of imaging (f) (mRECIST PR, LR-TR nonviable). (g) Twelve months after TARE, the tumor continues to decrease in size, measuring 3.0 cm, with no residual tumoral enhancement, confirmed with subtraction imaging (mRECIST CR, LR-TR nonviable). CR = complete response, LR = LI-RADS, mRECIST = modified Response Evaluation Criteria for Solid Tumors, OPTN = Organ Procurement and Transplantation Network, SD = stable disease, TR = treatment response.
Figure 6g:
Figure 6g:
Persistent tumoral enhancement (diffuse central, nodular central, or peripheral) after transarterial radioembolization (TARE) in a 67-year-old man. (a) Axial arterial phase pretreatment MR image demonstrates a 7.2-cm LI-RADS 5/OPTN 5× hepatocellular carcinoma (arrow) with arterial phase hyperenhancement (APHE), “washout” and “capsule” (b). (c) Axial arterial phase MR image 3 months after TARE shows the tumor is unchanged in size with persistent diffuse central APHE, “washout” and “capsule” (d) (mRECIST SD, LR-TR equivocal vs nonviable). (e) Six months after TARE therapy, the tumor measures 3.3 cm with decreasing central enhancement and persistent peripheral nodular APHE, seen at arterial phase MRI, which persists at portal venous (PV) phase of imaging (f) (mRECIST PR, LR-TR nonviable). (g) Twelve months after TARE, the tumor continues to decrease in size, measuring 3.0 cm, with no residual tumoral enhancement, confirmed with subtraction imaging (mRECIST CR, LR-TR nonviable). CR = complete response, LR = LI-RADS, mRECIST = modified Response Evaluation Criteria for Solid Tumors, OPTN = Organ Procurement and Transplantation Network, SD = stable disease, TR = treatment response.
Figure 7a:
Figure 7a:
Axial MR images show various enhancement patterns after transarterial radioembolization (TARE) therapy in (a–d) a 56-year-old man, (e–f) an 82-year-old man, and (g–h) a 65-year-old woman. Geographic peritumoral arterial enhancement: (a) Pretreatment arterial phase MR image shows a 6.8-cm LI-RADS 5/OPTN 5× hepatocellular carcinoma (HCC). (b) Three months after TARE therapy, the tumor measured 7 cm with persistent central arterial phase hyperenhancement (mRECIST SD, LR-TR equivocal). (c) Six months after TARE therapy, the treated tumor was smaller with decreased central enhancement, but new peripheral geographic and nodular peritumoral hyperenhancement (arrowheads). These areas did not demonstrate washout on portal venous imaging (mRECIST PR, LR TR equivocal or nonviable). (d) Twelve months after TARE therapy, the tumor decreased in size with lack of central tumoral enhancement. There was persistent peripheral geographic and nodular peritumoral hyperenhancment, again without corresponding washout appearance. Note overlying hepatic capsular retraction, consistent with posttreatment parenchymal volume loss (mRECIST PR, LR-TR nonviable). Thin peritumoral ring of enhancement: (e) Pretreatment arterial phase MR image shows a 2.9-cm LI-RADS 5/OPTN 5b HCC. (f) Three months after TARE therapy there was a complete lack of central enhancement secondary to necrosis from 90Y therapy, with a smooth peritumoral ring of arterial enhancement (mRECIST PR, LR-TR nonviable). Complete nonenhancement: (g) Pretreatment arterial phase MR image shows a 6.2-cm LI-RADS 5/OPTN 5× HCC. (h) Three months after TARE therapy there was a decrease in size and central nonenhancement secondary to necrosis from 90Y therapy (mRECIST PR, LR TR nonviable). LR = LI-RADS, mRECIST = modified Response Evaluation Criteria for Solid Tumors, OPTN = Organ Procurement and Transplantation Network, PR = partial response, SD = stable disease, TR = treatment response.
Figure 7b:
Figure 7b:
Axial MR images show various enhancement patterns after transarterial radioembolization (TARE) therapy in (a–d) a 56-year-old man, (e–f) an 82-year-old man, and (g–h) a 65-year-old woman. Geographic peritumoral arterial enhancement: (a) Pretreatment arterial phase MR image shows a 6.8-cm LI-RADS 5/OPTN 5× hepatocellular carcinoma (HCC). (b) Three months after TARE therapy, the tumor measured 7 cm with persistent central arterial phase hyperenhancement (mRECIST SD, LR-TR equivocal). (c) Six months after TARE therapy, the treated tumor was smaller with decreased central enhancement, but new peripheral geographic and nodular peritumoral hyperenhancement (arrowheads). These areas did not demonstrate washout on portal venous imaging (mRECIST PR, LR TR equivocal or nonviable). (d) Twelve months after TARE therapy, the tumor decreased in size with lack of central tumoral enhancement. There was persistent peripheral geographic and nodular peritumoral hyperenhancment, again without corresponding washout appearance. Note overlying hepatic capsular retraction, consistent with posttreatment parenchymal volume loss (mRECIST PR, LR-TR nonviable). Thin peritumoral ring of enhancement: (e) Pretreatment arterial phase MR image shows a 2.9-cm LI-RADS 5/OPTN 5b HCC. (f) Three months after TARE therapy there was a complete lack of central enhancement secondary to necrosis from 90Y therapy, with a smooth peritumoral ring of arterial enhancement (mRECIST PR, LR-TR nonviable). Complete nonenhancement: (g) Pretreatment arterial phase MR image shows a 6.2-cm LI-RADS 5/OPTN 5× HCC. (h) Three months after TARE therapy there was a decrease in size and central nonenhancement secondary to necrosis from 90Y therapy (mRECIST PR, LR TR nonviable). LR = LI-RADS, mRECIST = modified Response Evaluation Criteria for Solid Tumors, OPTN = Organ Procurement and Transplantation Network, PR = partial response, SD = stable disease, TR = treatment response.
Figure 7c:
Figure 7c:
Axial MR images show various enhancement patterns after transarterial radioembolization (TARE) therapy in (a–d) a 56-year-old man, (e–f) an 82-year-old man, and (g–h) a 65-year-old woman. Geographic peritumoral arterial enhancement: (a) Pretreatment arterial phase MR image shows a 6.8-cm LI-RADS 5/OPTN 5× hepatocellular carcinoma (HCC). (b) Three months after TARE therapy, the tumor measured 7 cm with persistent central arterial phase hyperenhancement (mRECIST SD, LR-TR equivocal). (c) Six months after TARE therapy, the treated tumor was smaller with decreased central enhancement, but new peripheral geographic and nodular peritumoral hyperenhancement (arrowheads). These areas did not demonstrate washout on portal venous imaging (mRECIST PR, LR TR equivocal or nonviable). (d) Twelve months after TARE therapy, the tumor decreased in size with lack of central tumoral enhancement. There was persistent peripheral geographic and nodular peritumoral hyperenhancment, again without corresponding washout appearance. Note overlying hepatic capsular retraction, consistent with posttreatment parenchymal volume loss (mRECIST PR, LR-TR nonviable). Thin peritumoral ring of enhancement: (e) Pretreatment arterial phase MR image shows a 2.9-cm LI-RADS 5/OPTN 5b HCC. (f) Three months after TARE therapy there was a complete lack of central enhancement secondary to necrosis from 90Y therapy, with a smooth peritumoral ring of arterial enhancement (mRECIST PR, LR-TR nonviable). Complete nonenhancement: (g) Pretreatment arterial phase MR image shows a 6.2-cm LI-RADS 5/OPTN 5× HCC. (h) Three months after TARE therapy there was a decrease in size and central nonenhancement secondary to necrosis from 90Y therapy (mRECIST PR, LR TR nonviable). LR = LI-RADS, mRECIST = modified Response Evaluation Criteria for Solid Tumors, OPTN = Organ Procurement and Transplantation Network, PR = partial response, SD = stable disease, TR = treatment response.
Figure 7d:
Figure 7d:
Axial MR images show various enhancement patterns after transarterial radioembolization (TARE) therapy in (a–d) a 56-year-old man, (e–f) an 82-year-old man, and (g–h) a 65-year-old woman. Geographic peritumoral arterial enhancement: (a) Pretreatment arterial phase MR image shows a 6.8-cm LI-RADS 5/OPTN 5× hepatocellular carcinoma (HCC). (b) Three months after TARE therapy, the tumor measured 7 cm with persistent central arterial phase hyperenhancement (mRECIST SD, LR-TR equivocal). (c) Six months after TARE therapy, the treated tumor was smaller with decreased central enhancement, but new peripheral geographic and nodular peritumoral hyperenhancement (arrowheads). These areas did not demonstrate washout on portal venous imaging (mRECIST PR, LR TR equivocal or nonviable). (d) Twelve months after TARE therapy, the tumor decreased in size with lack of central tumoral enhancement. There was persistent peripheral geographic and nodular peritumoral hyperenhancment, again without corresponding washout appearance. Note overlying hepatic capsular retraction, consistent with posttreatment parenchymal volume loss (mRECIST PR, LR-TR nonviable). Thin peritumoral ring of enhancement: (e) Pretreatment arterial phase MR image shows a 2.9-cm LI-RADS 5/OPTN 5b HCC. (f) Three months after TARE therapy there was a complete lack of central enhancement secondary to necrosis from 90Y therapy, with a smooth peritumoral ring of arterial enhancement (mRECIST PR, LR-TR nonviable). Complete nonenhancement: (g) Pretreatment arterial phase MR image shows a 6.2-cm LI-RADS 5/OPTN 5× HCC. (h) Three months after TARE therapy there was a decrease in size and central nonenhancement secondary to necrosis from 90Y therapy (mRECIST PR, LR TR nonviable). LR = LI-RADS, mRECIST = modified Response Evaluation Criteria for Solid Tumors, OPTN = Organ Procurement and Transplantation Network, PR = partial response, SD = stable disease, TR = treatment response.
Figure 7e:
Figure 7e:
Axial MR images show various enhancement patterns after transarterial radioembolization (TARE) therapy in (a–d) a 56-year-old man, (e–f) an 82-year-old man, and (g–h) a 65-year-old woman. Geographic peritumoral arterial enhancement: (a) Pretreatment arterial phase MR image shows a 6.8-cm LI-RADS 5/OPTN 5× hepatocellular carcinoma (HCC). (b) Three months after TARE therapy, the tumor measured 7 cm with persistent central arterial phase hyperenhancement (mRECIST SD, LR-TR equivocal). (c) Six months after TARE therapy, the treated tumor was smaller with decreased central enhancement, but new peripheral geographic and nodular peritumoral hyperenhancement (arrowheads). These areas did not demonstrate washout on portal venous imaging (mRECIST PR, LR TR equivocal or nonviable). (d) Twelve months after TARE therapy, the tumor decreased in size with lack of central tumoral enhancement. There was persistent peripheral geographic and nodular peritumoral hyperenhancment, again without corresponding washout appearance. Note overlying hepatic capsular retraction, consistent with posttreatment parenchymal volume loss (mRECIST PR, LR-TR nonviable). Thin peritumoral ring of enhancement: (e) Pretreatment arterial phase MR image shows a 2.9-cm LI-RADS 5/OPTN 5b HCC. (f) Three months after TARE therapy there was a complete lack of central enhancement secondary to necrosis from 90Y therapy, with a smooth peritumoral ring of arterial enhancement (mRECIST PR, LR-TR nonviable). Complete nonenhancement: (g) Pretreatment arterial phase MR image shows a 6.2-cm LI-RADS 5/OPTN 5× HCC. (h) Three months after TARE therapy there was a decrease in size and central nonenhancement secondary to necrosis from 90Y therapy (mRECIST PR, LR TR nonviable). LR = LI-RADS, mRECIST = modified Response Evaluation Criteria for Solid Tumors, OPTN = Organ Procurement and Transplantation Network, PR = partial response, SD = stable disease, TR = treatment response.
Figure 7f:
Figure 7f:
Axial MR images show various enhancement patterns after transarterial radioembolization (TARE) therapy in (a–d) a 56-year-old man, (e–f) an 82-year-old man, and (g–h) a 65-year-old woman. Geographic peritumoral arterial enhancement: (a) Pretreatment arterial phase MR image shows a 6.8-cm LI-RADS 5/OPTN 5× hepatocellular carcinoma (HCC). (b) Three months after TARE therapy, the tumor measured 7 cm with persistent central arterial phase hyperenhancement (mRECIST SD, LR-TR equivocal). (c) Six months after TARE therapy, the treated tumor was smaller with decreased central enhancement, but new peripheral geographic and nodular peritumoral hyperenhancement (arrowheads). These areas did not demonstrate washout on portal venous imaging (mRECIST PR, LR TR equivocal or nonviable). (d) Twelve months after TARE therapy, the tumor decreased in size with lack of central tumoral enhancement. There was persistent peripheral geographic and nodular peritumoral hyperenhancment, again without corresponding washout appearance. Note overlying hepatic capsular retraction, consistent with posttreatment parenchymal volume loss (mRECIST PR, LR-TR nonviable). Thin peritumoral ring of enhancement: (e) Pretreatment arterial phase MR image shows a 2.9-cm LI-RADS 5/OPTN 5b HCC. (f) Three months after TARE therapy there was a complete lack of central enhancement secondary to necrosis from 90Y therapy, with a smooth peritumoral ring of arterial enhancement (mRECIST PR, LR-TR nonviable). Complete nonenhancement: (g) Pretreatment arterial phase MR image shows a 6.2-cm LI-RADS 5/OPTN 5× HCC. (h) Three months after TARE therapy there was a decrease in size and central nonenhancement secondary to necrosis from 90Y therapy (mRECIST PR, LR TR nonviable). LR = LI-RADS, mRECIST = modified Response Evaluation Criteria for Solid Tumors, OPTN = Organ Procurement and Transplantation Network, PR = partial response, SD = stable disease, TR = treatment response.
Figure 7g:
Figure 7g:
Axial MR images show various enhancement patterns after transarterial radioembolization (TARE) therapy in (a–d) a 56-year-old man, (e–f) an 82-year-old man, and (g–h) a 65-year-old woman. Geographic peritumoral arterial enhancement: (a) Pretreatment arterial phase MR image shows a 6.8-cm LI-RADS 5/OPTN 5× hepatocellular carcinoma (HCC). (b) Three months after TARE therapy, the tumor measured 7 cm with persistent central arterial phase hyperenhancement (mRECIST SD, LR-TR equivocal). (c) Six months after TARE therapy, the treated tumor was smaller with decreased central enhancement, but new peripheral geographic and nodular peritumoral hyperenhancement (arrowheads). These areas did not demonstrate washout on portal venous imaging (mRECIST PR, LR TR equivocal or nonviable). (d) Twelve months after TARE therapy, the tumor decreased in size with lack of central tumoral enhancement. There was persistent peripheral geographic and nodular peritumoral hyperenhancment, again without corresponding washout appearance. Note overlying hepatic capsular retraction, consistent with posttreatment parenchymal volume loss (mRECIST PR, LR-TR nonviable). Thin peritumoral ring of enhancement: (e) Pretreatment arterial phase MR image shows a 2.9-cm LI-RADS 5/OPTN 5b HCC. (f) Three months after TARE therapy there was a complete lack of central enhancement secondary to necrosis from 90Y therapy, with a smooth peritumoral ring of arterial enhancement (mRECIST PR, LR-TR nonviable). Complete nonenhancement: (g) Pretreatment arterial phase MR image shows a 6.2-cm LI-RADS 5/OPTN 5× HCC. (h) Three months after TARE therapy there was a decrease in size and central nonenhancement secondary to necrosis from 90Y therapy (mRECIST PR, LR TR nonviable). LR = LI-RADS, mRECIST = modified Response Evaluation Criteria for Solid Tumors, OPTN = Organ Procurement and Transplantation Network, PR = partial response, SD = stable disease, TR = treatment response.
Figure 7h:
Figure 7h:
Axial MR images show various enhancement patterns after transarterial radioembolization (TARE) therapy in (a–d) a 56-year-old man, (e–f) an 82-year-old man, and (g–h) a 65-year-old woman. Geographic peritumoral arterial enhancement: (a) Pretreatment arterial phase MR image shows a 6.8-cm LI-RADS 5/OPTN 5× hepatocellular carcinoma (HCC). (b) Three months after TARE therapy, the tumor measured 7 cm with persistent central arterial phase hyperenhancement (mRECIST SD, LR-TR equivocal). (c) Six months after TARE therapy, the treated tumor was smaller with decreased central enhancement, but new peripheral geographic and nodular peritumoral hyperenhancement (arrowheads). These areas did not demonstrate washout on portal venous imaging (mRECIST PR, LR TR equivocal or nonviable). (d) Twelve months after TARE therapy, the tumor decreased in size with lack of central tumoral enhancement. There was persistent peripheral geographic and nodular peritumoral hyperenhancment, again without corresponding washout appearance. Note overlying hepatic capsular retraction, consistent with posttreatment parenchymal volume loss (mRECIST PR, LR-TR nonviable). Thin peritumoral ring of enhancement: (e) Pretreatment arterial phase MR image shows a 2.9-cm LI-RADS 5/OPTN 5b HCC. (f) Three months after TARE therapy there was a complete lack of central enhancement secondary to necrosis from 90Y therapy, with a smooth peritumoral ring of arterial enhancement (mRECIST PR, LR-TR nonviable). Complete nonenhancement: (g) Pretreatment arterial phase MR image shows a 6.2-cm LI-RADS 5/OPTN 5× HCC. (h) Three months after TARE therapy there was a decrease in size and central nonenhancement secondary to necrosis from 90Y therapy (mRECIST PR, LR TR nonviable). LR = LI-RADS, mRECIST = modified Response Evaluation Criteria for Solid Tumors, OPTN = Organ Procurement and Transplantation Network, PR = partial response, SD = stable disease, TR = treatment response.
Figure 8a:
Figure 8a:
Equivocal and recurrent disease after transarterial radioembolization (TARE) in a 62-year-old woman. (a) Pretreatment axial arterial phase MR image shows a 4.8-cm LI-RADS 5/OPTN 5B hepatocellular carcinoma (HCC) (arrow) with arterial phase hyperenhancement (APHE) and washout (b). (c) Three months after TARE, the tumor is overall smaller in size with a 2.2-cm area of persistent APHE within the treated tumor (arrow), which demonstrates persistent delayed phase enhancement (arrow in d) (mRECIST PR, LR TR equivocal). (e) Five months after TARE, the tumor continues to regress in size, with the previously seen nodular arterial enhancing area measuring 1.6 cm (arrow), but with new “washout” (arrow in f) (mRECIST PR, LR TR equivocal). (g) Eight months after TARE, the treatment cavity itself is unchanged in size; however, there is now an increasing size of the enhancing tumor, measuring 2.6 cm (arrow), with “washout” (arrow) compatible with recurrent HCC (mRECIST PD, LR TR viable). An additional new area of the tumor is seen (arrowhead). LR = LI-RADS, mRECIST = modified Response Evaluation Criteria for Solid Tumors, OPTN = Organ Procurement and Transplantation Network, PD = progressive disease, PV = portal venous, TR = treatment response.
Figure 8b:
Figure 8b:
Equivocal and recurrent disease after transarterial radioembolization (TARE) in a 62-year-old woman. (a) Pretreatment axial arterial phase MR image shows a 4.8-cm LI-RADS 5/OPTN 5B hepatocellular carcinoma (HCC) (arrow) with arterial phase hyperenhancement (APHE) and washout (b). (c) Three months after TARE, the tumor is overall smaller in size with a 2.2-cm area of persistent APHE within the treated tumor (arrow), which demonstrates persistent delayed phase enhancement (arrow in d) (mRECIST PR, LR TR equivocal). (e) Five months after TARE, the tumor continues to regress in size, with the previously seen nodular arterial enhancing area measuring 1.6 cm (arrow), but with new “washout” (arrow in f) (mRECIST PR, LR TR equivocal). (g) Eight months after TARE, the treatment cavity itself is unchanged in size; however, there is now an increasing size of the enhancing tumor, measuring 2.6 cm (arrow), with “washout” (arrow) compatible with recurrent HCC (mRECIST PD, LR TR viable). An additional new area of the tumor is seen (arrowhead). LR = LI-RADS, mRECIST = modified Response Evaluation Criteria for Solid Tumors, OPTN = Organ Procurement and Transplantation Network, PD = progressive disease, PV = portal venous, TR = treatment response.
Figure 8c:
Figure 8c:
Equivocal and recurrent disease after transarterial radioembolization (TARE) in a 62-year-old woman. (a) Pretreatment axial arterial phase MR image shows a 4.8-cm LI-RADS 5/OPTN 5B hepatocellular carcinoma (HCC) (arrow) with arterial phase hyperenhancement (APHE) and washout (b). (c) Three months after TARE, the tumor is overall smaller in size with a 2.2-cm area of persistent APHE within the treated tumor (arrow), which demonstrates persistent delayed phase enhancement (arrow in d) (mRECIST PR, LR TR equivocal). (e) Five months after TARE, the tumor continues to regress in size, with the previously seen nodular arterial enhancing area measuring 1.6 cm (arrow), but with new “washout” (arrow in f) (mRECIST PR, LR TR equivocal). (g) Eight months after TARE, the treatment cavity itself is unchanged in size; however, there is now an increasing size of the enhancing tumor, measuring 2.6 cm (arrow), with “washout” (arrow) compatible with recurrent HCC (mRECIST PD, LR TR viable). An additional new area of the tumor is seen (arrowhead). LR = LI-RADS, mRECIST = modified Response Evaluation Criteria for Solid Tumors, OPTN = Organ Procurement and Transplantation Network, PD = progressive disease, PV = portal venous, TR = treatment response.
Figure 8d:
Figure 8d:
Equivocal and recurrent disease after transarterial radioembolization (TARE) in a 62-year-old woman. (a) Pretreatment axial arterial phase MR image shows a 4.8-cm LI-RADS 5/OPTN 5B hepatocellular carcinoma (HCC) (arrow) with arterial phase hyperenhancement (APHE) and washout (b). (c) Three months after TARE, the tumor is overall smaller in size with a 2.2-cm area of persistent APHE within the treated tumor (arrow), which demonstrates persistent delayed phase enhancement (arrow in d) (mRECIST PR, LR TR equivocal). (e) Five months after TARE, the tumor continues to regress in size, with the previously seen nodular arterial enhancing area measuring 1.6 cm (arrow), but with new “washout” (arrow in f) (mRECIST PR, LR TR equivocal). (g) Eight months after TARE, the treatment cavity itself is unchanged in size; however, there is now an increasing size of the enhancing tumor, measuring 2.6 cm (arrow), with “washout” (arrow) compatible with recurrent HCC (mRECIST PD, LR TR viable). An additional new area of the tumor is seen (arrowhead). LR = LI-RADS, mRECIST = modified Response Evaluation Criteria for Solid Tumors, OPTN = Organ Procurement and Transplantation Network, PD = progressive disease, PV = portal venous, TR = treatment response.
Figure 8e:
Figure 8e:
Equivocal and recurrent disease after transarterial radioembolization (TARE) in a 62-year-old woman. (a) Pretreatment axial arterial phase MR image shows a 4.8-cm LI-RADS 5/OPTN 5B hepatocellular carcinoma (HCC) (arrow) with arterial phase hyperenhancement (APHE) and washout (b). (c) Three months after TARE, the tumor is overall smaller in size with a 2.2-cm area of persistent APHE within the treated tumor (arrow), which demonstrates persistent delayed phase enhancement (arrow in d) (mRECIST PR, LR TR equivocal). (e) Five months after TARE, the tumor continues to regress in size, with the previously seen nodular arterial enhancing area measuring 1.6 cm (arrow), but with new “washout” (arrow in f) (mRECIST PR, LR TR equivocal). (g) Eight months after TARE, the treatment cavity itself is unchanged in size; however, there is now an increasing size of the enhancing tumor, measuring 2.6 cm (arrow), with “washout” (arrow) compatible with recurrent HCC (mRECIST PD, LR TR viable). An additional new area of the tumor is seen (arrowhead). LR = LI-RADS, mRECIST = modified Response Evaluation Criteria for Solid Tumors, OPTN = Organ Procurement and Transplantation Network, PD = progressive disease, PV = portal venous, TR = treatment response.
Figure 8f:
Figure 8f:
Equivocal and recurrent disease after transarterial radioembolization (TARE) in a 62-year-old woman. (a) Pretreatment axial arterial phase MR image shows a 4.8-cm LI-RADS 5/OPTN 5B hepatocellular carcinoma (HCC) (arrow) with arterial phase hyperenhancement (APHE) and washout (b). (c) Three months after TARE, the tumor is overall smaller in size with a 2.2-cm area of persistent APHE within the treated tumor (arrow), which demonstrates persistent delayed phase enhancement (arrow in d) (mRECIST PR, LR TR equivocal). (e) Five months after TARE, the tumor continues to regress in size, with the previously seen nodular arterial enhancing area measuring 1.6 cm (arrow), but with new “washout” (arrow in f) (mRECIST PR, LR TR equivocal). (g) Eight months after TARE, the treatment cavity itself is unchanged in size; however, there is now an increasing size of the enhancing tumor, measuring 2.6 cm (arrow), with “washout” (arrow) compatible with recurrent HCC (mRECIST PD, LR TR viable). An additional new area of the tumor is seen (arrowhead). LR = LI-RADS, mRECIST = modified Response Evaluation Criteria for Solid Tumors, OPTN = Organ Procurement and Transplantation Network, PD = progressive disease, PV = portal venous, TR = treatment response.
Figure 8g:
Figure 8g:
Equivocal and recurrent disease after transarterial radioembolization (TARE) in a 62-year-old woman. (a) Pretreatment axial arterial phase MR image shows a 4.8-cm LI-RADS 5/OPTN 5B hepatocellular carcinoma (HCC) (arrow) with arterial phase hyperenhancement (APHE) and washout (b). (c) Three months after TARE, the tumor is overall smaller in size with a 2.2-cm area of persistent APHE within the treated tumor (arrow), which demonstrates persistent delayed phase enhancement (arrow in d) (mRECIST PR, LR TR equivocal). (e) Five months after TARE, the tumor continues to regress in size, with the previously seen nodular arterial enhancing area measuring 1.6 cm (arrow), but with new “washout” (arrow in f) (mRECIST PR, LR TR equivocal). (g) Eight months after TARE, the treatment cavity itself is unchanged in size; however, there is now an increasing size of the enhancing tumor, measuring 2.6 cm (arrow), with “washout” (arrow) compatible with recurrent HCC (mRECIST PD, LR TR viable). An additional new area of the tumor is seen (arrowhead). LR = LI-RADS, mRECIST = modified Response Evaluation Criteria for Solid Tumors, OPTN = Organ Procurement and Transplantation Network, PD = progressive disease, PV = portal venous, TR = treatment response.
Figure 8h:
Figure 8h:
Equivocal and recurrent disease after transarterial radioembolization (TARE) in a 62-year-old woman. (a) Pretreatment axial arterial phase MR image shows a 4.8-cm LI-RADS 5/OPTN 5B hepatocellular carcinoma (HCC) (arrow) with arterial phase hyperenhancement (APHE) and washout (b). (c) Three months after TARE, the tumor is overall smaller in size with a 2.2-cm area of persistent APHE within the treated tumor (arrow), which demonstrates persistent delayed phase enhancement (arrow in d) (mRECIST PR, LR TR equivocal). (e) Five months after TARE, the tumor continues to regress in size, with the previously seen nodular arterial enhancing area measuring 1.6 cm (arrow), but with new “washout” (arrow in f) (mRECIST PR, LR TR equivocal). (g) Eight months after TARE, the treatment cavity itself is unchanged in size; however, there is now an increasing size of the enhancing tumor, measuring 2.6 cm (arrow), with “washout” (arrow) compatible with recurrent HCC (mRECIST PD, LR TR viable). An additional new area of the tumor is seen (arrowhead). LR = LI-RADS, mRECIST = modified Response Evaluation Criteria for Solid Tumors, OPTN = Organ Procurement and Transplantation Network, PD = progressive disease, PV = portal venous, TR = treatment response.
Figure 9a:
Figure 9a:
Imaging findings after stereotactic body radiation therapy in a 56-year-old woman. (a) Pretreatment axial MR image shows a 3.4-cm LR-5/OPTN 5B hepatocellular carcinoma (HCC) (arrow) in segment 7 of liver with arterial phase hyperenhancement (APHE) and “washout” (b). (c) Three months after SBRT, the treated HCC measures 3.2 cm and no longer demonstrates APHE, confirmed with subtraction images (not shown) (mRECIST CR, LR-TR nonviable). CR = complete response, LR = LI-RADS, mRECIST = modified Response Evaluation Criteria for Solid Tumors, OPTN = Organ Procurement and Transplantation Network, PV = portal venous, SBRT = stereotactic body radiation therapy, TR = treatment response.
Figure 9b:
Figure 9b:
Imaging findings after stereotactic body radiation therapy in a 56-year-old woman. (a) Pretreatment axial MR image shows a 3.4-cm LR-5/OPTN 5B hepatocellular carcinoma (HCC) (arrow) in segment 7 of liver with arterial phase hyperenhancement (APHE) and “washout” (b). (c) Three months after SBRT, the treated HCC measures 3.2 cm and no longer demonstrates APHE, confirmed with subtraction images (not shown) (mRECIST CR, LR-TR nonviable). CR = complete response, LR = LI-RADS, mRECIST = modified Response Evaluation Criteria for Solid Tumors, OPTN = Organ Procurement and Transplantation Network, PV = portal venous, SBRT = stereotactic body radiation therapy, TR = treatment response.
Figure 9c:
Figure 9c:
Imaging findings after stereotactic body radiation therapy in a 56-year-old woman. (a) Pretreatment axial MR image shows a 3.4-cm LR-5/OPTN 5B hepatocellular carcinoma (HCC) (arrow) in segment 7 of liver with arterial phase hyperenhancement (APHE) and “washout” (b). (c) Three months after SBRT, the treated HCC measures 3.2 cm and no longer demonstrates APHE, confirmed with subtraction images (not shown) (mRECIST CR, LR-TR nonviable). CR = complete response, LR = LI-RADS, mRECIST = modified Response Evaluation Criteria for Solid Tumors, OPTN = Organ Procurement and Transplantation Network, PV = portal venous, SBRT = stereotactic body radiation therapy, TR = treatment response.
Figure 10a:
Figure 10a:
Imaging findings after stereotactic body radiation therapy. Axial images from a 59-year-old man with hepatocellular carcinoma (HCC) (arrow). (a) Pretreatment MR image demonstrates a 2.9-cm LR-5/OPTN 5B HCC in segment 8 of liver with arterial phase hyperenhancement (APHE), “washout” and “capsule” (b). (c) Three months after SBRT, the treated HCC measures 2.4 cm with persistent APHE and “washout” (d) (mRECIST SD, LR TR nonviable). (e) Six months after SBRT, the treated lesion measures 1.3 cm with persistent APHE and “washout” (f) (mRECIST PR, LR-TR nonviable). (g) One year after SBRT, the treated tumor measures 0.8 cm with persistent APHE and “washout” (h) (mRECIST PR, LR-TR nonviable). (i, j) Two years after SBRT the tumor is no longer seen (mRECIST CR, LR-TR nonviable). The surrounding parenchyma undergoes an evolution of radiation changes with early geographic arterial phase enhancement which normalized at portal venous (PV) phase of imaging. Over time, there is conversion to delayed phase geographic parenchymal enhancement, and progressive volume loss along the surface of the liver, secondary to fibrosis. CR = complete response, LR = LI-RADS, mRECIST = modified Response Evaluation Criteria for Solid Tumors, OPTN = Organ Procurement and Transplantation Network, PR = partial response, SBRT = stereotactic body radiation therapy, SD = stable disease, TR = treatment response.
Figure 10b:
Figure 10b:
Imaging findings after stereotactic body radiation therapy. Axial images from a 59-year-old man with hepatocellular carcinoma (HCC) (arrow). (a) Pretreatment MR image demonstrates a 2.9-cm LR-5/OPTN 5B HCC in segment 8 of liver with arterial phase hyperenhancement (APHE), “washout” and “capsule” (b). (c) Three months after SBRT, the treated HCC measures 2.4 cm with persistent APHE and “washout” (d) (mRECIST SD, LR TR nonviable). (e) Six months after SBRT, the treated lesion measures 1.3 cm with persistent APHE and “washout” (f) (mRECIST PR, LR-TR nonviable). (g) One year after SBRT, the treated tumor measures 0.8 cm with persistent APHE and “washout” (h) (mRECIST PR, LR-TR nonviable). (i, j) Two years after SBRT the tumor is no longer seen (mRECIST CR, LR-TR nonviable). The surrounding parenchyma undergoes an evolution of radiation changes with early geographic arterial phase enhancement which normalized at portal venous (PV) phase of imaging. Over time, there is conversion to delayed phase geographic parenchymal enhancement, and progressive volume loss along the surface of the liver, secondary to fibrosis. CR = complete response, LR = LI-RADS, mRECIST = modified Response Evaluation Criteria for Solid Tumors, OPTN = Organ Procurement and Transplantation Network, PR = partial response, SBRT = stereotactic body radiation therapy, SD = stable disease, TR = treatment response.
Figure 10c:
Figure 10c:
Imaging findings after stereotactic body radiation therapy. Axial images from a 59-year-old man with hepatocellular carcinoma (HCC) (arrow). (a) Pretreatment MR image demonstrates a 2.9-cm LR-5/OPTN 5B HCC in segment 8 of liver with arterial phase hyperenhancement (APHE), “washout” and “capsule” (b). (c) Three months after SBRT, the treated HCC measures 2.4 cm with persistent APHE and “washout” (d) (mRECIST SD, LR TR nonviable). (e) Six months after SBRT, the treated lesion measures 1.3 cm with persistent APHE and “washout” (f) (mRECIST PR, LR-TR nonviable). (g) One year after SBRT, the treated tumor measures 0.8 cm with persistent APHE and “washout” (h) (mRECIST PR, LR-TR nonviable). (i, j) Two years after SBRT the tumor is no longer seen (mRECIST CR, LR-TR nonviable). The surrounding parenchyma undergoes an evolution of radiation changes with early geographic arterial phase enhancement which normalized at portal venous (PV) phase of imaging. Over time, there is conversion to delayed phase geographic parenchymal enhancement, and progressive volume loss along the surface of the liver, secondary to fibrosis. CR = complete response, LR = LI-RADS, mRECIST = modified Response Evaluation Criteria for Solid Tumors, OPTN = Organ Procurement and Transplantation Network, PR = partial response, SBRT = stereotactic body radiation therapy, SD = stable disease, TR = treatment response.
Figure 10d:
Figure 10d:
Imaging findings after stereotactic body radiation therapy. Axial images from a 59-year-old man with hepatocellular carcinoma (HCC) (arrow). (a) Pretreatment MR image demonstrates a 2.9-cm LR-5/OPTN 5B HCC in segment 8 of liver with arterial phase hyperenhancement (APHE), “washout” and “capsule” (b). (c) Three months after SBRT, the treated HCC measures 2.4 cm with persistent APHE and “washout” (d) (mRECIST SD, LR TR nonviable). (e) Six months after SBRT, the treated lesion measures 1.3 cm with persistent APHE and “washout” (f) (mRECIST PR, LR-TR nonviable). (g) One year after SBRT, the treated tumor measures 0.8 cm with persistent APHE and “washout” (h) (mRECIST PR, LR-TR nonviable). (i, j) Two years after SBRT the tumor is no longer seen (mRECIST CR, LR-TR nonviable). The surrounding parenchyma undergoes an evolution of radiation changes with early geographic arterial phase enhancement which normalized at portal venous (PV) phase of imaging. Over time, there is conversion to delayed phase geographic parenchymal enhancement, and progressive volume loss along the surface of the liver, secondary to fibrosis. CR = complete response, LR = LI-RADS, mRECIST = modified Response Evaluation Criteria for Solid Tumors, OPTN = Organ Procurement and Transplantation Network, PR = partial response, SBRT = stereotactic body radiation therapy, SD = stable disease, TR = treatment response.
Figure 10e:
Figure 10e:
Imaging findings after stereotactic body radiation therapy. Axial images from a 59-year-old man with hepatocellular carcinoma (HCC) (arrow). (a) Pretreatment MR image demonstrates a 2.9-cm LR-5/OPTN 5B HCC in segment 8 of liver with arterial phase hyperenhancement (APHE), “washout” and “capsule” (b). (c) Three months after SBRT, the treated HCC measures 2.4 cm with persistent APHE and “washout” (d) (mRECIST SD, LR TR nonviable). (e) Six months after SBRT, the treated lesion measures 1.3 cm with persistent APHE and “washout” (f) (mRECIST PR, LR-TR nonviable). (g) One year after SBRT, the treated tumor measures 0.8 cm with persistent APHE and “washout” (h) (mRECIST PR, LR-TR nonviable). (i, j) Two years after SBRT the tumor is no longer seen (mRECIST CR, LR-TR nonviable). The surrounding parenchyma undergoes an evolution of radiation changes with early geographic arterial phase enhancement which normalized at portal venous (PV) phase of imaging. Over time, there is conversion to delayed phase geographic parenchymal enhancement, and progressive volume loss along the surface of the liver, secondary to fibrosis. CR = complete response, LR = LI-RADS, mRECIST = modified Response Evaluation Criteria for Solid Tumors, OPTN = Organ Procurement and Transplantation Network, PR = partial response, SBRT = stereotactic body radiation therapy, SD = stable disease, TR = treatment response.
Figure 10f:
Figure 10f:
Imaging findings after stereotactic body radiation therapy. Axial images from a 59-year-old man with hepatocellular carcinoma (HCC) (arrow). (a) Pretreatment MR image demonstrates a 2.9-cm LR-5/OPTN 5B HCC in segment 8 of liver with arterial phase hyperenhancement (APHE), “washout” and “capsule” (b). (c) Three months after SBRT, the treated HCC measures 2.4 cm with persistent APHE and “washout” (d) (mRECIST SD, LR TR nonviable). (e) Six months after SBRT, the treated lesion measures 1.3 cm with persistent APHE and “washout” (f) (mRECIST PR, LR-TR nonviable). (g) One year after SBRT, the treated tumor measures 0.8 cm with persistent APHE and “washout” (h) (mRECIST PR, LR-TR nonviable). (i, j) Two years after SBRT the tumor is no longer seen (mRECIST CR, LR-TR nonviable). The surrounding parenchyma undergoes an evolution of radiation changes with early geographic arterial phase enhancement which normalized at portal venous (PV) phase of imaging. Over time, there is conversion to delayed phase geographic parenchymal enhancement, and progressive volume loss along the surface of the liver, secondary to fibrosis. CR = complete response, LR = LI-RADS, mRECIST = modified Response Evaluation Criteria for Solid Tumors, OPTN = Organ Procurement and Transplantation Network, PR = partial response, SBRT = stereotactic body radiation therapy, SD = stable disease, TR = treatment response.
Figure 10g:
Figure 10g:
Imaging findings after stereotactic body radiation therapy. Axial images from a 59-year-old man with hepatocellular carcinoma (HCC) (arrow). (a) Pretreatment MR image demonstrates a 2.9-cm LR-5/OPTN 5B HCC in segment 8 of liver with arterial phase hyperenhancement (APHE), “washout” and “capsule” (b). (c) Three months after SBRT, the treated HCC measures 2.4 cm with persistent APHE and “washout” (d) (mRECIST SD, LR TR nonviable). (e) Six months after SBRT, the treated lesion measures 1.3 cm with persistent APHE and “washout” (f) (mRECIST PR, LR-TR nonviable). (g) One year after SBRT, the treated tumor measures 0.8 cm with persistent APHE and “washout” (h) (mRECIST PR, LR-TR nonviable). (i, j) Two years after SBRT the tumor is no longer seen (mRECIST CR, LR-TR nonviable). The surrounding parenchyma undergoes an evolution of radiation changes with early geographic arterial phase enhancement which normalized at portal venous (PV) phase of imaging. Over time, there is conversion to delayed phase geographic parenchymal enhancement, and progressive volume loss along the surface of the liver, secondary to fibrosis. CR = complete response, LR = LI-RADS, mRECIST = modified Response Evaluation Criteria for Solid Tumors, OPTN = Organ Procurement and Transplantation Network, PR = partial response, SBRT = stereotactic body radiation therapy, SD = stable disease, TR = treatment response.
Figure 10h:
Figure 10h:
Imaging findings after stereotactic body radiation therapy. Axial images from a 59-year-old man with hepatocellular carcinoma (HCC) (arrow). (a) Pretreatment MR image demonstrates a 2.9-cm LR-5/OPTN 5B HCC in segment 8 of liver with arterial phase hyperenhancement (APHE), “washout” and “capsule” (b). (c) Three months after SBRT, the treated HCC measures 2.4 cm with persistent APHE and “washout” (d) (mRECIST SD, LR TR nonviable). (e) Six months after SBRT, the treated lesion measures 1.3 cm with persistent APHE and “washout” (f) (mRECIST PR, LR-TR nonviable). (g) One year after SBRT, the treated tumor measures 0.8 cm with persistent APHE and “washout” (h) (mRECIST PR, LR-TR nonviable). (i, j) Two years after SBRT the tumor is no longer seen (mRECIST CR, LR-TR nonviable). The surrounding parenchyma undergoes an evolution of radiation changes with early geographic arterial phase enhancement which normalized at portal venous (PV) phase of imaging. Over time, there is conversion to delayed phase geographic parenchymal enhancement, and progressive volume loss along the surface of the liver, secondary to fibrosis. CR = complete response, LR = LI-RADS, mRECIST = modified Response Evaluation Criteria for Solid Tumors, OPTN = Organ Procurement and Transplantation Network, PR = partial response, SBRT = stereotactic body radiation therapy, SD = stable disease, TR = treatment response.
Figure 10i:
Figure 10i:
Imaging findings after stereotactic body radiation therapy. Axial images from a 59-year-old man with hepatocellular carcinoma (HCC) (arrow). (a) Pretreatment MR image demonstrates a 2.9-cm LR-5/OPTN 5B HCC in segment 8 of liver with arterial phase hyperenhancement (APHE), “washout” and “capsule” (b). (c) Three months after SBRT, the treated HCC measures 2.4 cm with persistent APHE and “washout” (d) (mRECIST SD, LR TR nonviable). (e) Six months after SBRT, the treated lesion measures 1.3 cm with persistent APHE and “washout” (f) (mRECIST PR, LR-TR nonviable). (g) One year after SBRT, the treated tumor measures 0.8 cm with persistent APHE and “washout” (h) (mRECIST PR, LR-TR nonviable). (i, j) Two years after SBRT the tumor is no longer seen (mRECIST CR, LR-TR nonviable). The surrounding parenchyma undergoes an evolution of radiation changes with early geographic arterial phase enhancement which normalized at portal venous (PV) phase of imaging. Over time, there is conversion to delayed phase geographic parenchymal enhancement, and progressive volume loss along the surface of the liver, secondary to fibrosis. CR = complete response, LR = LI-RADS, mRECIST = modified Response Evaluation Criteria for Solid Tumors, OPTN = Organ Procurement and Transplantation Network, PR = partial response, SBRT = stereotactic body radiation therapy, SD = stable disease, TR = treatment response.
Figure 10j:
Figure 10j:
Imaging findings after stereotactic body radiation therapy. Axial images from a 59-year-old man with hepatocellular carcinoma (HCC) (arrow). (a) Pretreatment MR image demonstrates a 2.9-cm LR-5/OPTN 5B HCC in segment 8 of liver with arterial phase hyperenhancement (APHE), “washout” and “capsule” (b). (c) Three months after SBRT, the treated HCC measures 2.4 cm with persistent APHE and “washout” (d) (mRECIST SD, LR TR nonviable). (e) Six months after SBRT, the treated lesion measures 1.3 cm with persistent APHE and “washout” (f) (mRECIST PR, LR-TR nonviable). (g) One year after SBRT, the treated tumor measures 0.8 cm with persistent APHE and “washout” (h) (mRECIST PR, LR-TR nonviable). (i, j) Two years after SBRT the tumor is no longer seen (mRECIST CR, LR-TR nonviable). The surrounding parenchyma undergoes an evolution of radiation changes with early geographic arterial phase enhancement which normalized at portal venous (PV) phase of imaging. Over time, there is conversion to delayed phase geographic parenchymal enhancement, and progressive volume loss along the surface of the liver, secondary to fibrosis. CR = complete response, LR = LI-RADS, mRECIST = modified Response Evaluation Criteria for Solid Tumors, OPTN = Organ Procurement and Transplantation Network, PR = partial response, SBRT = stereotactic body radiation therapy, SD = stable disease, TR = treatment response.
Figure 11a:
Figure 11a:
Evolution of imaging findings after stereotactic body radiation therapy (SBRT) with recurrent disease in a 65-year-old woman with hepatocellular carcinoma (HCC) (arrow). (a) Pretreatment MR image shows a 5.4-cm LR-5/OPTN 5× HCC in segment 8 of liver with arterial phase hyperenhancement (APHE), “washout”and “capsule” (b). (c) Three months after SBRT, the treated HCC measures 2.6 cm with persistent APHE and “washout” (d) (mRECIST PR, LR-TR nonviable). (e) Nine months after SBRT, the treated HCC measures 1.3 cm with persistent but decreased intensity of APHE and “washout” (f) (mRECIST PR, LR-TR nonviable). (g) One year after SBRT, the treated tumor begins to increase in size, now measuring 4.8 cm with increased intensity of APHE, “washout” and “capsule” (h). These findings are compatible with local tumor progression and biopsy proven (mRECIST PD, LR-TR viable). (c, e) Evolution of radiation changes in the surrounding parenchyma shows early geographic arterial phase enhancement. (f) Over time, there is conversion to delayed phase geographic parenchymal enhancement and progressive volume loss along the surface of the liver, secondary to fibtrosis. LR = LI-RADS, mRECIST = modified Response Evaluation Criteria for Solid Tumors, OPTN = Organ Procurement and Transplantation Network, PD = progressive disease, PR = partial response, SBRT = stereotactic body radiation therapy, TR = treatment response.
Figure 11b:
Figure 11b:
Evolution of imaging findings after stereotactic body radiation therapy (SBRT) with recurrent disease in a 65-year-old woman with hepatocellular carcinoma (HCC) (arrow). (a) Pretreatment MR image shows a 5.4-cm LR-5/OPTN 5× HCC in segment 8 of liver with arterial phase hyperenhancement (APHE), “washout”and “capsule” (b). (c) Three months after SBRT, the treated HCC measures 2.6 cm with persistent APHE and “washout” (d) (mRECIST PR, LR-TR nonviable). (e) Nine months after SBRT, the treated HCC measures 1.3 cm with persistent but decreased intensity of APHE and “washout” (f) (mRECIST PR, LR-TR nonviable). (g) One year after SBRT, the treated tumor begins to increase in size, now measuring 4.8 cm with increased intensity of APHE, “washout” and “capsule” (h). These findings are compatible with local tumor progression and biopsy proven (mRECIST PD, LR-TR viable). (c, e) Evolution of radiation changes in the surrounding parenchyma shows early geographic arterial phase enhancement. (f) Over time, there is conversion to delayed phase geographic parenchymal enhancement and progressive volume loss along the surface of the liver, secondary to fibtrosis. LR = LI-RADS, mRECIST = modified Response Evaluation Criteria for Solid Tumors, OPTN = Organ Procurement and Transplantation Network, PD = progressive disease, PR = partial response, SBRT = stereotactic body radiation therapy, TR = treatment response.
Figure 11c:
Figure 11c:
Evolution of imaging findings after stereotactic body radiation therapy (SBRT) with recurrent disease in a 65-year-old woman with hepatocellular carcinoma (HCC) (arrow). (a) Pretreatment MR image shows a 5.4-cm LR-5/OPTN 5× HCC in segment 8 of liver with arterial phase hyperenhancement (APHE), “washout”and “capsule” (b). (c) Three months after SBRT, the treated HCC measures 2.6 cm with persistent APHE and “washout” (d) (mRECIST PR, LR-TR nonviable). (e) Nine months after SBRT, the treated HCC measures 1.3 cm with persistent but decreased intensity of APHE and “washout” (f) (mRECIST PR, LR-TR nonviable). (g) One year after SBRT, the treated tumor begins to increase in size, now measuring 4.8 cm with increased intensity of APHE, “washout” and “capsule” (h). These findings are compatible with local tumor progression and biopsy proven (mRECIST PD, LR-TR viable). (c, e) Evolution of radiation changes in the surrounding parenchyma shows early geographic arterial phase enhancement. (f) Over time, there is conversion to delayed phase geographic parenchymal enhancement and progressive volume loss along the surface of the liver, secondary to fibtrosis. LR = LI-RADS, mRECIST = modified Response Evaluation Criteria for Solid Tumors, OPTN = Organ Procurement and Transplantation Network, PD = progressive disease, PR = partial response, SBRT = stereotactic body radiation therapy, TR = treatment response.
Figure 11d:
Figure 11d:
Evolution of imaging findings after stereotactic body radiation therapy (SBRT) with recurrent disease in a 65-year-old woman with hepatocellular carcinoma (HCC) (arrow). (a) Pretreatment MR image shows a 5.4-cm LR-5/OPTN 5× HCC in segment 8 of liver with arterial phase hyperenhancement (APHE), “washout”and “capsule” (b). (c) Three months after SBRT, the treated HCC measures 2.6 cm with persistent APHE and “washout” (d) (mRECIST PR, LR-TR nonviable). (e) Nine months after SBRT, the treated HCC measures 1.3 cm with persistent but decreased intensity of APHE and “washout” (f) (mRECIST PR, LR-TR nonviable). (g) One year after SBRT, the treated tumor begins to increase in size, now measuring 4.8 cm with increased intensity of APHE, “washout” and “capsule” (h). These findings are compatible with local tumor progression and biopsy proven (mRECIST PD, LR-TR viable). (c, e) Evolution of radiation changes in the surrounding parenchyma shows early geographic arterial phase enhancement. (f) Over time, there is conversion to delayed phase geographic parenchymal enhancement and progressive volume loss along the surface of the liver, secondary to fibtrosis. LR = LI-RADS, mRECIST = modified Response Evaluation Criteria for Solid Tumors, OPTN = Organ Procurement and Transplantation Network, PD = progressive disease, PR = partial response, SBRT = stereotactic body radiation therapy, TR = treatment response.
Figure 11e:
Figure 11e:
Evolution of imaging findings after stereotactic body radiation therapy (SBRT) with recurrent disease in a 65-year-old woman with hepatocellular carcinoma (HCC) (arrow). (a) Pretreatment MR image shows a 5.4-cm LR-5/OPTN 5× HCC in segment 8 of liver with arterial phase hyperenhancement (APHE), “washout”and “capsule” (b). (c) Three months after SBRT, the treated HCC measures 2.6 cm with persistent APHE and “washout” (d) (mRECIST PR, LR-TR nonviable). (e) Nine months after SBRT, the treated HCC measures 1.3 cm with persistent but decreased intensity of APHE and “washout” (f) (mRECIST PR, LR-TR nonviable). (g) One year after SBRT, the treated tumor begins to increase in size, now measuring 4.8 cm with increased intensity of APHE, “washout” and “capsule” (h). These findings are compatible with local tumor progression and biopsy proven (mRECIST PD, LR-TR viable). (c, e) Evolution of radiation changes in the surrounding parenchyma shows early geographic arterial phase enhancement. (f) Over time, there is conversion to delayed phase geographic parenchymal enhancement and progressive volume loss along the surface of the liver, secondary to fibtrosis. LR = LI-RADS, mRECIST = modified Response Evaluation Criteria for Solid Tumors, OPTN = Organ Procurement and Transplantation Network, PD = progressive disease, PR = partial response, SBRT = stereotactic body radiation therapy, TR = treatment response.
Figure 11f:
Figure 11f:
Evolution of imaging findings after stereotactic body radiation therapy (SBRT) with recurrent disease in a 65-year-old woman with hepatocellular carcinoma (HCC) (arrow). (a) Pretreatment MR image shows a 5.4-cm LR-5/OPTN 5× HCC in segment 8 of liver with arterial phase hyperenhancement (APHE), “washout”and “capsule” (b). (c) Three months after SBRT, the treated HCC measures 2.6 cm with persistent APHE and “washout” (d) (mRECIST PR, LR-TR nonviable). (e) Nine months after SBRT, the treated HCC measures 1.3 cm with persistent but decreased intensity of APHE and “washout” (f) (mRECIST PR, LR-TR nonviable). (g) One year after SBRT, the treated tumor begins to increase in size, now measuring 4.8 cm with increased intensity of APHE, “washout” and “capsule” (h). These findings are compatible with local tumor progression and biopsy proven (mRECIST PD, LR-TR viable). (c, e) Evolution of radiation changes in the surrounding parenchyma shows early geographic arterial phase enhancement. (f) Over time, there is conversion to delayed phase geographic parenchymal enhancement and progressive volume loss along the surface of the liver, secondary to fibtrosis. LR = LI-RADS, mRECIST = modified Response Evaluation Criteria for Solid Tumors, OPTN = Organ Procurement and Transplantation Network, PD = progressive disease, PR = partial response, SBRT = stereotactic body radiation therapy, TR = treatment response.
Figure 11g:
Figure 11g:
Evolution of imaging findings after stereotactic body radiation therapy (SBRT) with recurrent disease in a 65-year-old woman with hepatocellular carcinoma (HCC) (arrow). (a) Pretreatment MR image shows a 5.4-cm LR-5/OPTN 5× HCC in segment 8 of liver with arterial phase hyperenhancement (APHE), “washout”and “capsule” (b). (c) Three months after SBRT, the treated HCC measures 2.6 cm with persistent APHE and “washout” (d) (mRECIST PR, LR-TR nonviable). (e) Nine months after SBRT, the treated HCC measures 1.3 cm with persistent but decreased intensity of APHE and “washout” (f) (mRECIST PR, LR-TR nonviable). (g) One year after SBRT, the treated tumor begins to increase in size, now measuring 4.8 cm with increased intensity of APHE, “washout” and “capsule” (h). These findings are compatible with local tumor progression and biopsy proven (mRECIST PD, LR-TR viable). (c, e) Evolution of radiation changes in the surrounding parenchyma shows early geographic arterial phase enhancement. (f) Over time, there is conversion to delayed phase geographic parenchymal enhancement and progressive volume loss along the surface of the liver, secondary to fibtrosis. LR = LI-RADS, mRECIST = modified Response Evaluation Criteria for Solid Tumors, OPTN = Organ Procurement and Transplantation Network, PD = progressive disease, PR = partial response, SBRT = stereotactic body radiation therapy, TR = treatment response.
Figure 11h:
Figure 11h:
Evolution of imaging findings after stereotactic body radiation therapy (SBRT) with recurrent disease in a 65-year-old woman with hepatocellular carcinoma (HCC) (arrow). (a) Pretreatment MR image shows a 5.4-cm LR-5/OPTN 5× HCC in segment 8 of liver with arterial phase hyperenhancement (APHE), “washout”and “capsule” (b). (c) Three months after SBRT, the treated HCC measures 2.6 cm with persistent APHE and “washout” (d) (mRECIST PR, LR-TR nonviable). (e) Nine months after SBRT, the treated HCC measures 1.3 cm with persistent but decreased intensity of APHE and “washout” (f) (mRECIST PR, LR-TR nonviable). (g) One year after SBRT, the treated tumor begins to increase in size, now measuring 4.8 cm with increased intensity of APHE, “washout” and “capsule” (h). These findings are compatible with local tumor progression and biopsy proven (mRECIST PD, LR-TR viable). (c, e) Evolution of radiation changes in the surrounding parenchyma shows early geographic arterial phase enhancement. (f) Over time, there is conversion to delayed phase geographic parenchymal enhancement and progressive volume loss along the surface of the liver, secondary to fibtrosis. LR = LI-RADS, mRECIST = modified Response Evaluation Criteria for Solid Tumors, OPTN = Organ Procurement and Transplantation Network, PD = progressive disease, PR = partial response, SBRT = stereotactic body radiation therapy, TR = treatment response.

Similar articles

Cited by

References

    1. Marrero JA, Kulik LM, Sirlin CB, et al. . Diagnosis, Staging, and Management of Hepatocellular Carcinoma: 2018 Practice Guidance by the American Association for the Study of Liver Diseases. Hepatology 2018;68(2):723–750. - PubMed
    1. Poulou LS, Botsa E, Thanou I, Ziakas PD, Thanos L. Percutaneous microwave ablation vs radiofrequency ablation in the treatment of hepatocellular carcinoma. World J Hepatol 2015;7(8):1054–1063. - PMC - PubMed
    1. Molla N, AlMenieir N, Simoneau E, et al. . The role of interventional radiology in the management of hepatocellular carcinoma. Curr Oncol 2014;21(3):e480–e492. - PMC - PubMed
    1. Gamblin TC, Geller DA. Downstaging hepatocellular carcinoma prior to liver transplantation. Liver Transpl 2005;11(12):1466–1468. - PubMed
    1. Mora RA, Ali R, Gabr A, et al. . Pictorial essay: imaging findings following Y90 radiation segmentectomy for hepatocellular carcinoma. Abdom Radiol (NY) 2018;43(7):1723–1738. - PubMed

MeSH terms