Review
. 2021 Jan 15;3(1):e200097.
doi: 10.1148/rycan.2021200097. eCollection 2021 Jan.

Dual-Energy CT Material Decomposition in Pediatric Thoracic Oncology

Affiliations
Review

Dual-Energy CT Material Decomposition in Pediatric Thoracic Oncology

Marilyn J Siegel et al. Radiol Imaging Cancer. .

Abstract

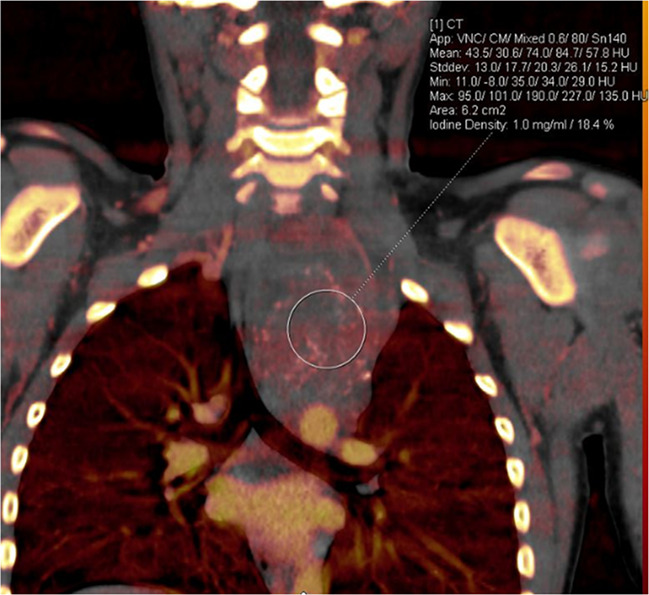
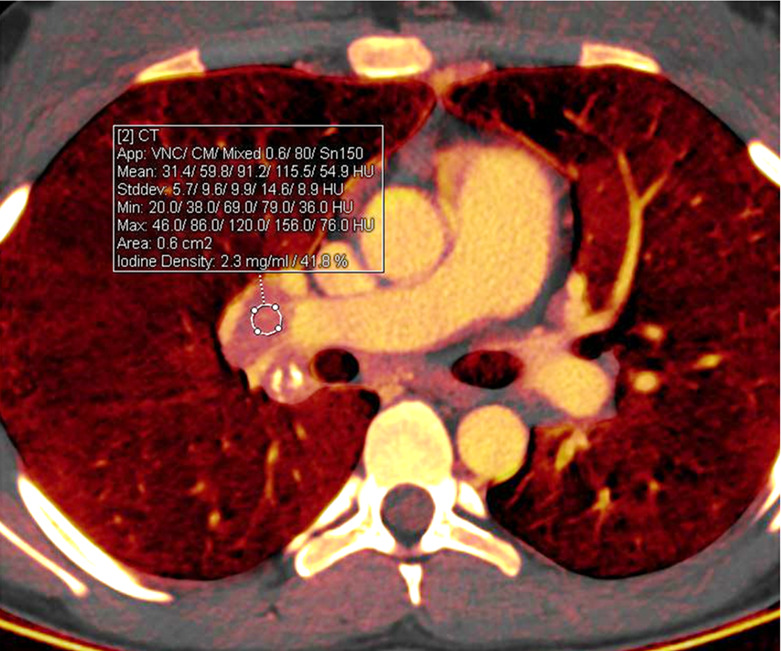
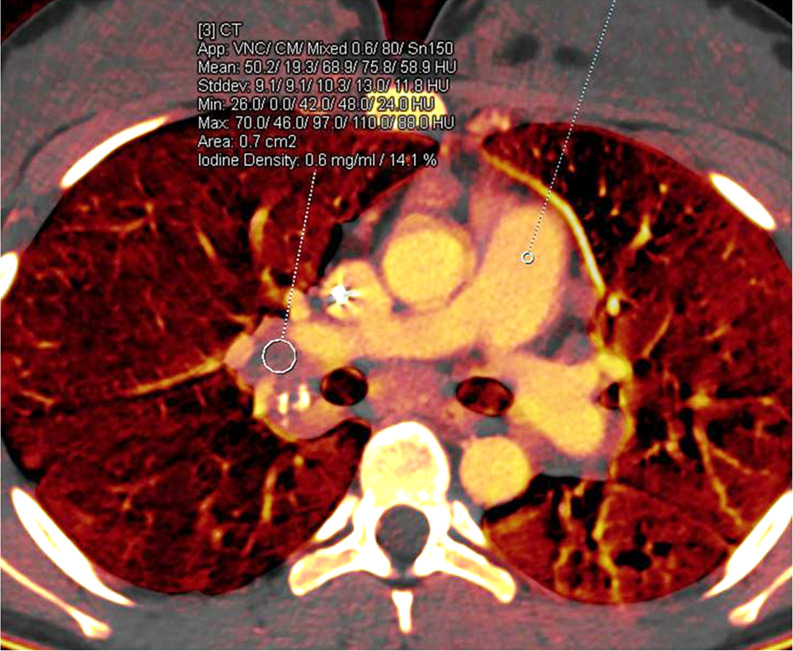
Technical advances in CT have enabled implementation of dual-energy CT into routine clinical practice. By acquiring images at two different energy spectra, dual-energy CT enables material decomposition, allowing generation of material- and energy-specific images. Material-specific images include virtual nonenhanced images and iodine-specific images (iodine maps). Energy-specific images include virtual monoenergetic images. The reconstructed images can provide unique qualitative and quantitative information about tissue composition and contrast media distribution. In thoracic oncologic imaging, dual-energy CT provides advantages in characterization of thoracic malignancies and lung nodules, determination of extent of disease, and assessment of response to therapy. An especially important feature in children is that dual-energy CT does not come at a higher radiation exposure. Keywords: CT, CT-Quantitative, Lung, Mediastinum, Neoplasms-Primary, Pediatrics, Thorax, Treatment Effects © RSNA, 2021.


Conflict of interest statement

Disclosures of Conflicts of Interest: M.J.S. Activities related to the present article: disclosed no relevant relationships. Activities not related to the present article: disclosed money paid to author from Siemens Healthcare for travel and honorarium for lectures, including service on speakers bureaus. Other relationships: disclosed no relevant relationships. S.B. disclosed no relevant relationships. M.C. disclosed no relevant relationships.

Figures

Mediastinal cyst characterization using iodine-specific CT images in a 13-year-old boy with a mediastinal mass detected at chest radiography. (a) Blended image demonstrates a fluid-filled middle mediastinal mass (arrow). The contents measured approximately 30 HU (attenuation slightly above water), suggesting a complex cyst. (b) Iodine-specific image shows absent iodine content confirming diagnosis of a cyst. The absence of iodine is based on comparison to chest wall musculature, which normally has no iodine content. Pathologically proven enteric duplication cyst.
Figure 1a:
Mediastinal cyst characterization using iodine-specific CT images in a 13-year-old boy with a mediastinal mass detected at chest radiography. (a) Blended image demonstrates a fluid-filled middle mediastinal mass (arrow). The contents measured approximately 30 HU (attenuation slightly above water), suggesting a complex cyst. (b) Iodine-specific image shows absent iodine content confirming diagnosis of a cyst. The absence of iodine is based on comparison to chest wall musculature, which normally has no iodine content. Pathologically proven enteric duplication cyst.
Figure 1b:
Mediastinal cyst characterization using iodine-specific CT images in a 13-year-old boy with a mediastinal mass detected at chest radiography. (a) Blended image demonstrates a fluid-filled middle mediastinal mass (arrow). The contents measured approximately 30 HU (attenuation slightly above water), suggesting a complex cyst. (b) Iodine-specific image shows absent iodine content confirming diagnosis of a cyst. The absence of iodine is based on comparison to chest wall musculature, which normally has no iodine content. Pathologically proven enteric duplication cyst.
Benign mediastinal mass in a 16-year-old boy. (a) Coronal 40-keV CT image shows a posterior mediastinal mass. (b) Sagittal iodine-specific CT image shows trace iodine content, measured at 0.3 mg/mL. Circle indicates the region of interest. Note the iodine content in the mass is similar to that of muscle. Ganglioneuroma confirmed on surgical resection. App = application, CM = contrast material, Stddev = standard deviation, VNC = virtual noncontrast.
Figure 2a:
Benign mediastinal mass in a 16-year-old boy. (a) Coronal 40-keV CT image shows a posterior mediastinal mass. (b) Sagittal iodine-specific CT image shows trace iodine content, measured at 0.3 mg/mL. Circle indicates the region of interest. Note the iodine content in the mass is similar to that of muscle. Ganglioneuroma confirmed on surgical resection. App = application, CM = contrast material, Stddev = standard deviation, VNC = virtual noncontrast.
Figure 2b:
Benign mediastinal mass in a 16-year-old boy. (a) Coronal 40-keV CT image shows a posterior mediastinal mass. (b) Sagittal iodine-specific CT image shows trace iodine content, measured at 0.3 mg/mL. Circle indicates the region of interest. Note the iodine content in the mass is similar to that of muscle. Ganglioneuroma confirmed on surgical resection. App = application, CM = contrast material, Stddev = standard deviation, VNC = virtual noncontrast.
Neuroblastoma in a 1-year-old boy. (a) Axial iodine-specific CT image shows iodine content (2.8 mg/mL) within a posterior mediastinal mass (M), as well as iodine content within an area of intraspinal extension (arrow). The iodine content is greater than that of adjacent muscle. (b) Iodine-specific sagittal CT image shows the full extent of the intraspinal tumor extent (arrows).
Figure 3a:
Neuroblastoma in a 1-year-old boy. (a) Axial iodine-specific CT image shows iodine content (2.8 mg/mL) within a posterior mediastinal mass (M), as well as iodine content within an area of intraspinal extension (arrow). The iodine content is greater than that of adjacent muscle. (b) Iodine-specific sagittal CT image shows the full extent of the intraspinal tumor extent (arrows).
Figure 3b:
Neuroblastoma in a 1-year-old boy. (a) Axial iodine-specific CT image shows iodine content (2.8 mg/mL) within a posterior mediastinal mass (M), as well as iodine content within an area of intraspinal extension (arrow). The iodine content is greater than that of adjacent muscle. (b) Iodine-specific sagittal CT image shows the full extent of the intraspinal tumor extent (arrows).
Lymph node characterization in a 16-year-old boy with lymphoma. The iodine-specific CT image shows increased iodine content within mediastinal nodes (arrows) and both hilar areas (arrowheads). The measured iodine content was 1.5 mg/mL.
Figure 4:
Lymph node characterization in a 16-year-old boy with lymphoma. The iodine-specific CT image shows increased iodine content within mediastinal nodes (arrows) and both hilar areas (arrowheads). The measured iodine content was 1.5 mg/mL.
Inflammatory myofibroblastic tumor in a 15-year-old girl. Dual-energy CT iodine-specific image shows virtually no iodine content within this benign mediastinal lymphadenopathy (arrows). The iodine content was 0.4 mg/mL. Biopsy showed myofibroblastic and fibroblastic spindle cells with inflammatory infiltrate of lymphocytes and plasma cells consistent with myofibroblastic tumor.
Figure 5:
Inflammatory myofibroblastic tumor in a 15-year-old girl. Dual-energy CT iodine-specific image shows virtually no iodine content within this benign mediastinal lymphadenopathy (arrows). The iodine content was 0.4 mg/mL. Biopsy showed myofibroblastic and fibroblastic spindle cells with inflammatory infiltrate of lymphocytes and plasma cells consistent with myofibroblastic tumor.
Malignant lung nodule in a 17-year-old girl with history of paraganglioma of the left neck. (a) Lung window CT image shows a well-defined right lower lobe nodule. (b) Axial iodine-specific CT image shows an iodine-containing right lower lobe nodule with an iodine density of 4.7 mg/mL. The nodule was surgically proven to be metastatic paraganglioma. Circles are ROIs on long nodule and aorta. App = application, CM = contrast material, Norm = normal, ROI = region of interest, Stddev = standard deviation, VNC = virtual noncontrast.
Figure 6a:
Malignant lung nodule in a 17-year-old girl with history of paraganglioma of the left neck. (a) Lung window CT image shows a well-defined right lower lobe nodule. (b) Axial iodine-specific CT image shows an iodine-containing right lower lobe nodule with an iodine density of 4.7 mg/mL. The nodule was surgically proven to be metastatic paraganglioma. Circles are ROIs on long nodule and aorta. App = application, CM = contrast material, Norm = normal, ROI = region of interest, Stddev = standard deviation, VNC = virtual noncontrast.
Figure 6b:
Malignant lung nodule in a 17-year-old girl with history of paraganglioma of the left neck. (a) Lung window CT image shows a well-defined right lower lobe nodule. (b) Axial iodine-specific CT image shows an iodine-containing right lower lobe nodule with an iodine density of 4.7 mg/mL. The nodule was surgically proven to be metastatic paraganglioma. Circles are ROIs on long nodule and aorta. App = application, CM = contrast material, Norm = normal, ROI = region of interest, Stddev = standard deviation, VNC = virtual noncontrast.
Fungal infection in a 15-year-old boy being treated for lymphoma. (a) Iodine-specific CT image shows iodine content within a left lower lobe nodule (arrow).The iodine concentration was 2.4 mg/mL. (b) Lung window CT image shows an ill-defined lung nodule with a surrounding halo (arrow). Biopsy yielded Aspergillus.
Figure 7a:
Fungal infection in a 15-year-old boy being treated for lymphoma. (a) Iodine-specific CT image shows iodine content within a left lower lobe nodule (arrow).The iodine concentration was 2.4 mg/mL. (b) Lung window CT image shows an ill-defined lung nodule with a surrounding halo (arrow). Biopsy yielded Aspergillus.
Figure 7b:
Fungal infection in a 15-year-old boy being treated for lymphoma. (a) Iodine-specific CT image shows iodine content within a left lower lobe nodule (arrow).The iodine concentration was 2.4 mg/mL. (b) Lung window CT image shows an ill-defined lung nodule with a surrounding halo (arrow). Biopsy yielded Aspergillus.
Liver metastases in a 10-year-old boy with desmoplastic small round cell tumor metastatic to chest and liver. (a) Blended CT image shows poorly defined hypoattenuating lesions in the right hepatic lobe (arrows). (b) Iodine-enhanced CT image increases lesion conspicuity and also shows some iodine content within the lesion (arrows).
Figure 8a:
Liver metastases in a 10-year-old boy with desmoplastic small round cell tumor metastatic to chest and liver. (a) Blended CT image shows poorly defined hypoattenuating lesions in the right hepatic lobe (arrows). (b) Iodine-enhanced CT image increases lesion conspicuity and also shows some iodine content within the lesion (arrows).
Figure 8b:
Liver metastases in a 10-year-old boy with desmoplastic small round cell tumor metastatic to chest and liver. (a) Blended CT image shows poorly defined hypoattenuating lesions in the right hepatic lobe (arrows). (b) Iodine-enhanced CT image increases lesion conspicuity and also shows some iodine content within the lesion (arrows).
Incidentally detected hepatic lesion in a 3-year-old girl who had undergone a left nephrectomy for Wilms tumor. Axial iodine-enhanced CT image shows a hepatic mass with minimal iodine content (0.4 mg/mL). Circles are ROIs placed on liver and aorta. MRI confirmed a hepatic cyst. App = application, CM = contrast material, ROI = region of interest, Stddev = standard deviation, VNC = virtual noncontrast.
Figure 9:
Incidentally detected hepatic lesion in a 3-year-old girl who had undergone a left nephrectomy for Wilms tumor. Axial iodine-enhanced CT image shows a hepatic mass with minimal iodine content (0.4 mg/mL). Circles are ROIs placed on liver and aorta. MRI confirmed a hepatic cyst. App = application, CM = contrast material, ROI = region of interest, Stddev = standard deviation, VNC = virtual noncontrast.
Treatment response in a 6-year-old girl with neuroblastoma. (a) Baseline iodine-specific CT image shows increased iodine content in a posterior mediastinal mass. Circle indicates region of interest over mediastinal mass. The iodine concentration was 2.4 mg/mL. (b) Iodine-specific CT image 4 months later shows decreased iodine content within the mass. Circle indicates region of interest over mediastinal mass. Findings are consistent with partial treatment response. Note that tumor size did not change between the two time points. Iodine 123 meta-iodobenzylguanidine study showed minimal residual metabolic activity and improved from baseline. App = application, CM = contrast material, Stddev = standard deviation, VNC = virtual noncontrast.
Figure 10a:
Treatment response in a 6-year-old girl with neuroblastoma. (a) Baseline iodine-specific CT image shows increased iodine content in a posterior mediastinal mass. Circle indicates region of interest over mediastinal mass. The iodine concentration was 2.4 mg/mL. (b) Iodine-specific CT image 4 months later shows decreased iodine content within the mass. Circle indicates region of interest over mediastinal mass. Findings are consistent with partial treatment response. Note that tumor size did not change between the two time points. Iodine 123 meta-iodobenzylguanidine study showed minimal residual metabolic activity and improved from baseline. App = application, CM = contrast material, Stddev = standard deviation, VNC = virtual noncontrast.
Figure 10b:
Treatment response in a 6-year-old girl with neuroblastoma. (a) Baseline iodine-specific CT image shows increased iodine content in a posterior mediastinal mass. Circle indicates region of interest over mediastinal mass. The iodine concentration was 2.4 mg/mL. (b) Iodine-specific CT image 4 months later shows decreased iodine content within the mass. Circle indicates region of interest over mediastinal mass. Findings are consistent with partial treatment response. Note that tumor size did not change between the two time points. Iodine 123 meta-iodobenzylguanidine study showed minimal residual metabolic activity and improved from baseline. App = application, CM = contrast material, Stddev = standard deviation, VNC = virtual noncontrast.
Treatment response in a 16-year-old girl with lymphoma. (a) Baseline iodine-specific CT image shows iodine content in a right hilar node. Circle indicates region of interest. The iodine concentration was 2.3 mg/mL. (b) Iodine-specific CT image 2 months later shows decreased iodine content. Circles indicate regions of interest within hilar node and pulmonary artery. The iodine concentration was 0.6 mg/mL. Findings are consistent with complete treatment response. Complete response confirmed at PET/CT. App = application, CM = contrast material, Stddev = standard deviation, VNC = virtual noncontrast.
Figure 11a:
Treatment response in a 16-year-old girl with lymphoma. (a) Baseline iodine-specific CT image shows iodine content in a right hilar node. Circle indicates region of interest. The iodine concentration was 2.3 mg/mL. (b) Iodine-specific CT image 2 months later shows decreased iodine content. Circles indicate regions of interest within hilar node and pulmonary artery. The iodine concentration was 0.6 mg/mL. Findings are consistent with complete treatment response. Complete response confirmed at PET/CT. App = application, CM = contrast material, Stddev = standard deviation, VNC = virtual noncontrast.
Figure 11b:
Treatment response in a 16-year-old girl with lymphoma. (a) Baseline iodine-specific CT image shows iodine content in a right hilar node. Circle indicates region of interest. The iodine concentration was 2.3 mg/mL. (b) Iodine-specific CT image 2 months later shows decreased iodine content. Circles indicate regions of interest within hilar node and pulmonary artery. The iodine concentration was 0.6 mg/mL. Findings are consistent with complete treatment response. Complete response confirmed at PET/CT. App = application, CM = contrast material, Stddev = standard deviation, VNC = virtual noncontrast.

References

    1. Goo HW, Goo JM. Dual-energy CT: New Horizon in medical imaging. Korean J Radiol 2017;18(4):555–569. - PMC - PubMed
    1. McCollough CH, Leng S, Yu L, Fletcher JG. Dual- and multi-energy CT: principles, technical approaches, and clinical applications. Radiology 2015;276(3):637–653. - PMC - PubMed
    1. Megibow AJ, Kambadakone A, Ananthakrishnan L. Dual-Energy Computed Tomography: Image Acquisition, Processing, and Workflow. Radiol Clin North Am 2018;56(4):507–520. - PubMed
    1. Rajiah P, Parakh A, Kay F, Baruah D, Kambadakone A, Leng S. Update on Multienergy CT: Physics, Principles, and Applications. RadioGraphics 2020;40(5):1284–1308. - PubMed
    1. Siegel MJ, Kaza RK, Bolus DN, et al. White Paper of the Society of Computed Body Tomography and Magnetic Resonance on Dual-Energy CT, Part 1: Technology and Terminology. J Comput Assist Tomogr 2016;40(6):841–845. - PubMed