. 2021 Mar 18;2(1):100379.
doi: 10.1016/j.xpro.2021.100379. eCollection 2021 Mar 19.

Live imaging and quantitation of nascent transcription using the MS2/MCP system in the Drosophila embryo

Affiliations

Live imaging and quantitation of nascent transcription using the MS2/MCP system in the Drosophila embryo

Caroline Hoppe et al. STAR Protoc. .

Abstract

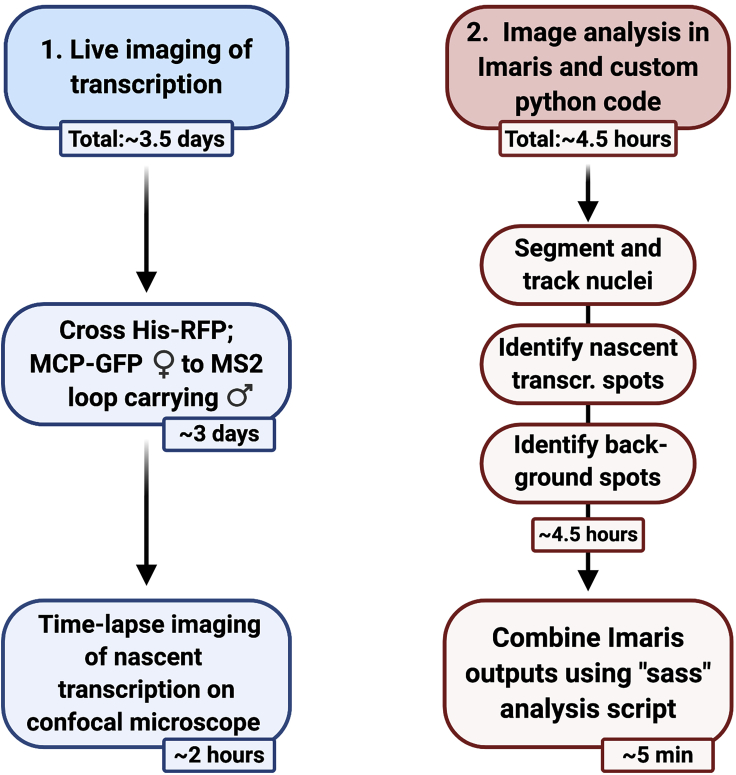
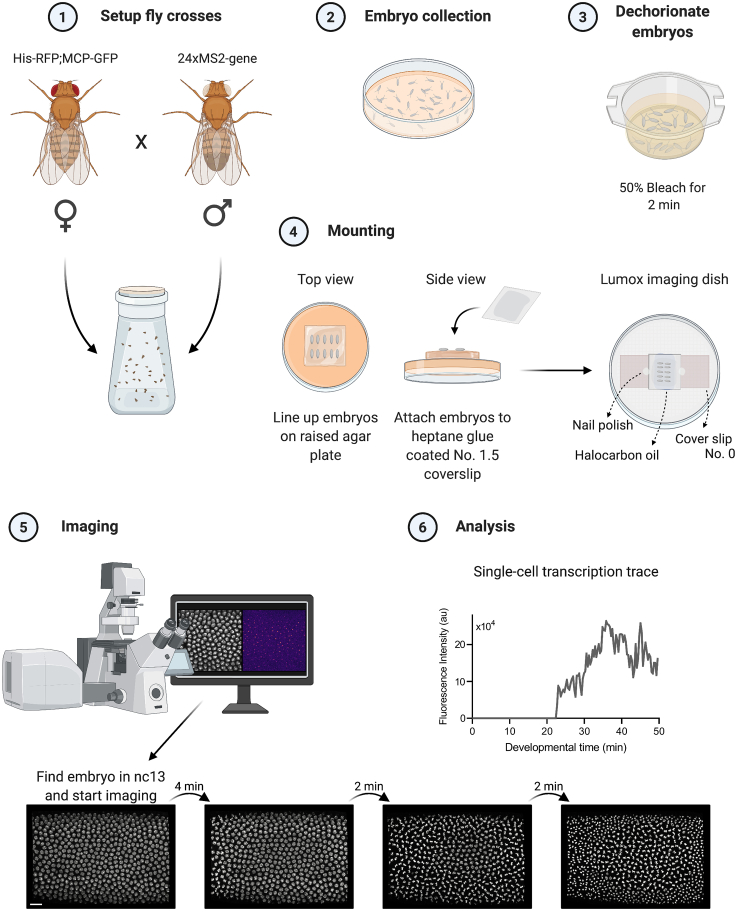
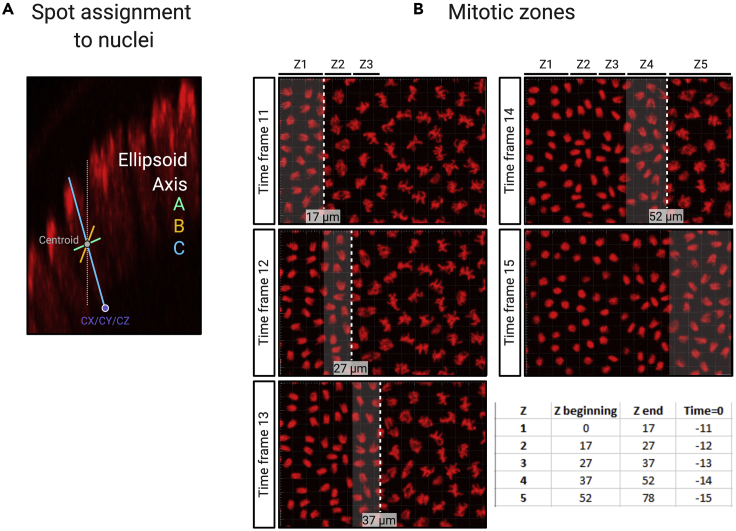
Visualizing transcription live in Drosophila is providing important new insights into the spatiotemporal regulation of transcription. Here, we describe a protocol to visualize and quantitate transcription from gene loci that are tagged with MS2 stem-loop sequences in the Drosophila embryo. MS2 stem-loop sequences are recognized by a coat protein fused to a fluorescent protein and visualized with microscopy. We also describe an analysis pipeline to extract and subsequently quantify transcription dynamics. For complete details on the use and execution of this protocol, please refer to Hoppe et al. (2020).

Keywords: Gene expression; Microscopy; Model organisms; Molecular biology.


Conflict of interest statement

The authors declare no competing interests.

Figures

None
Graphical abstract
Figure 1
Figure 1
Visualization of transcription with the MS2/MCP imaging system The MS2 live imaging system uses RNA stem-loop repeats, derived from the MS2 bacteriophage that are bound by the cognate MS2-coat protein (MCP) fused to a fluorescent protein. Transcription factor = TF.
Figure 2
Figure 2
Overview showing image acquisition and image analysis covered in this protocol The steps are outlined with associated timings.
Figure 3
Figure 3
Overview of the live imaging experiment Female virgin flies (His-RFP; MCP-GFP) are crossed to homozygous males (24xMS2-gene) and kept in a collection bottle (1). Embryos are aged for 90 min and collected on apple juice agar plates (2) before embryos are dechorionated using 50% bleach (3). Dried embryos are lined up on a raised agar plate and attached to a heptane glue coated cover slip, which is added on top of a cover slip/halocarbon oil bridge (4). Embryo development is imaged on a confocal microscope (5), and single-cell fluorescent traces are extracted during subsequent analysis (6).
Figure 4
Figure 4
Semi-automated analysis pipeline The developing Drosophila embryo is imaged over time using z-slices to cover the full depth of the nucleus and capture the full fluorescence (1). Images can be analyzed in the Imaris software (2), which allows the images to be rendered in 3D (3). The time-lapse dataset is cropped to a region of interest for further analysis. Nuclei are segmented using the “surfaces” module, the His-RFP channel and either “absolute intensity” or “background subtraction” thresholding (4), before they are tracked through time using an autoregressive motion algorithm (5). Transcription sites are segmented using the “spots” function and the MCP-GFP channel (6).
Figure 5
Figure 5
Spot assignment and mitotic wave correction (A) Each nascent transcription site is assigned to the closest nucleus in three dimensions using the proximity to the nuclear ellipsoid axis C (blue). Use of the ellipsoid axis C instead of a perpendicular axis (white line) results in a more accurate spot assignment in curved regions of the embryo. (B) Time differences arising from the mitotic wave are corrected during the analysis. The expression domain is separated into mitotic zones that contain nuclei that undergo telophase in the same frame. The x-axis positions of the zone borders are recorded together with the number of time frames that need to be adjusted in order to reset t = 0.
Figure 6
Figure 6
Combining the Imaris output files of nuclei and spots using a custom python script The statistic files of spots and surfaces are exported from the Imaris software (1) and saved in a subfolder. Using the custom python script “sass,” each detected transcription site is assigned to the closest nucleus (2). “Sass” outputs multiple images to investigate the analysis accuracy including plots of the expression domain (3) and the percent of nuclei that were wrongly assigned 2 or 3 spots (4). All the data are outputted in a large data file (5).
Figure 7
Figure 7
Analysis of 24xMS2-ush transcription profiles in the Drosophila embryo (A) Still from a cropped time lapse movie maximum projected showing active ush transcription. Transcription is shown by MCP-GFP fluorescence (gray) and nuclei are shown by His-RFP (magenta). The enlarged region (lower panel) shows one active transcription site per nucleus. (B) Representative transcription traces of ush over developmental time. Nuclear IDs are shown for identification of the traces in the example dataset. (C) Transcription onset times of ush. (D) Mean ush fluorescence over time combines the fluorescence values for all nuclei. (E) Heatmap of single-cell fluorescence- traces, sorted according to transcription onset (scale as indicated). Scale bar, 15 μm (A, top) and 10 μm (A, bottom). Median (C) and mean ± 95% confidence intervals (D). (C)–(E) contain data from 116 nuclei that are tracked and present in the example dataset.

References

    1. Ashe H.L., Mannervik M., Levine M. Dpp signaling thresholds in the dorsal ectoderm of the Drosophila embryo. Development. 2000;127:3305–3312. - PubMed
    1. Berrocal A., Lammers N., Garcia H.G., Eisen M.B. Kinetic sculpting of the seven stripes of the Drosophila even-skipped gene. Elife. 2020;9:e61635. - PMC - PubMed
    1. Bertrand E., Chartrand P., Schaefer M., Shenoy S.M., Singer R.H., Long R.M. Localization of ASH1 mRNA particles in living yeast. Mol. Cell. 1998;2:437–445. - PubMed
    1. Bothma J.P., Garcia H.G., Esposito E., Schlissel G., Gregor T., Levine M. Dynamic regulation of eve stripe 2 expression reveals transcriptional bursts in living Drosophila embryos. Proc. Natl. Acad. Sci. U S A. 2014;111:10598–10603. - PMC - PubMed
    1. Bothma J.P., Garcia H.G., Ng S., Perry M.W., Gregor T., Levine M. Enhancer additivity and non-additivity are determined by enhancer strength in the Drosophila embryo. eLife. 2015;4 - PMC - PubMed

Publication types

MeSH terms

LinkOut - more resources