. 2021 Apr 20;2(4):100242.
doi: 10.1016/j.xcrm.2021.100242. Epub 2021 Mar 23.

Spatial mapping of SARS-CoV-2 and H1N1 lung injury identifies differential transcriptional signatures

Affiliations

Spatial mapping of SARS-CoV-2 and H1N1 lung injury identifies differential transcriptional signatures

Camilla Margaroli et al. Cell Rep Med. .

Abstract

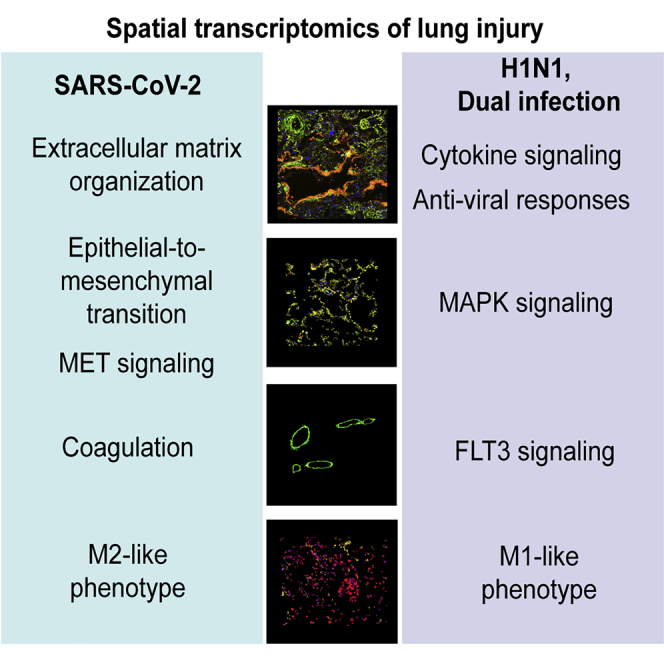
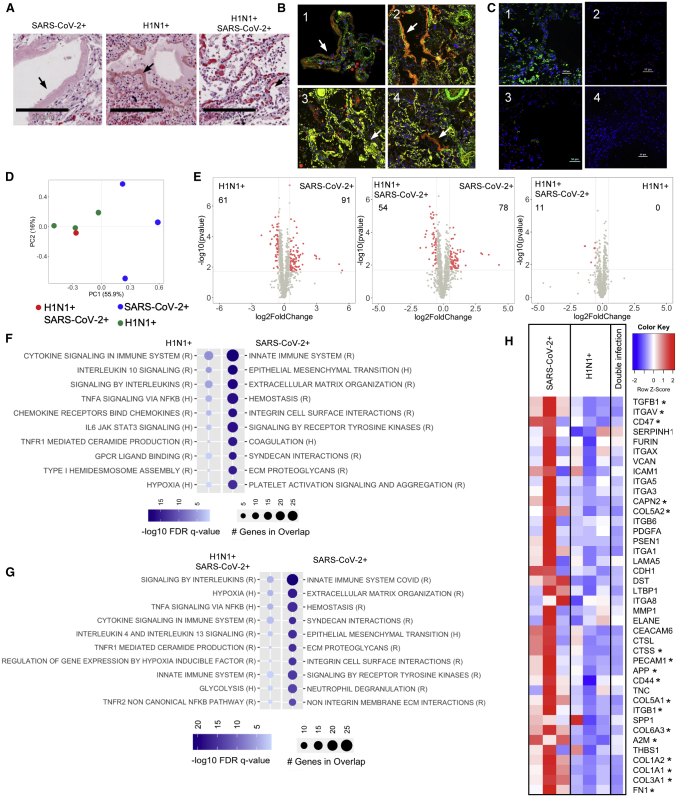
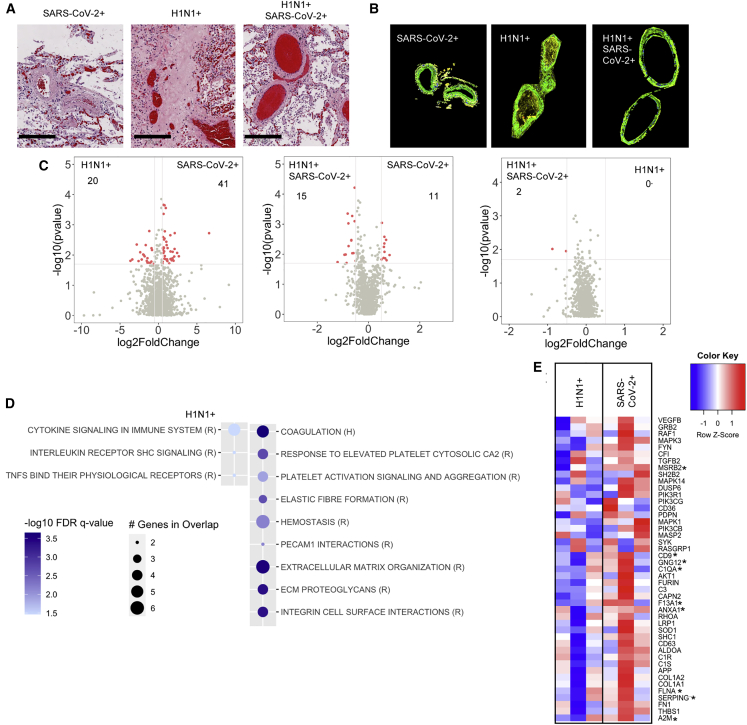
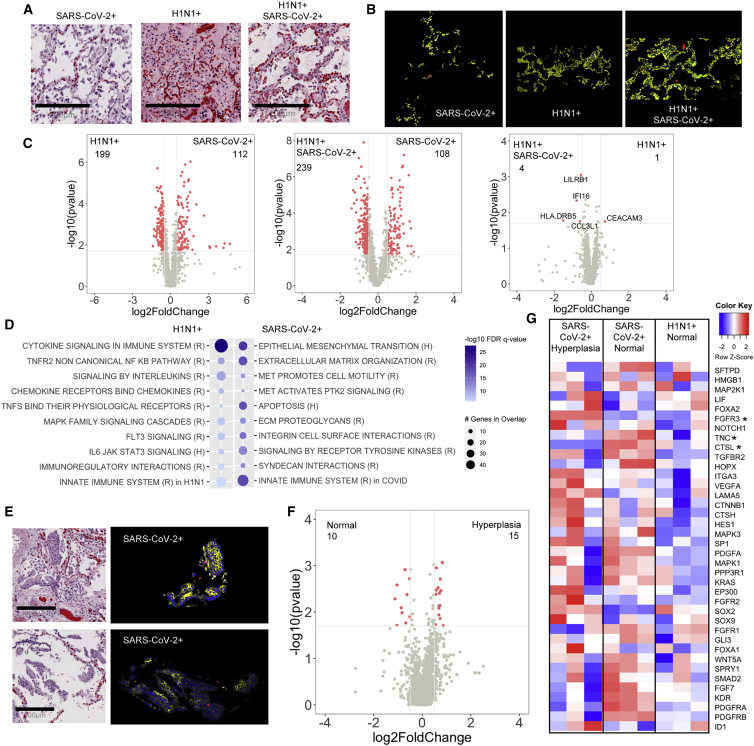
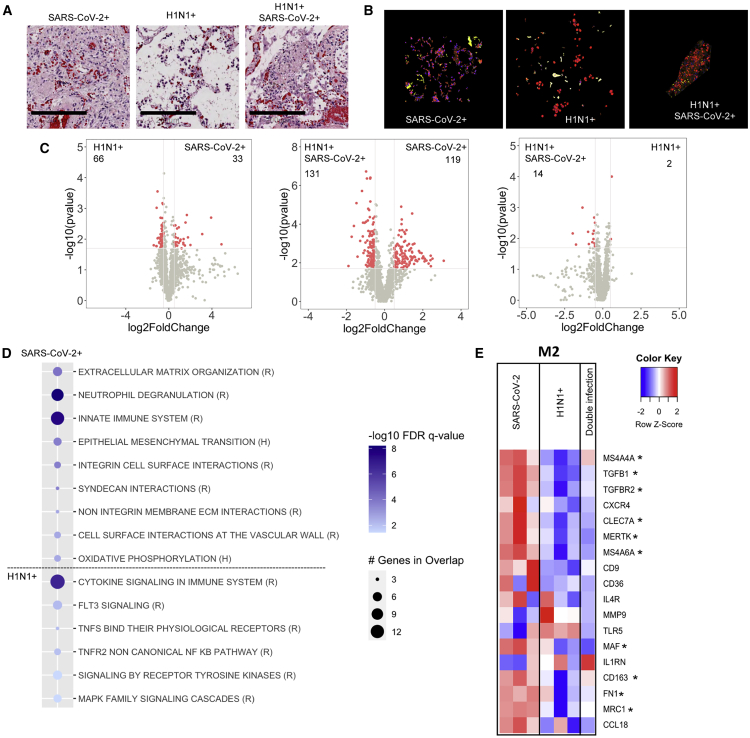
Severe SARS-CoV-2 infection often leads to the development of acute respiratory distress syndrome (ARDS), with profound pulmonary patho-histological changes post-mortem. It is not clear whether ARDS from SARS-CoV-2 is similar to that observed in influenza H1N1, another common viral cause of lung injury. Here, we analyze specific ARDS regions of interest utilizing a spatial transcriptomic platform on autopsy-derived lung tissue from patients with SARS-CoV-2 (n = 3), H1N1 (n = 3), and a dual infected individual (n = 1). Enhanced gene signatures in alveolar epithelium, vascular tissue, and lung macrophages identify not only increased regional coagulopathy but also increased extracellular remodeling, alternative macrophage activation, and squamous metaplasia of type II pneumocytes in SARS-CoV-2. Both the H1N1 and dual-infected transcriptome demonstrated an enhanced antiviral response compared to SARS-CoV-2. Our results uncover regional transcriptional changes related to tissue damage/remodeling, altered cellular phenotype, and vascular injury active in SARS-CoV-2 and present therapeutic targets for COVID-19-related ARDS.

Keywords: ARDS; COVID-19; H1N1 influenza; SARS-CoV-2; spatial transcriptomics.


Conflict of interest statement

K.T., Y.L., and L.Z. are employees of Nanostring technologies. There is no financial conflict of interest to disclose for this study (all services provided by Nanostring technologies were paid under the grants awarded to the senior author).

Figures

None
Graphical abstract
Figure 1
Figure 1
SARS-CoV-2-induced lung injury shows a discrete transcriptional signature (A) Histological analysis of tissues sections stained by H&E (scale bars, 200 μm) revealed presence of ARDS in all three patient groups; arrows indicate hyaline membranes. (B) Immunofluorescent staining (10× magnification) of α-SMA (green), CD68 (red), and EpCAM (yellow) in SARS-CoV-2 (1), H1N1 (2), double infected (3), and areas of low viral load (4); arrows indicate hyaline membranes. (C) Immunofluorescent staining of SARS-CoV-2 (green), H1N1 (red), and DAPI (blue) in SARS-CoV-2 (1), H1N1 (2), double infected (3), and areas of low viral load (4). Scale bars, 50 μm. (D) PCA analysis of transcriptional signatures in total lung injury. (E–G) Differential gene-expression analysis and gene set enrichment analysis (GSEA) using reactome (R) and hallmark (H) datasets for upregulated or downregulated genes in SARS-CoV-2-infected patients (n = 3) compared to (F) H1N1 (n = 3) or (G) SARS-CoV-2/H1N1 (n = 1). Differential gene expression was defined as p = 0.02 and log2 fold change of 0.5. (H) Heatmap representation of genes involved in tissue remodeling and their relative expression in all three types of infection (asterisk indicates significant genes between H1N1 and SARS-CoV-2 shown in the volcano plot).
Figure 2
Figure 2
SARS-CoV-2 infection induces a hypercoagulopathy transcriptional program in the pulmonary vascular bed (A and B) Histological analysis of the lung vascular bed stained (A) by H&E (scale bars, 200 μm) or (B) by immunofluorescence for α-SMA (green). (C and D) Differential gene-expression analysis (C) and GSEA using reactome (R) and hallmark (H) datasets (D) for upregulated or downregulated genes in SARS-CoV-2-infected patients compared to H1N1. Differential gene expression was defined as p = 0.02 and log2 fold change of 0.5. (E) Heatmap representation of genes involved in coagulation, complement, and platelet activation and their relative expression in all SARS-CoV-2 and H1N1 infection (asterisk indicates significant genes between H1N1 and SARS-CoV-2 shown in the volcano plot). SARS-CoV-2-infected patients (n = 3), H1N1 (n = 3), and SARS-CoV-2/H1N1 (n = 1).
Figure 3
Figure 3
SARS-CoV-2 infection promotes alveolar epithelial hyperplasia (A and B) Histological analysis of the alveolar epithelium stained (A) by H&E (scale bars, 200 μm) or (B) by immunofluorescence for EpCAM (yellow). (C and D) Differential gene-expression analysis (C) and GSEA using reactome (R) and hallmark (H) datasets (D) for upregulated or downregulated genes in SARS-CoV-2-infected patients compared to H1N1. (E) Histological analysis of alveolar epithelium (scale bars, 200 μm for H&E) in SARS-CoV-2 patients shows cellular hyperplasia in H&E with EpCAM+ immunofluorescent staining (yellow). (F) Differential gene-expression analysis of normal and hyperplastic alveolar epithelium in SARS-CoV-2-infected patients. (G) Heatmap representation of genes involved in alveolar epithelium proliferation (GO:0060502) and their relative expression in all SARS-CoV-2 normal alveolar epithelium, hyperplastic alveolar epithelium, and H1N1 normal alveolar epithelium (asterisk indicates significant genes between H1N1 and SARS-CoV-2 shown in the volcano plot). Differential gene expression was defined as p = 0.02 and log2 fold change of 0.5. SARS-CoV-2-infected patients (n = 3), H1N1 (n = 3), and SARS-CoV-2/H1N1 (n = 1).
Figure 4
Figure 4
SARS-CoV-2 infection induces an alternative activation phenotype in lung macrophages (A and B) Histological analysis of the lung macrophages (scale bars, 200 μm) stained by H&E (A) and immunofluorescence for CD68 (red) (B). (C and D) Differential gene-expression analysis (C) and GSEA using reactome (R) and hallmark (H) datasets (D) for upregulated or downregulated genes in SARS-CoV-2-infected patients compared to H1N1. (E) Heatmap representation of genes defining a pro-inflammatory (M1) or alternative activated (M2) macrophage phenotype (asterisk indicates significant genes between H1N1 and SARS-CoV-2 shown in the volcano plots). Differential gene expression was defined as p = 0.02 and log2 fold change of 0.5. SARS-CoV-2-infected patients (n = 3), H1N1 (n = 3), and SARS-CoV-2/H1N1 (n = 1).

References

    1. Narula T., Safley M., deBoisblanc B.P. H1N1-associated acute respiratory distress syndrome. Am. J. Med. Sci. 2010;340:499–504. - PMC - PubMed
    1. Wu F., Zhao S., Yu B., Chen Y.M., Wang W., Song Z.G., Hu Y., Tao Z.W., Tian J.H., Pei Y.Y. A new coronavirus associated with human respiratory disease in China. Nature. 2020;579:265–269. - PMC - PubMed
    1. Wang D., Hu B., Hu C., Zhu F., Liu X., Zhang J., Wang B., Xiang H., Cheng Z., Xiong Y. Clinical Characteristics of 138 Hospitalized Patients With 2019 Novel Coronavirus-Infected Pneumonia in Wuhan China. JAMA. 2020;323:1061–1069. - PMC - PubMed
    1. Auld S.C., Caridi-Scheible M., Blum J.M., Robichaux C., Kraft C., Jacob J.T., Jabaley C.S., Carpenter D., Kaplow R., Hernandez-Romieu A.C., Emory COVID-19 Quality and Clinical Research Collaborative ICU and Ventilator Mortality Among Critically Ill Adults With Coronavirus Disease 2019. Crit. Care Med. 2020;48:e799–e804. - PMC - PubMed
    1. Bhatraju P.K., Ghassemieh B.J., Nichols M., Kim R., Jerome K.R., Nalla A.K., Greninger A.L., Pipavath S., Wurfel M.M., Evans L. Covid-19 in Critically Ill Patients in the Seattle Region - Case Series. N. Engl. J. Med. 2020;382:2012–2022. - PMC - PubMed

Publication types

MeSH terms