

A Cascade-SEME network for COVID-19 detection in chest x-ray images
- PMID: 33778966
- PMCID: PMC8250185
- DOI: 10.1002/mp.14711
A Cascade-SEME network for COVID-19 detection in chest x-ray images
Abstract
Purpose: The worldwide spread of the SARS-CoV-2 virus poses unprecedented challenges to medical resources and infection prevention and control measures around the world. In this case, a rapid and effective detection method for COVID-19 can not only relieve the pressure of the medical system but find and isolate patients in time, to a certain extent, slow down the development of the epidemic. In this paper, we propose a method that can quickly and accurately diagnose whether pneumonia is viral pneumonia, and classify viral pneumonia in a fine-grained way to diagnose COVID-19.
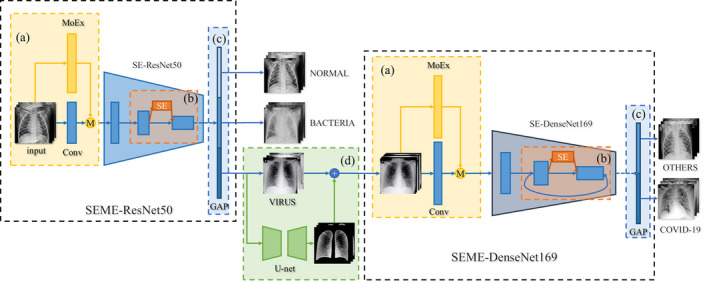
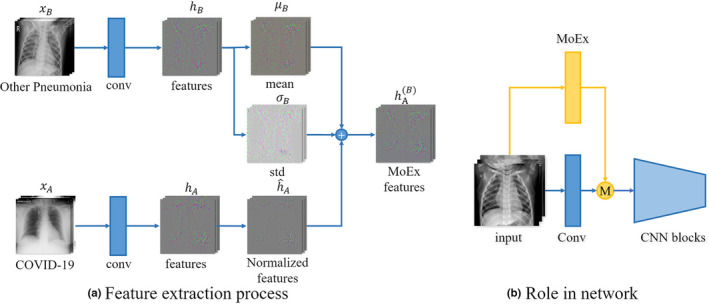
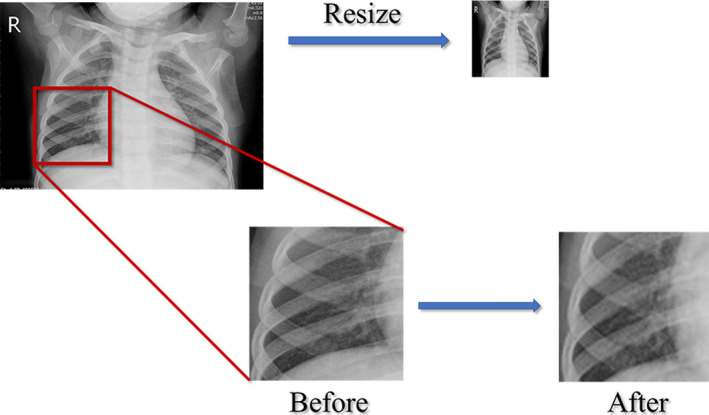
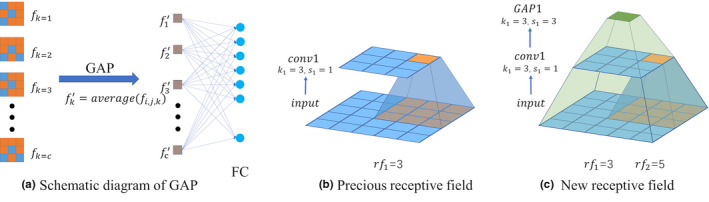
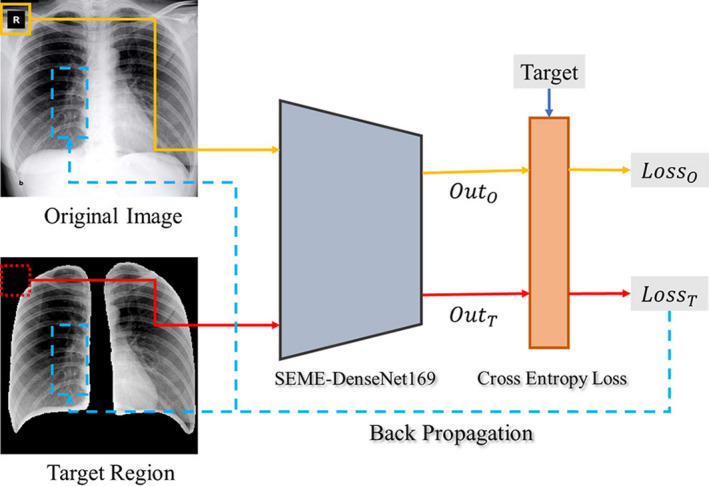
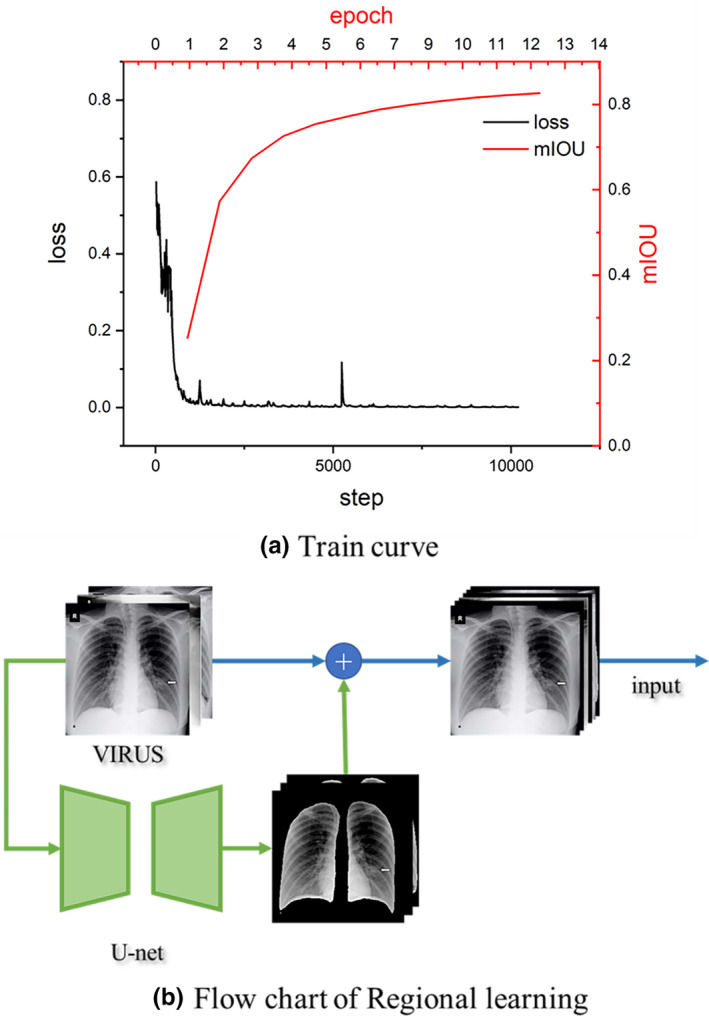
Methods: We proposed a Cascade Squeeze-Excitation and Moment Exchange (Cascade-SEME) framework that can effectively detect COVID-19 cases by evaluating the chest x-ray images, where SE is the structure we designed in the network which has attention mechanism, and ME is a method for image enhancement from feature dimension. The framework integrates a model for a coarse level detection of virus cases among other forms of lung infection, and a model for fine-grained categorisation of pneumonia types identifying COVID-19 cases. In addition, a Regional Learning approach is proposed to mitigate the impact of non-lesion features on network training. The network output is also visualised, highlighting the likely areas of lesion, to assist experts' assessment and diagnosis of COVID-19.
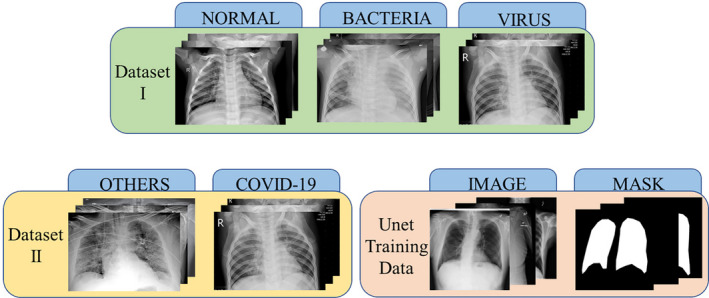
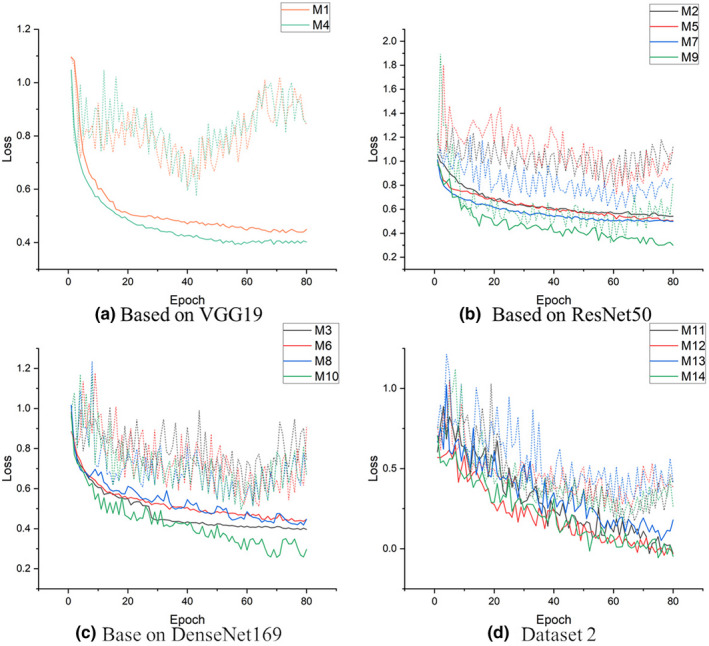
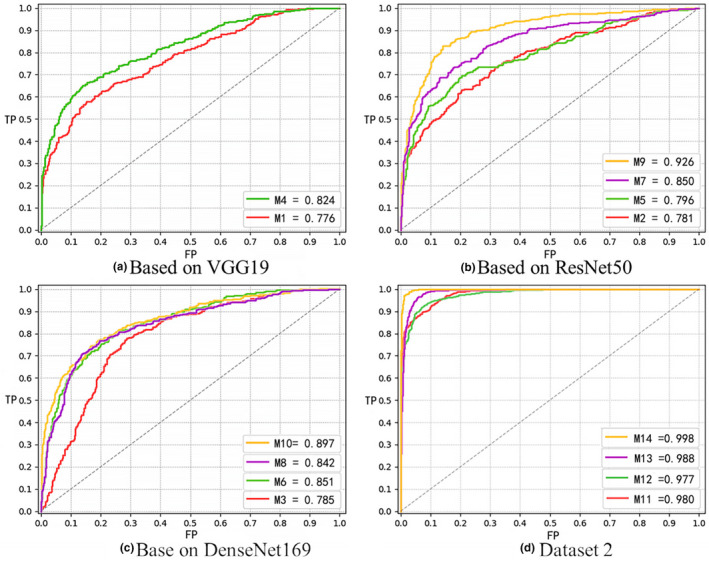
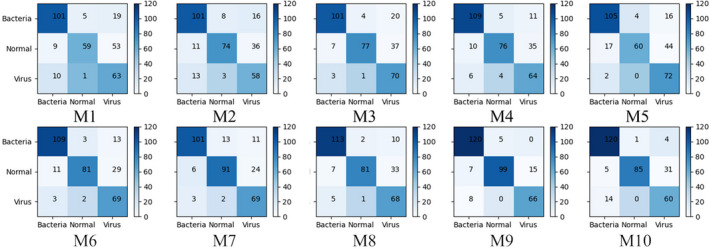
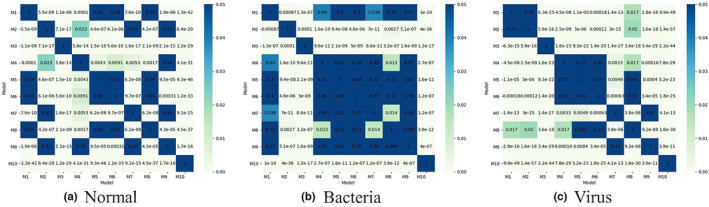
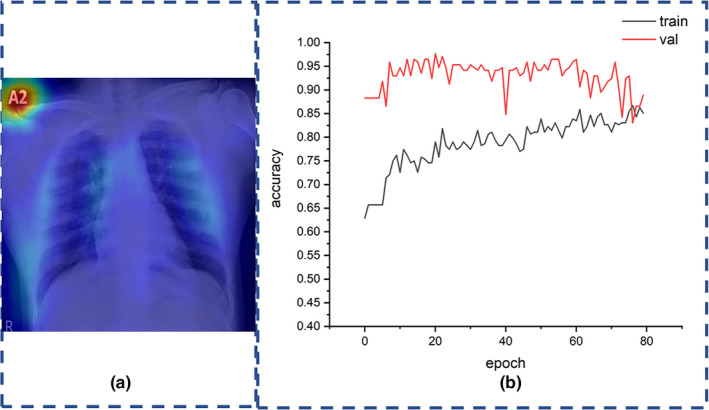
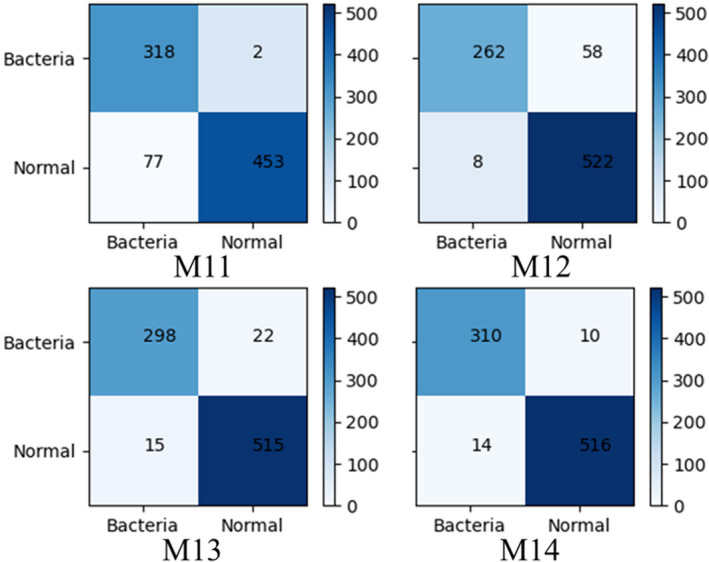
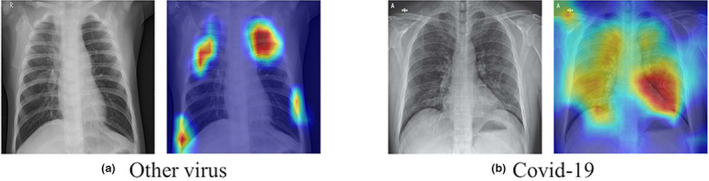
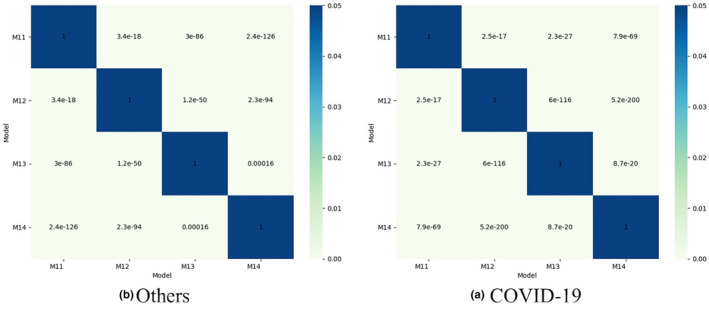
Results: Three datasets were used: a set of Chest x-ray Images for Classification with bacterial pneumonia, viral pneumonia and normal chest x-rays, a COVID chest x-ray dataset with COVID-19, and a Lung Segmentation dataset containing 1000 chest x-rays with masks in the lung region. We evaluated all the models on the test set. The results shows the proposed SEME structure significantly improves the performance of the models: in the task of pneumonia infection type diagnosis, the sensitivity, specificity, accuracy and F1 score of ResNet50 with SEME structure are significantly improved in each category, and the accuracy and AUC of the whole test set are also enhanced; in the detection task of COVID-19, the evaluation results shows that when SEME structure was added to the task, the sensitivities, specificities, accuracy and F1 scores of ResNet50 and DenseNet169 are improved. Although the sensitivities and specificities are not significantly promoted, SEME well balanced these two significant indicators. Regional learning also plays an important role. Experiments show that Regional Learning can effectively correct the impact of non-lesion features on the network, which can be seen in the Grad-CAM method.
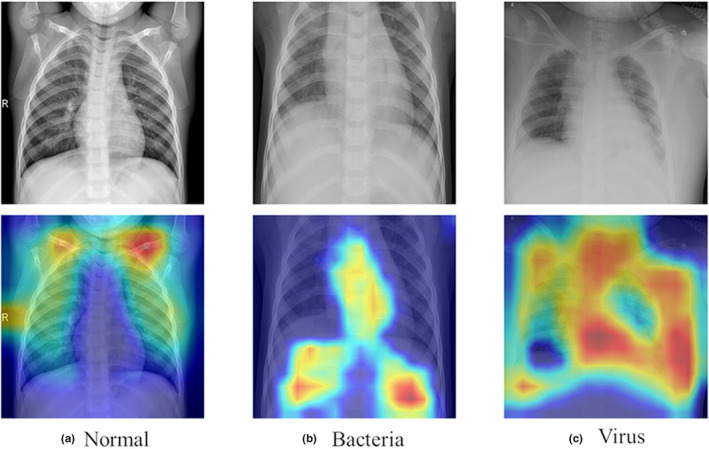
Conclusions: Experiments show that after the application of SEME structure in the network, the performance of SEME-ResNet50 and SEME-DenseNet169 in both two datasets show a clear enhancement. And the proposed regional learning method effectively directs the network's attention to focus on relevant pathological regions in the lung radiograph, ensuring the performance of the proposed framework even when a small training set is used. The visual interpretation step using Grad-CAM finds that the region of attention on radiographs of different types of pneumonia are located in different regions of the lungs.
Keywords: COVID-19; Cascade-SEMEnet; chest x-rays; grad-CAM; regional learning.
© 2021 American Association of Physicists in Medicine.
Conflict of interest statement
The authors have no conflicts to disclose.
Figures

References
-
- T. N. C. P. E. R. E. Team . The epidemiological characteristics of an outbreak of 2019 novel coronavirus diseases (COVID‐19) in China. Chinese J Epidemiol. 2020;145–151.
-
- Wadman M, Couzin‐Frankel J, Jocelyn Kaiser CM. How does coronavirus kill? Clinicians trace a ferocious rampage through the body from brain to toes. Science. 2020;38:1885–1898.
-
- Servick K. For survivors of severe COVID‐19, beating the virus is just the beginning. Science. 2020;368(6489):359. - PubMed
-
- Selvaraju RR, Cogswell M, Das A, Vedantam R, Parikh D, Batra D. Grad‐CAM: visual explanations from deep networks via gradient‐based localization. Int J Comput Vis. 2020;128:336–359. 10.1007/s11263-019-01228-7. - DOI
-
- Chandra TB, Verma K, Jain D, Netam SS. Localization of the Suspected Abnormal Region in Chest Radiograph Images. IEEE; 2020:204–209.
MeSH terms
Grants and funding
LinkOut - more resources
Full Text Sources
Other Literature Sources
Medical
Miscellaneous
