. 2021 May 1;320(5):E914-E924.
doi: 10.1152/ajpendo.00501.2020. Epub 2021 Mar 29.

Liver glycogen-induced enhancements in hypoglycemic counterregulation require neuroglucopenia

Affiliations

Liver glycogen-induced enhancements in hypoglycemic counterregulation require neuroglucopenia

Shana O Warner et al. Am J Physiol Endocrinol Metab. .

Abstract

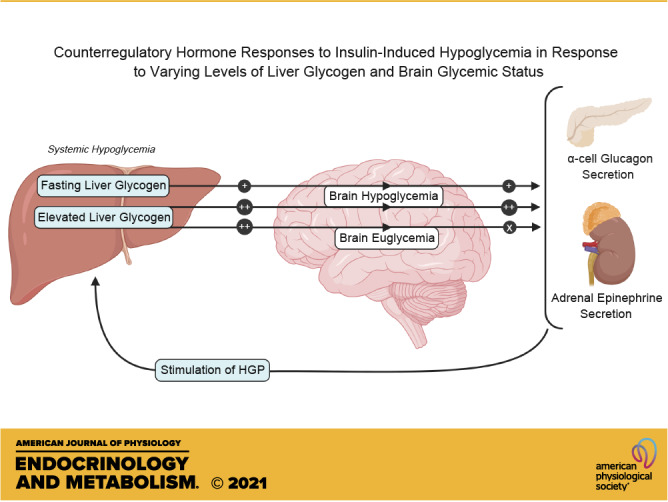
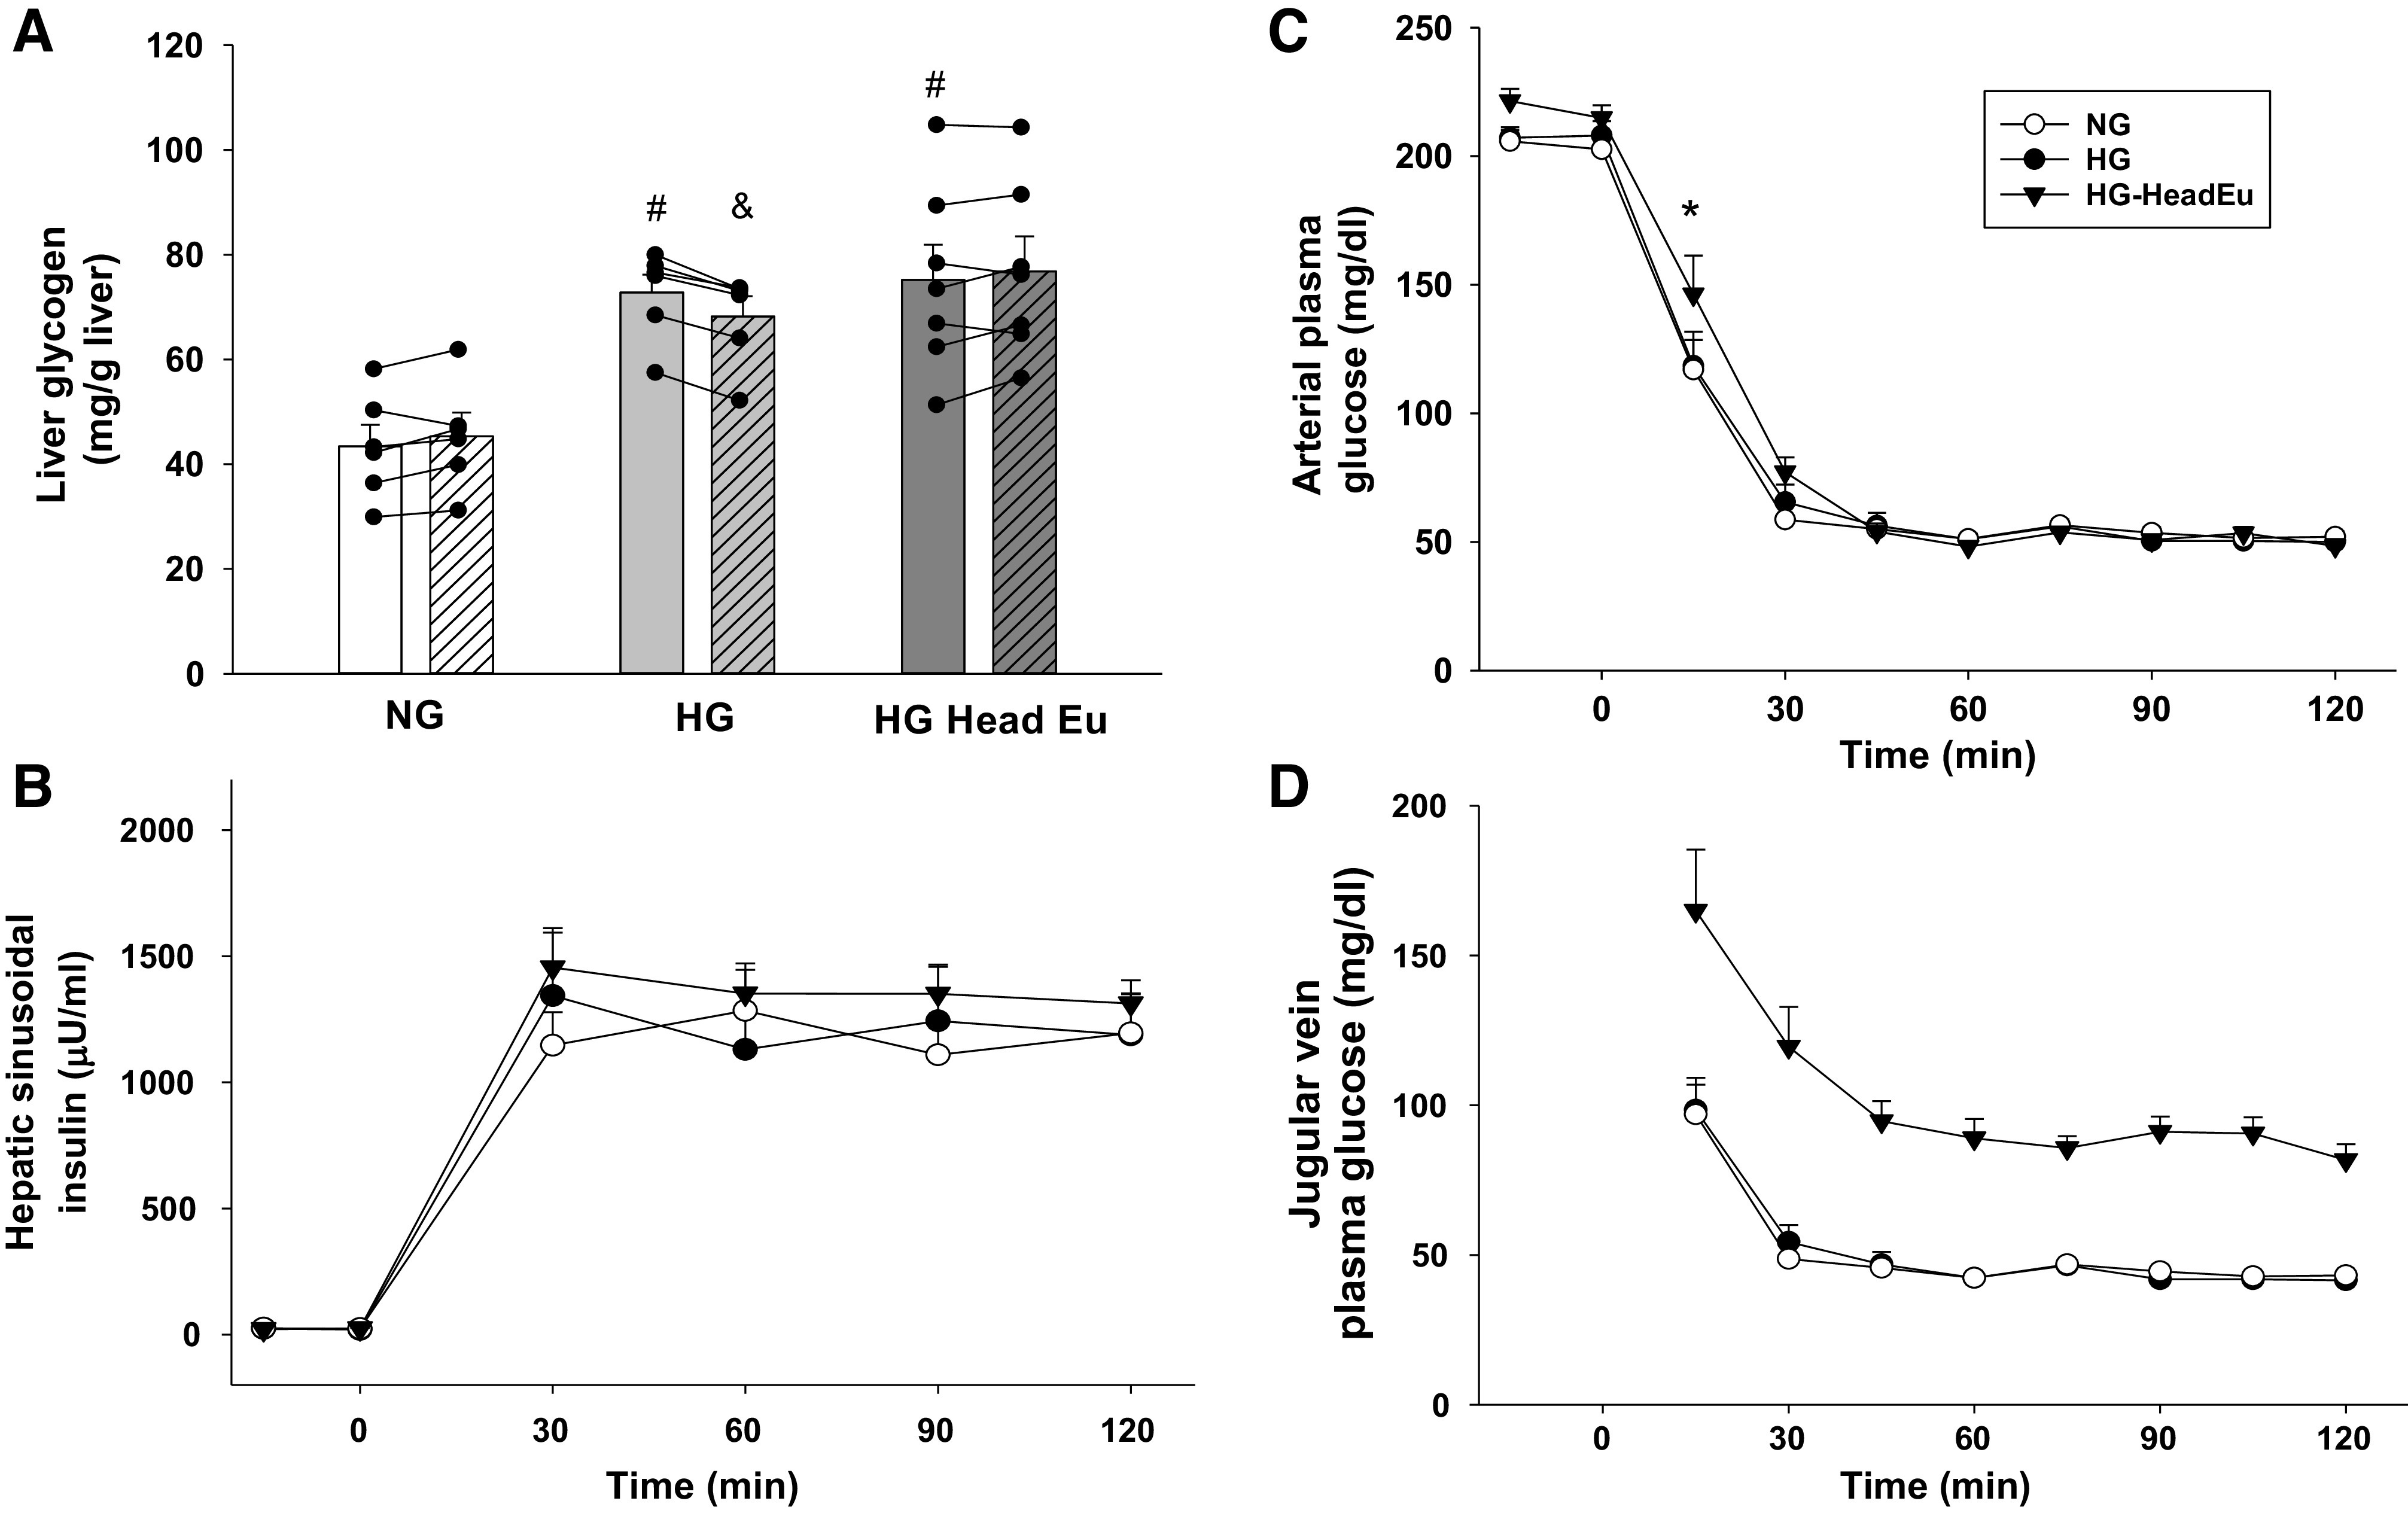
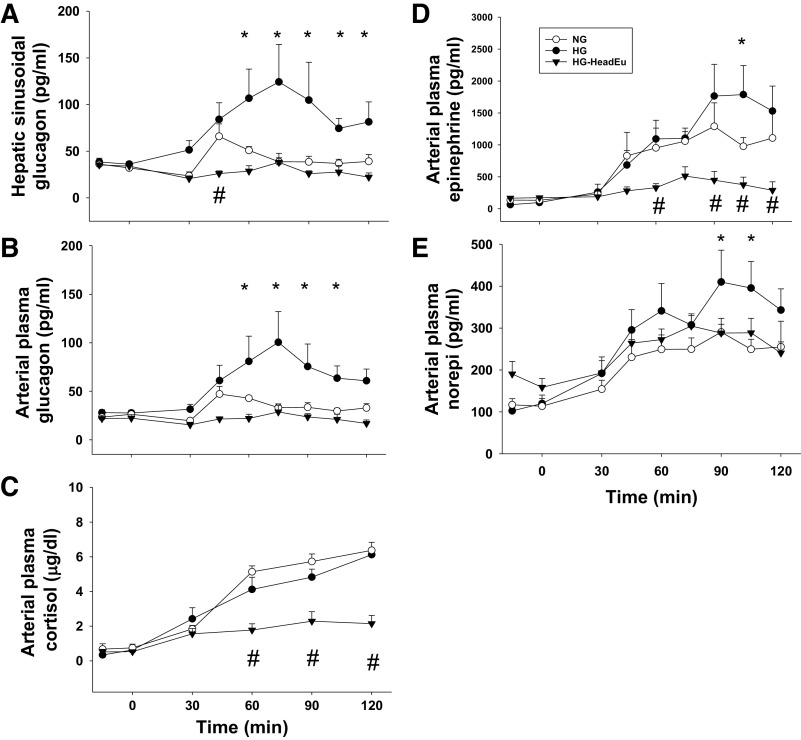
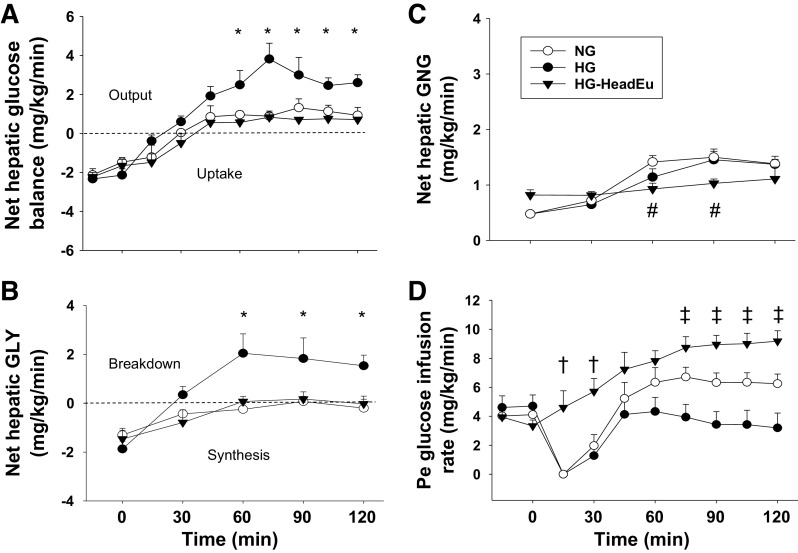
Iatrogenic hypoglycemia is a prominent barrier to achieving optimal glycemic control in patients with diabetes, in part due to dampened counterregulatory hormone responses. It has been demonstrated that elevated liver glycogen content can enhance these hormonal responses through signaling to the brain via afferent nerves, but the role that hypoglycemia in the brain plays in this liver glycogen effect remains unclear. During the first 4 h of each study, the liver glycogen content of dogs was increased by using an intraportal infusion of fructose to stimulate hepatic glucose uptake (HG; n = 13), or glycogen was maintained near fasting levels with a saline infusion (NG; n = 6). After a 2-h control period, during which the fructose/saline infusion was discontinued, insulin was infused intravenously for an additional 2 h to bring about systemic hypoglycemia in all animals, whereas brain euglycemia was maintained in a subset of the HG group by infusing glucose bilaterally into the carotid and vertebral arteries (HG-HeadEu; n = 7). Liver glycogen content was markedly elevated in the two HG groups (43 ± 4, 73 ± 3, and 75 ± 7 mg/g in NG, HG, and HG-HeadEu, respectively). During the hypoglycemic period, arterial plasma glucose levels were indistinguishable between groups (53 ± 2, 52 ± 1, and 51 ± 1 mg/dL, respectively), but jugular vein glucose levels were kept euglycemic (88 ± 5 mg/dL) only in the HG-HeadEu group. Glucagon and epinephrine responses to hypoglycemia were higher in HG compared with NG, whereas despite the increase in liver glycogen, neither increased above basal in HG-HeadEu. These data demonstrate that the enhanced counterregulatory hormone secretion that accompanies increased liver glycogen content requires hypoglycemia in the brain.NEW & NOTEWORTHY It is well known that iatrogenic hypoglycemia is a barrier to optimal glycemic regulation in patients with diabetes. Our data confirm that increasing liver glycogen content 75% above fasting levels enhances hormonal responses to insulin-induced hypoglycemia and demonstrate that this enhanced hormonal response does not occur in the absence of hypoglycemia in the brain. These data demonstrate that information from the liver regarding glycogen availability is integrated in the brain to optimize the counterregulatory response.

Keywords: glucagon; gut amino acid production; hepatic glucose metabolism; type 1 diabetes.


Figures

None
Graphical abstract
Figure 1.
Figure 1.
Research design schematic for the metabolic studies. Each animal underwent an 8-h study divided into a 4-h glycogen deposition period, a 2-h control period, and a 2-h hypoglycemic experimental period. During the glycogen deposition period, all animals underwent a pancreatic clamp [using somatostatin (SRIF)], during which hyperglycemia was brought about with a peripheral (Pe) infusion of glucose, and both insulin (INS) and glucagon (GGN) were replaced intraportally (Po) in basal amounts. One group (NG) received Po saline, while HG and HG-HeadEu received a Po infusion of fructose (1.3 mg/kg/min) to increase hepatic glucose uptake and glycogen deposition. This glycogen deposition period was followed by a 2-h control period during which the saline or fructose infusions were discontinued. Then a 2-h hypoglycemic period ensued. During this final period, a Pe infusion of insulin was started and the arterial glucose level was clamped at ∼50 mg/dL in NG and HG. The HG-HeadEu group underwent a similar hypoglycemic challenge, with the exception that glucose was infused into the carotid and vertebral arteries to maintain brain euglycemia.
Figure 2.
Figure 2.
Metabolic control during the hyperinsulinemic/hypoglycemic clamp studies. Prehypoglycemia (open bars) and posthypoglycemia (hatched bars) liver glycogen content (A), hepatic sinusoidal insulin levels (B), arterial plasma glucose levels (C), and jugular vein plasma glucose levels (D) during the experimental period. HG, intraportal (Po) infusion of fructose was used to stimulate hepatic glucose uptake; NG, saline was infused Po to maintain liver glycogen levels close to a normal, fasting level; HG-HeadEu, subset of HG group in which brain euglycemia was maintained by infusing glucose bilaterally into the carotid and vertebral arteries. *P < 0.05, HG-HeadEu compared with NG. #P < 0.05, compared with the same time point in NG. &P < 0.01, compared with the preexperimental value. Data were analyzed using two-way repeated measures ANOVA.
Figure 3.
Figure 3.
Hormonal responses during the hypoglycemic experimental period. Hepatic sinusoidal plasma glucagon (A), arterial glucagon (B), arterial cortisol (C), arterial plasma epinephrine (D), and norepinephrine (norepi; E) levels during the experimental period in NG, HG, and HG-HeadEu groups. HG, intraportal (Po) infusion of fructose was used to stimulate hepatic glucose uptake; NG, saline was infused Po to maintain liver glycogen levels close to a normal, fasting level; HG-HeadEu, subset of HG group in which brain euglycemia was maintained by infusing glucose bilaterally into the carotid and vertebral arteries. *P < 0.05, HG compared with NG. #P < 0.05, HG-HeadEu compared with NG. Data were analyzed using two-way repeated measures ANOVA.
Figure 4.
Figure 4.
Metabolic responses during the hypoglycemic experimental period. Net hepatic glucose balance (A), net hepatic glycogenolysis (GLY; B), net hepatic gluconeogenesis (GNG; C), and the peripheral (Pe) glucose infusion rate required to match the glucose levels among the groups (D). HG, intraportal (Po) infusion of fructose was used to stimulate hepatic glucose uptake; NG, saline was infused Po to maintain liver glycogen levels close to a normal, fasting level; HG-HeadEu, subset of HG group in which brain euglycemia was maintained by infusing glucose bilaterally into the carotid and vertebral arteries. *P < 0.05, HG compared with NG. #P < 0.05, HG-HeadEu compared with NG. †P < 0.05, HG-HeadEu compared with NG. ‡P < 0.05, between all 3 groups. Data were analyzed using two-way repeated measures ANOVA.

References

    1. Basu R, Chandramouli V, Dicke B, Landau B, Rizza R. Obesity and type 2 diabetes impair insulin-induced suppression of glycogenolysis as well as gluconeogenesis. Diabetes 54: 1942–1948, 2005. doi:10.2337/diabetes.54.7.1942. - DOI - PubMed
    1. Gastaldelli A, Baldi S, Pettiti M, Toschi E, Camastra S, Natali A, Landau BR, Ferrannini E. Influence of obesity and type 2 diabetes on gluconeogenesis and glucose output in humans: a quantitative study. Diabetes 49: 1367–1373, 2000. doi:10.2337/diabetes.49.8.1367. - DOI - PubMed
    1. Boyle PJ, Scott JC, Krentz AJ, Nagy RJ, Comstock E, Hoffman C. Diminished brain glucose metabolism is a significant determinant for falling rates of systemic glucose utilization during sleep in normal humans. J Clin Invest 93: 529–535, 1994. doi:10.1172/JCI117003. - DOI - PMC - PubMed
    1. Dinneen S, Gerich J, Rizza R. Carbohydrate metabolism in non-insulin-dependent diabetes mellitus. N Engl J Med 327: 707–713, 1992. doi:10.1056/NEJM199209033271007. - DOI - PubMed
    1. Reinmuth OM, Scheinberg P, Bourne B. Total cerebral blood flow and metabolism: a new method for the repeated serial measurement of total cerbral blood flow using iodoantipyrine (1131) with a report of determination in normal human beings of blood flow, oxygen consumption, glucose utilization and respiratory quotient of the whole brain. Arch Neurol 12: 49–66, 1965. doi:10.1001/archneur.1965.00460250053007. - DOI

Publication types

MeSH terms

LinkOut - more resources