. 2021 Dec;17(12):4010-4028.
doi: 10.1080/15548627.2021.1899681. Epub 2021 Mar 28.

Condition-dependent functional shift of two Drosophila Mtmr lipid phosphatases in autophagy control

Affiliations

Condition-dependent functional shift of two Drosophila Mtmr lipid phosphatases in autophagy control

Anna Manzéger et al. Autophagy. 2021 Dec.

Abstract

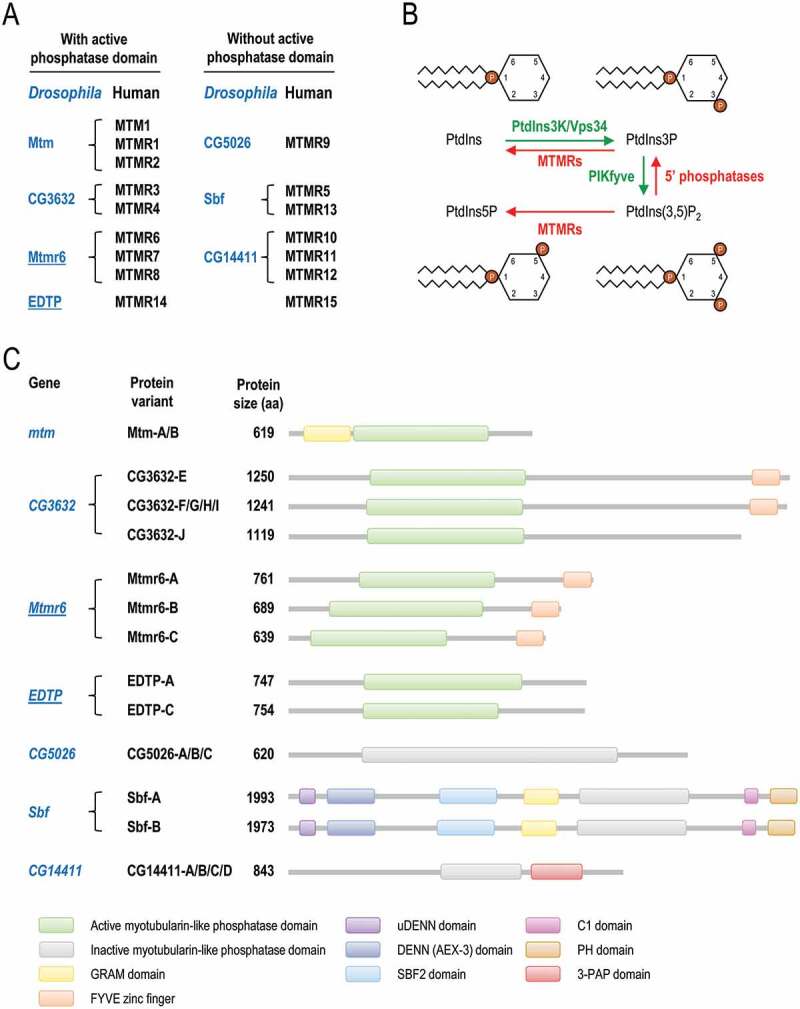
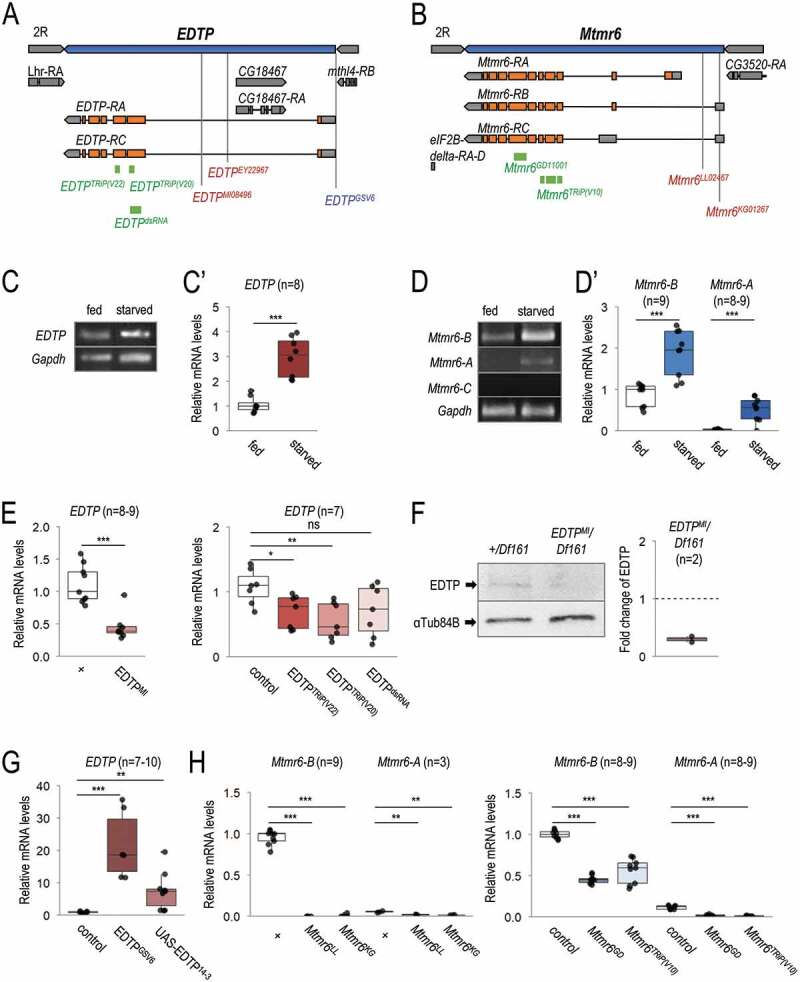
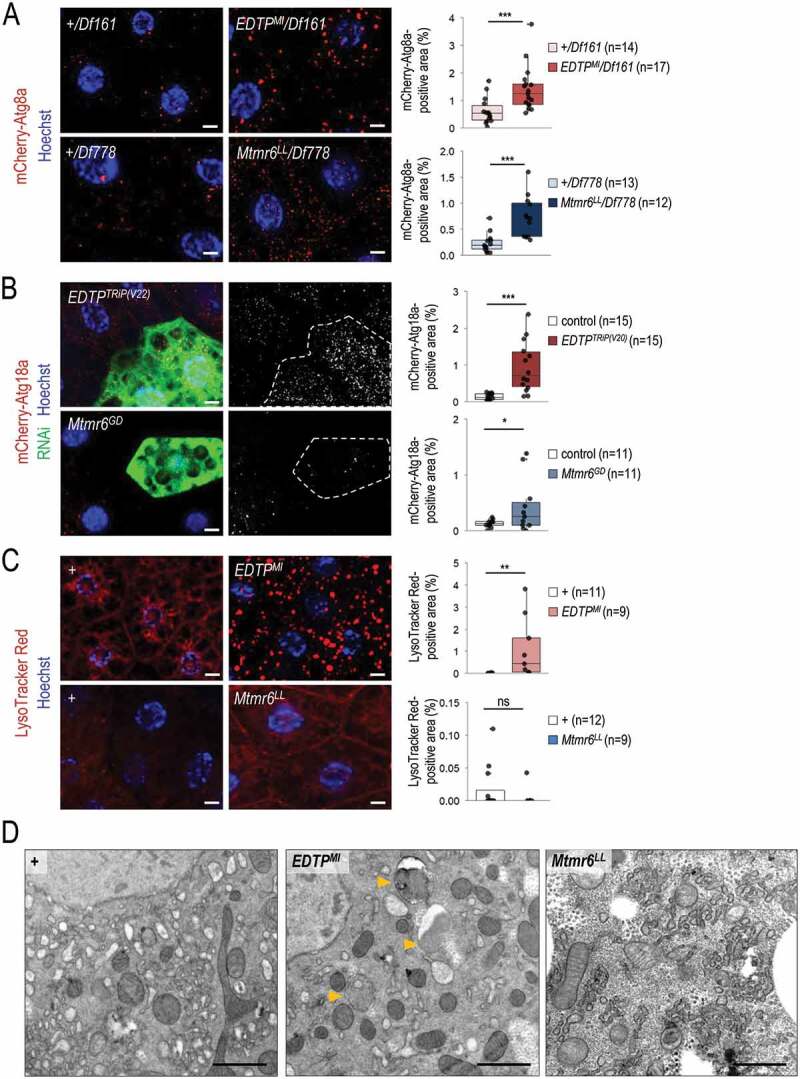
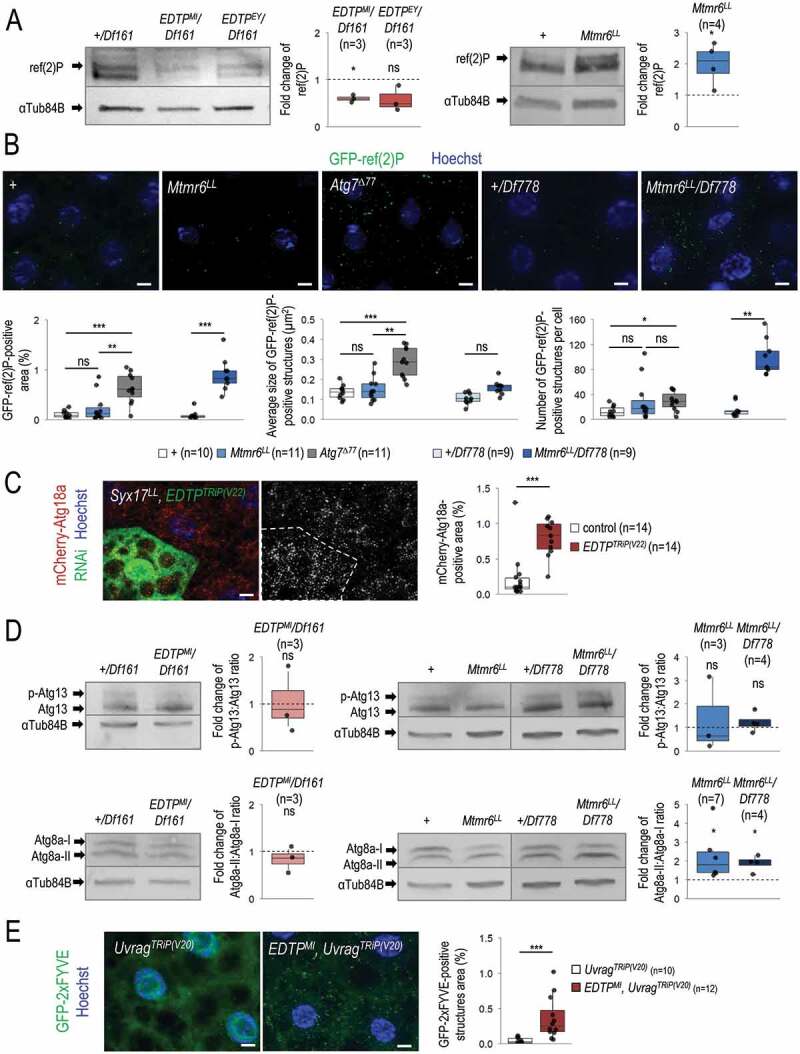
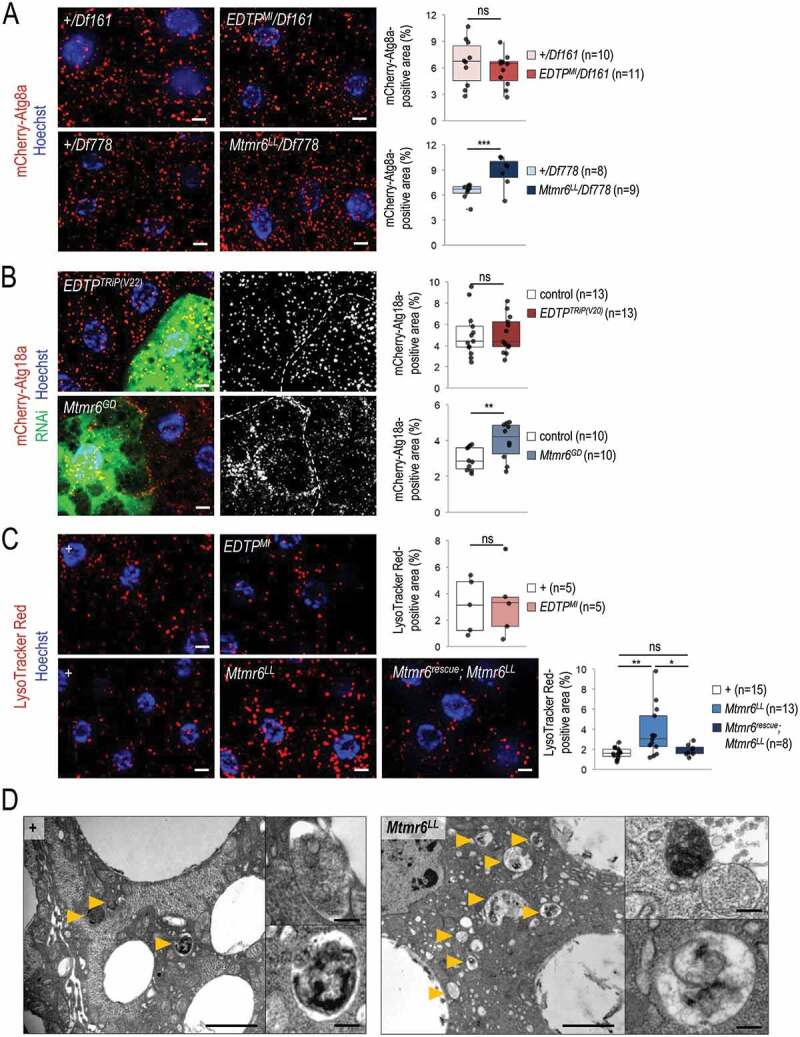
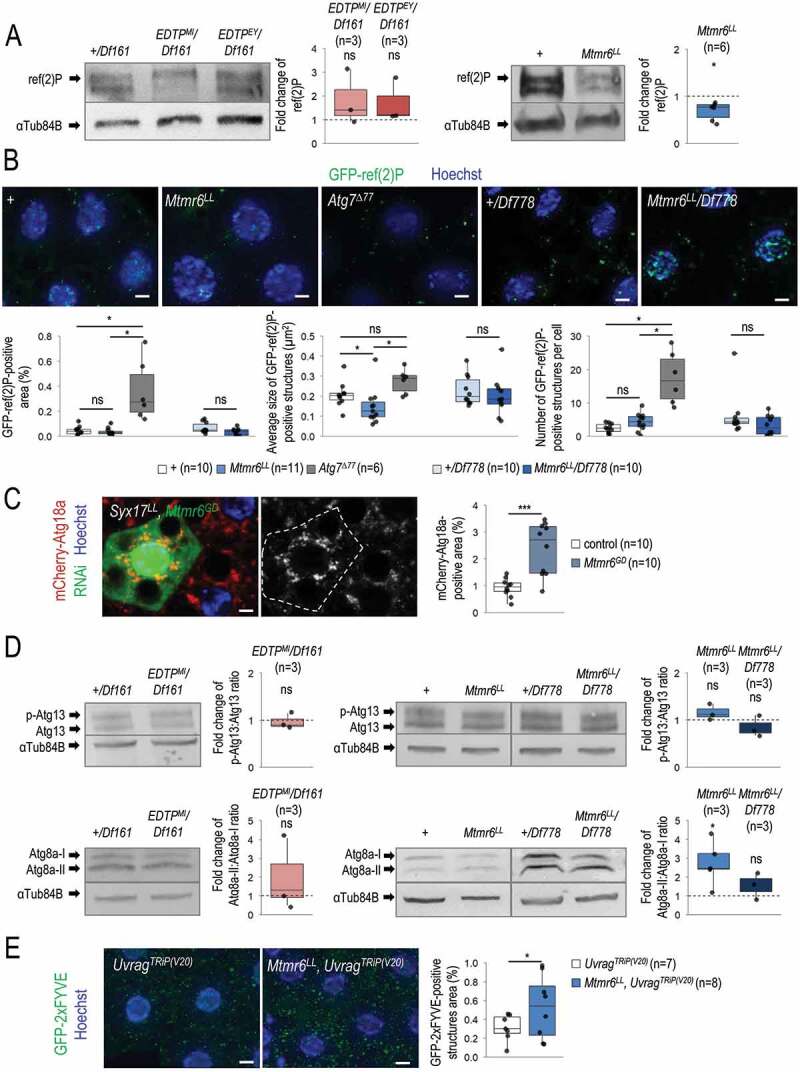
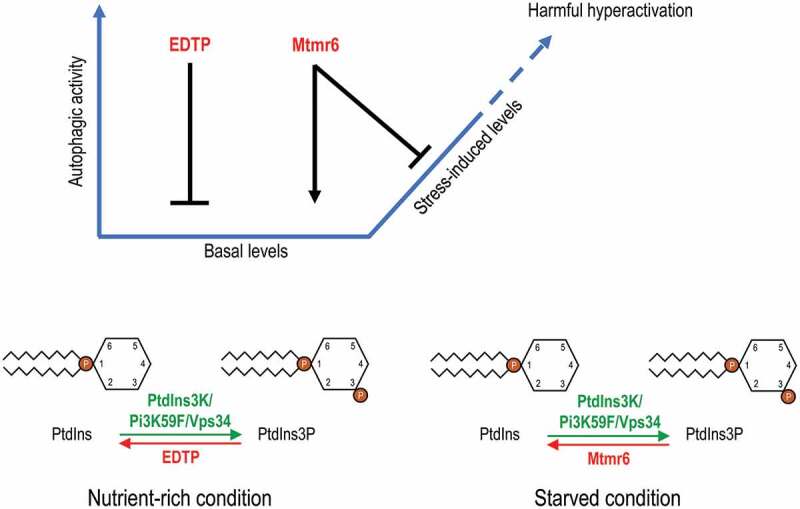
Myotubularin (MTM) and myotubularin-related (MTMR) lipid phosphatases catalyze the removal of a phosphate group from certain phosphatidylinositol derivatives. Because some of these substrates are required for macroautophagy/autophagy, during which unwanted cytoplasmic constituents are delivered into lysosomes for degradation, MTM and MTMRs function as important regulators of the autophagic process. Despite its physiological and medical significance, the specific role of individual MTMR paralogs in autophagy control remains largely unexplored. Here we examined two Drosophila MTMRs, EDTP and Mtmr6, the fly orthologs of mammalian MTMR14 and MTMR6 to MTMR8, respectively, and found that these enzymes affect the autophagic process in a complex, condition-dependent way. EDTP inhibited basal autophagy, but did not influence stress-induced autophagy. In contrast, Mtmr6 promoted the process under nutrient-rich settings, but effectively blocked its hyperactivation in response to stress. Thus, Mtmr6 is the first identified MTMR phosphatase with dual, antagonistic roles in the regulation of autophagy, and shows conditional antagonism/synergism with EDTP in modulating autophagic breakdown. These results provide a deeper insight into the adjustment of autophagy.Abbreviations: Atg, autophagy-related; BDSC, Bloomington Drosophila Stock Center; DGRC, Drosophila Genetic Resource Center; EDTP, Egg-derived tyrosine phosphatase; FYVE, zinc finger domain from Fab1 (yeast ortholog of PIKfyve), YOTB, Vac1 (vesicle transport protein) and EEA1 cysteine-rich proteins; LTR, LysoTracker Red; MTM, myotubularin; MTMR, myotubularin-related; PI, phosphatidylinositol; Pi3K59F, Phosphotidylinositol 3 kinase 59F; PtdIns3P, phosphatidylinositol-3-phosphate; PtdIns(3,5)P2, phosphatidylinositol-3,5-bisphosphate; PtdIns5P, phosphatidylinositol-5-phosphate; ref(2)P, refractory to sigma P; Syx17, Syntaxin 17; TEM, transmission electron microscopy; UAS, upstream activating sequence; Uvrag, UV-resistance associated gene; VDRC, Vienna Drosophila RNAi Center; Vps34, Vacuolar protein sorting 34.

Keywords: Autophagy; edtp; mtmr6; myotubularins; phosphoinositides.


Conflict of interest statement

No potential conflict of interest was reported by the authors.

Figures

Figure 1.
Figure 1.
Classification and molecular functions of MTMRs in flies and mammals. (A) Human myotubularin (MTM) and myotubularin-related (MTMR) phosphatases (black) and their fly orthologs (blue). Proteins were grouped according to the presence or absence of active phosphatase domain. EDTP and Mtmr6, the two Drosophila paralogs that were analyzed in this study, are underlined. (B) MTMRs dephosphorylate PtdIns3P to PtdIns, thereby antagonizing the class III PtdIns3K. MTMRs also convert PtdIns(3,5)P2 to PtdIns5P. PtdIns3P, PtdIns5P and PtdIns(3,5)P2 are each involved in autophagy. (C) Scaled representation of the protein domains of Drosophila myotubularins based on Pfam predictions. Abbreviations: 3-PAP: 3-phosphatase adapter protein; C1: phorbol esters/diacylglycerol binding; DENN: differentially expressed in neoplastic versus normal cells; FYVE: Fab1 (yeast ortholog of PIKfyve), YOTB, Vac1 (vesicle transport protein) and EEA1; GRAM: glucosyltransferases, Rab-like GTPase activators and myotubularins; PH: pleckstrin homology; Sbf: SET domain binding factor
Figure 2.
Figure 2.
Mutant alleles, RNAi and overexpression constructs of EDTP and Mtmr6. (A) Exon/intron structure of EDTP. Specific positions of on-target sequences of RNAi constructs (green), inactivating mutations (red) and overexpressing insertion (blue) are shown. (B) Genomic structure of Mtmr6/CG3530. RNAi constructs (green) and mutant alleles (red) are indicated. (C-C’) EDTP is expressed in larval fat body cells of well-fed larvae, and its expression becomes elevated upon amino acid starvation, based on semi-quantitative RT-PCR (C) and quantitative real-time (qRT-) PCR (C’) analyses. (D) Splice-variants of Mtmr6 are expressed at different levels in the larval fat body. Under nutrient-rich condition, only Mtmr6-B is detectable by semi-qRT-PCR, the level of which becomes elevated in response to amino acid starvation. The expression of Mtmr6-A can be observed only under the latter condition. Mtmr6-C expression is not detectable under either circumstance. (D’) Based on qRT-PCR results, Mtmr6-B is markedly expressed, while Mtmr6-A shows a very weak expression in well-fed larvae. Expression of both splice variants is elevated upon starvation. (E) Relative transcript levels of the EDTPMI gene trap mutant allele and EDTP RNAi constructs, determined by qRT-PCR. (F) EDTPMI gene trap mutant allele also effectively lowers EDTP protein level. (G) Relative EDTP mRNA level is increased upon applying overexpression constructs. (H) Expression levels of active Mtmr6 splice variants (A and B) in control, mutant and RNAi-treated samples. qRT-PCR and semi-qRT-PCR were used on total RNA samples isolated from larval fat bodies of well-fed (C-D’) or 3 h-starved (C-H) animals at the third instar feeding larval (L3F) stage. Protein samples also stem from larval fat bodies of 3 h-starved animals at the third instar feeding larval (L3F) stage. Gapdh and αTub84B were used as internal controls for PCR experiments and in western blot analysis, respectively. Expression of UAS constructs was driven by Act5C-Gal4. In the case of long hairpin RNAi constructs, UAS-Dcr-2 was also coexpressed. w1118 animals (indicated by “+”) served as control for mutant strains, Act5C-Gal4/+ animals did for short hairpin RNAi and overexpression constructs, and UAS-Dcr-2/+; Act5C-Gal4/+ animals did for long hairpin RNAi constructs. Quantifications of normalized mRNA and protein levels are shown in box plots. *: p < 0.05, **: p < 0.01 ***: p < 0.001, ns: not significant. For statistics, see the Materials and Methods section
Figure 3.
Figure 3.
Under nutrient-rich conditions, EDTP suppression leads to increased amounts of early and late autophagic structures whereas Mtmr6 inactivation causes the accumulation of early autophagic structures only. (A) Deficiencies that overlap the genomic region of EDTP or Mtmr6 were used to generate transheterozygous (or hemizygous) animals. Mutational inactivation of EDTP (EDTPMI/Df161) and Mtmr6 (Mtmr6LL/Df778) in hemizygous backgrounds increases the amounts of mCherry-Atg8a-positive structures (red foci; forming phagophores, autophagosomes, and autolysosomes). (B) Clonal silencing of EDTP and Mtmr6 elevates the quantity of mCherry-Atg18a-positive early autophagic structures. Clonal cells (green) treated with RNAi are outlined by a white dotted line. Analysis was performed by using hsFLP; UAS-Dcr-2; r4-mCherry-Atg18a, Act<CD2< Gal4, UAS-nlsGFP animals. (C) EDTP deficiency enhances the amount of acidic compartments, primarily autolysosomes, labeled by LysoTracker Red (LTR, red dots), as compared to control. Inhibiting Mtmr6 does not elevate the amount of LTR-positive structures. (D) Ultrastructural analysis of autophagy in fat body cells under well-fed conditions. In control (w1118) larvae maintained under nutrient-rich condition, autophagic structures cannot essentially be observed by transmission electron microscopy (TEM). In well-fed EDTPMI mutant larvae elevated numbers of autophagic structures are observed by TEM. In the homozygous Mtmr6LL mutant genetic background more extensive internal membrane formation can be detected. Arrowheads indicate autophagic structures. Scale bars: 1 µm. In panels A-C, Hoechst staining (blue) indicates nuclei, scale bars: 10 μm. Fluorescence microscopy images were composed of multiple optical sections. Quantifications are shown in box plots, *: p < 0.05, **: p < 0.01 ***: p < 0.001, ns: not significant. For statistics, see the Materials and Methods section. In panel A, +/Df161 and +/Df778 were used as controls. In panel C and D, w1118 was used as a control (indicated as “+”). Fat bodies were prepared from well-fed animals at the third instar feeding larval (L3F) stage
Figure 4.
Figure 4.
EDTP inhibits whereas Mtmr6 moderately promotes basal autophagy under nutrient-rich conditions. (A) Western blot analysis showing that soluble ref(2)P levels become lowered in fat body cells deficient in EDTP, but become highly elevated in cells defective for Mtmr6, as compared with control. ref(2)P serves as an autophagic substrate, thereby is widely used to monitor the autophagic degradation. (B) In Mtmr6 mutant genetic backgrounds, the amount of insoluble GFP-ref(2)P-containing protein aggregates becomes elevated. This change stems from the difference in the number of GFP-ref(2)P-positive structures and not from the alteration in the size of structures. Atg7Δ77 mutant animals defective for autophagosome formation were also involved. (C) Clonal silencing of EDTP highly elevates the quantity of mCherry-Atg18a-positive early autophagic structures in Syx17LL mutant fat body cells, which are deficient in autophagosome-lysosome fusion. Clonal green cells treated with RNAi are outlined by a white dotted line. Analysis was performed by using hsFLP; Syx17LL, r4-mCherry-Atg18a, Act<CD2< Gal4, UAS-nlsGFP animals. (D) The ratio of hyperphosphorylated and non-hyperphosphorylated Atg13 levels is slightly decreased in EDTP mutant, but not altered in Mtmr6 mutant samples compared to the corresponding control, indicating that the activity of the induction complex is not enhanced by these genes. Atg8a-II/Atg8a-I ratio is not altered in fat body cells deficient in EDTP, but increased in Mtmr6 mutant samples. Atg8a-I is a cytosolic, Atg8a-II is a membrane-conjugated protein form. (E) Mutation of EDTP significantly elevates the quantity of GFP-2xFYVE-positive structures in Uvrag-RNAi cells, in which only the autophagy-specific PtdIns3K complex is active. GFP-2xFYVE bounds PtdIns3P and labels only early autophagic structures in Uvrag-downregulated cells. UAS-GFP-2xFYVE transgene is expressed by Cg-Gal4 driver. In panels A and D, αTub84B was used as an internal control. In panels A, B and D, “+” indicates w1118 mutant control larvae. In panels B, C and E, Hoechst staining (blue) indicates nuclei, scale bar: 10 μm. Fluorescence microscopy images were composed of multiple optical sections. Quantifications are shown in box plots, *: p < 0.05, **: p < 0.01, ***: p < 0.001, ns: not significant. For statistics, see the Materials and Methods section. Fat body samples were prepared from well-fed animals at the third instar feeding larval (L3F) stage
Figure 5.
Figure 5.
In starved animals, the amount of autophagic structures is not influenced by EDTP deficiency, but becomes elevated in response to Mtmr6 inactivation. (A) Mutational inactivation of EDTP in a hemizygous background (EDTPMI/Df161) does not influence the amount of mCherry-Atg8a-positive structures. In contrast, mutation in mtmr6 in a hemizygous background (Mtmr6LL/Df778) increases the number of autophagic structures relative to control. mCherry-Atg8a (red) labels forming phagophores, autophagosomes and autolysosomes. (B) Clonal silencing of EDTP in fat body cells does not influence the quantity of mCherry-Atg18a-positive early autophagic structures. Downregulation of Mtmr6 significantly enhances the number of these structures. Clonal cells (green) treated with RNAi are outlined by white dotted lines. Analysis was performed by using hsFLP; UAS-Dcr-2; r4-mCherry-Atg18a, Act<CD2< Gal4, UAS-nlsGFP animals. (C) Defects in EDTP function do not alter the number and size of acidic compartments labeled by LysoTracker Red (LTR), as compared to control. An inactivating mutation in Mtmr6 enhances the amount of LTR-positive structures, which are effectively rescued by an Mtmr6rescue clone to nearly normal levels. LTR (red) stains acidic structures including autolysosomes. (D) Ultrastructural analysis of autophagy in fat body cells under starved condition. Starvation triggers the formation of autophagic structures including autophagosomes and autolysosomes in control animals. In Mtmr6LL mutant samples, fusing autophagic structures (right up) and digesting autolysosomes with degrading materials become abundantly apparent in response to nutritional stress (right down). Arrowheads indicate autophagic structures. Scale bar: 1 µm in large images and 125 nm in small ones. In panels A-C, Hoechst staining (blue) indicates nuclei, and scale bar: 10 μm. Fluorescence microscopy images were composed of multiple optical sections. Quantifications are shown in boxplots, *: p < 0.05, **: p < 0.01, ***: p < 0.001, ns: not significant (for statistics, see the Materials and Methods section). In panels C and D, w1118 was used as a control, indicated by “+”. Fat bodies were prepared from starved animals at the third instar feeding larval (L3F) stage
Figure 6.
Figure 6.
Under starvation, EDTP does not affect, while Mtmr6 inhibits autophagy. (A) In nutrient-deprived animals, the level of soluble ref(2)P is not modulated significantly by EDTP deficiency, but becomes decreased in samples defective for Mtmr6 (western blot analysis). (B) In Mtmr6 mutant genetic backgrounds, the area ratio of insoluble GFP-ref(2)P-containing protein aggregates is not altered significantly but the size of structures is lowered. Atg7Δ77, as a mutant background deficient in autophagosome formation, was also involved in comparison. (C) Clonal silencing of Mtmr6 markedly elevates the quantity of mCherry-Atg18a-positive early autophagic structures in Syx17LL mutant fat bodies, which are defective for autophagosome-lysosome fusion. Clonal cells (green) treated with RNAi are outlined by a white dotted line and also expressed Dcr-2. Analysis was performed by using hsFLP; Syx17LL, r4-mCherry-Atg18a, Act<CD2< Gal4, UAS-nlsGFP animals. (D) The ratio of hyperphosphorylated and non-hyperphosphorylated Atg13 levels is not altered in either EDTP or Mtmr6 mutant samples as compared to controls, indicating that the activity of the induction complex is not influenced. In fat body cells, Atg8a-II:Atg8a-I ratio is not changed in EDTP mutants but becomes increased in Mtmr6 mutant animals as compared to control. Atg8a-I is a cytosolic, Atg8a-II is a membrane-bound form. (E) Mutation of Mtmr6 elevates the quantity of GFP-2xFYVE-positive structures in Uvrag-silenced cells, in which only the autophagy-specific PtdIns3K complex is active. GFP-2xFYVE bounds PtdIns3P and labels only early autophagic structures in Uvrag-silenced cells. UAS-GFP-2xFYVE transgene is expressed by Cg-Gal4 driver. In panels A, B and D, “+” indicates w1118 mutant larvae. In panels A and D, αTub84B was used as an internal control. In panels B, C and E, Hoechst staining (blue) indicates nuclei, and scale bar: 10 μm. Fluorescence microscopy images were composed of multiple optical sections. Quantifications are shown in boxplots, *: p < 0.05, ***: p < 0.001, ns: not significant (for statistics, see the Materials and Methods section). Fat bodies were prepared from starved animals at the third instar feeding larval (L3F) stage
Figure 7.
Figure 7.
Model for the distinct regulation of autophagy by EDTP and Mtmr6. Under nutrient-rich condition, EDTP inhibits basal autophagy by antagonizing PtdIns3P production and suppressing autophagosome maturation. In contrast, Mtmr6 promotes autophagy in well-fed animals, affecting the process at a later stage. Under conditions of cellular stress, the autophagy flux is not altered by EDTP, but is markedly lowered by Mtmr6. Mtmr6 prevents the harmful hyperactivation of autophagy during stress by antagonizing PtdIns3K

References

    1. Robinson FL, Dixon JE.. Myotubularin phosphatases: policing 3-phosphoinositides. Trends Cell Biol. 2006 Aug;16(8):403–412. - PubMed
    1. Alonso A, Sasin J, Bottini N, et al. Protein tyrosine phosphatases in the human genome. Cell. 2004 Jun 11 117;(6):699–711. - PubMed
    1. Raess MA, Friant S, Cowling BS, et al. WANTED - Dead or alive: myotubularins, a large disease-associated protein family. Adv Biol Regul. 2017 Jan;63:49–58. - PubMed
    1. Laporte J, Hu LJ, Kretz C, et al. A gene mutated in X-linked myotubular myopathy defines a new putative tyrosine phosphatase family conserved in yeast. Nature Genet. 1996 Jun 13;(2):175–182. - PubMed
    1. Laporte J, Bedez F, Bolino A, et al. Myotubularins, a large disease-associated family of cooperating catalytically active and inactive phosphoinositides phosphatases. Hum Mol Genet. 12(2): Spec No. R285–92. 2003 Oct 15. - PubMed

Publication types

MeSH terms

LinkOut - more resources