. 2021 Mar 29:10:e61885.
doi: 10.7554/eLife.61885.

An atlas of the binding specificities of transcription factors in Pseudomonas aeruginosa directs prediction of novel regulators in virulence

Affiliations

An atlas of the binding specificities of transcription factors in Pseudomonas aeruginosa directs prediction of novel regulators in virulence

Tingting Wang et al. Elife. .

Abstract

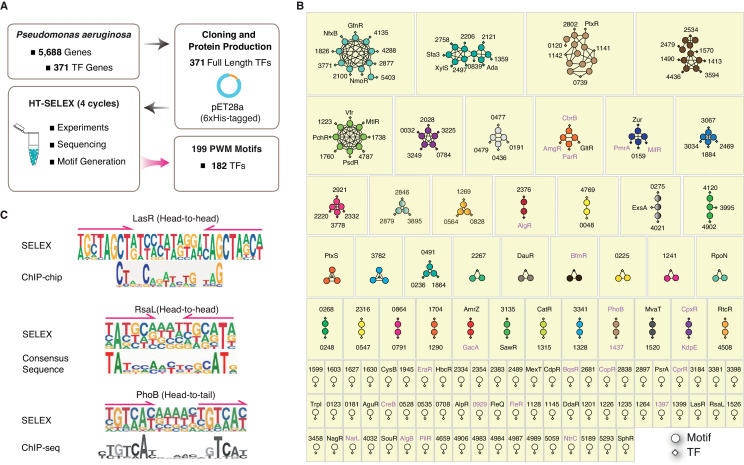
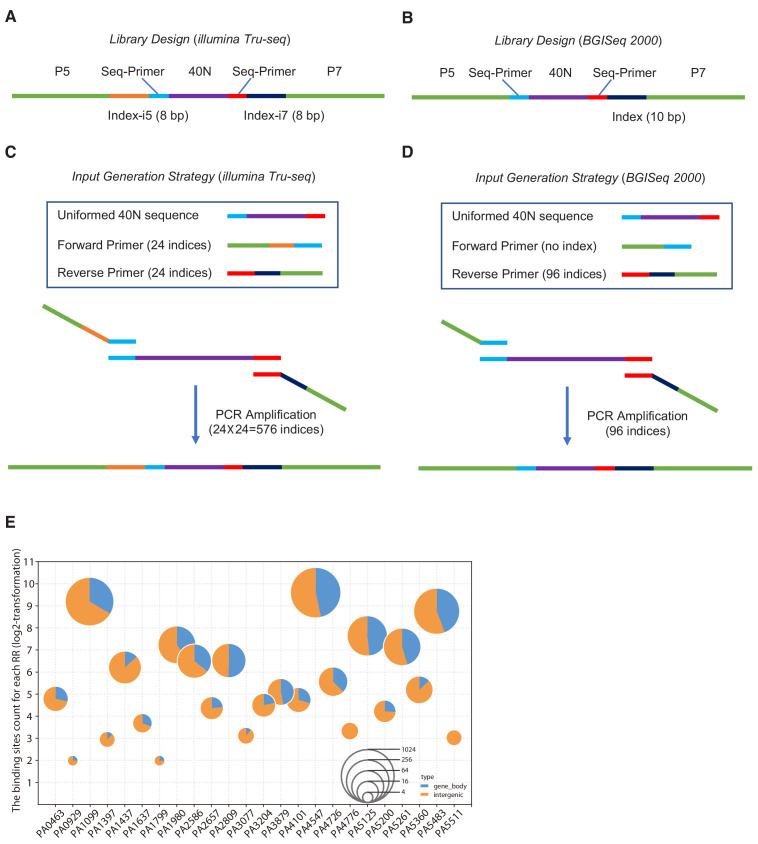
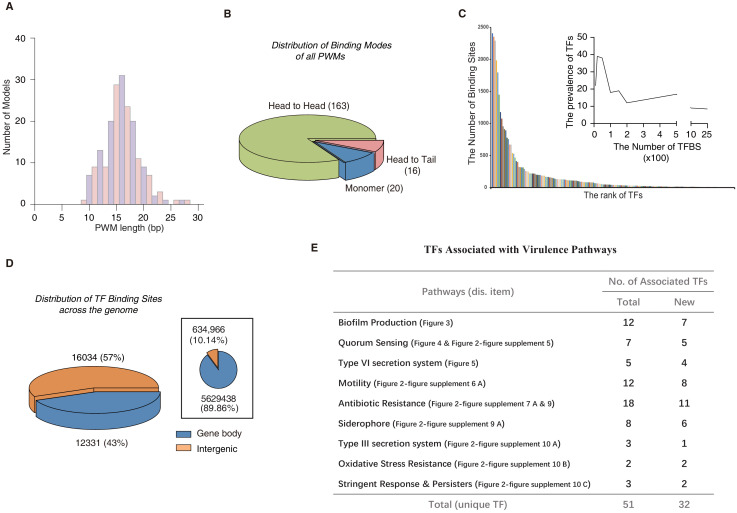
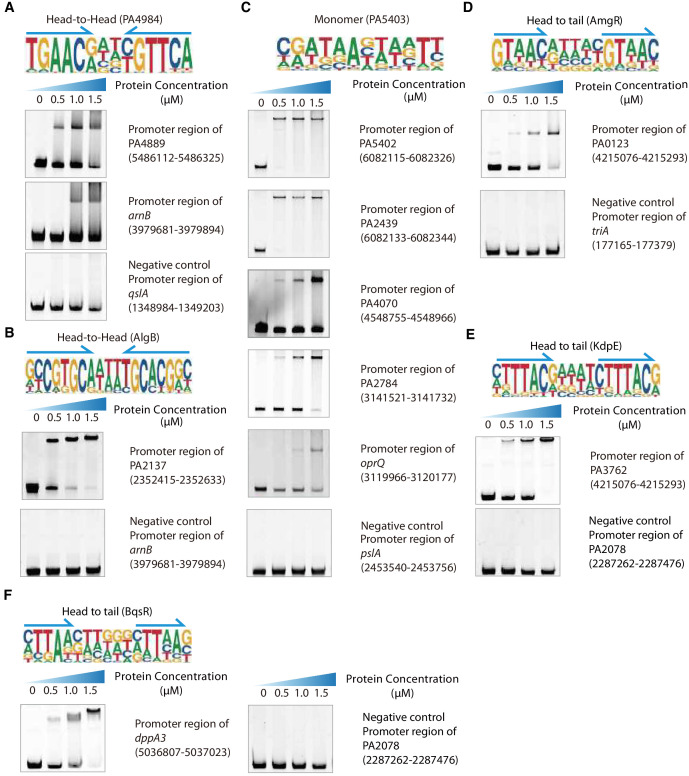
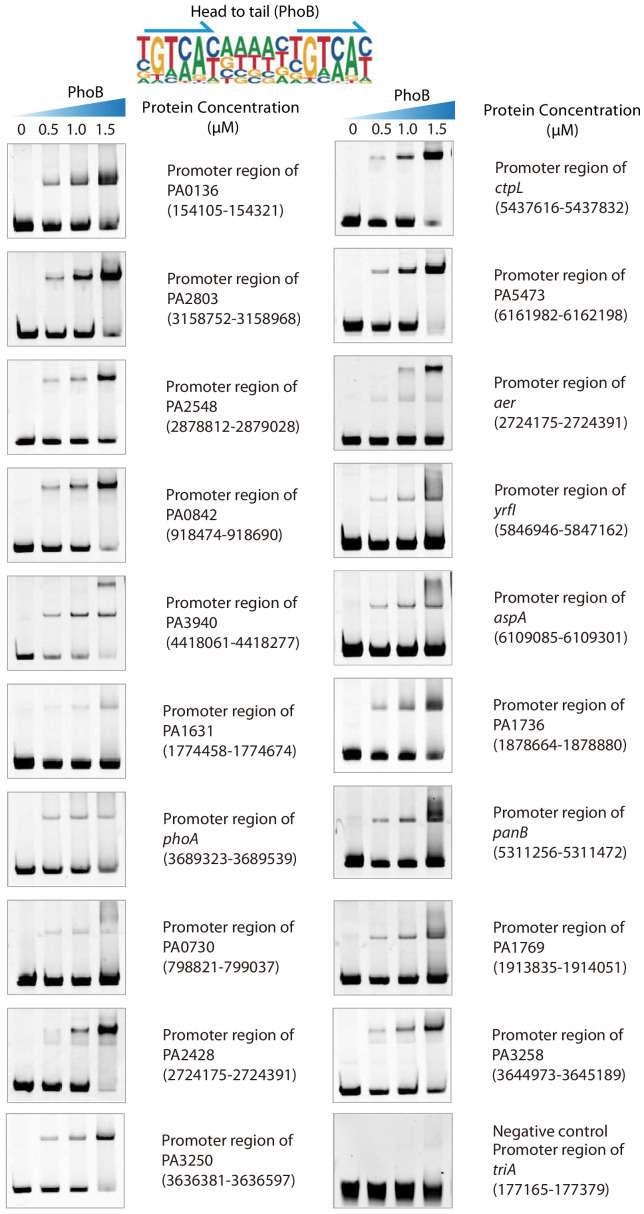
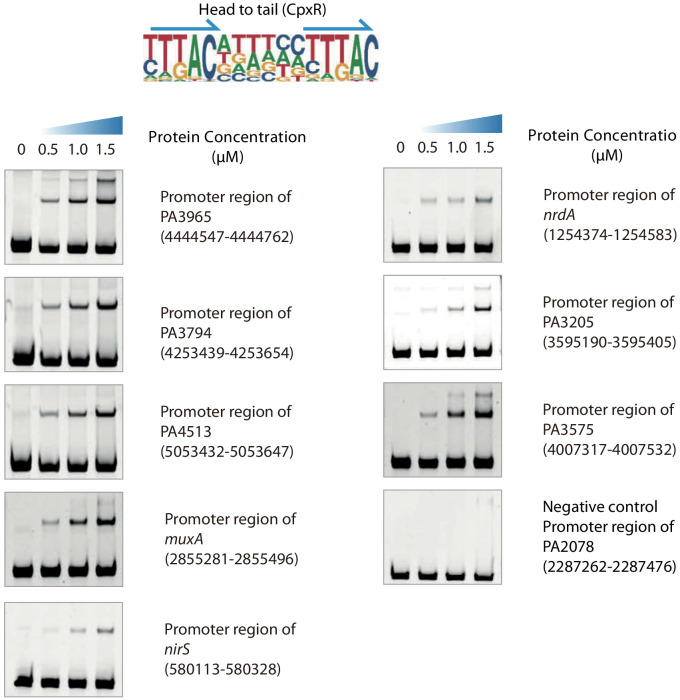
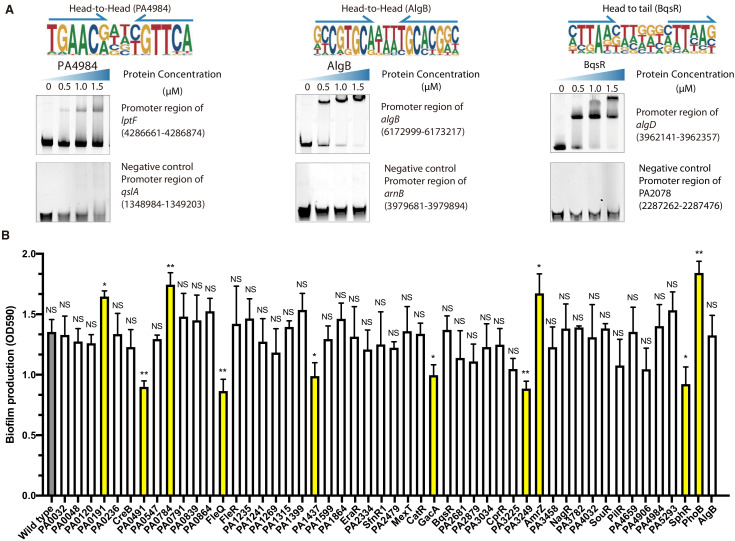
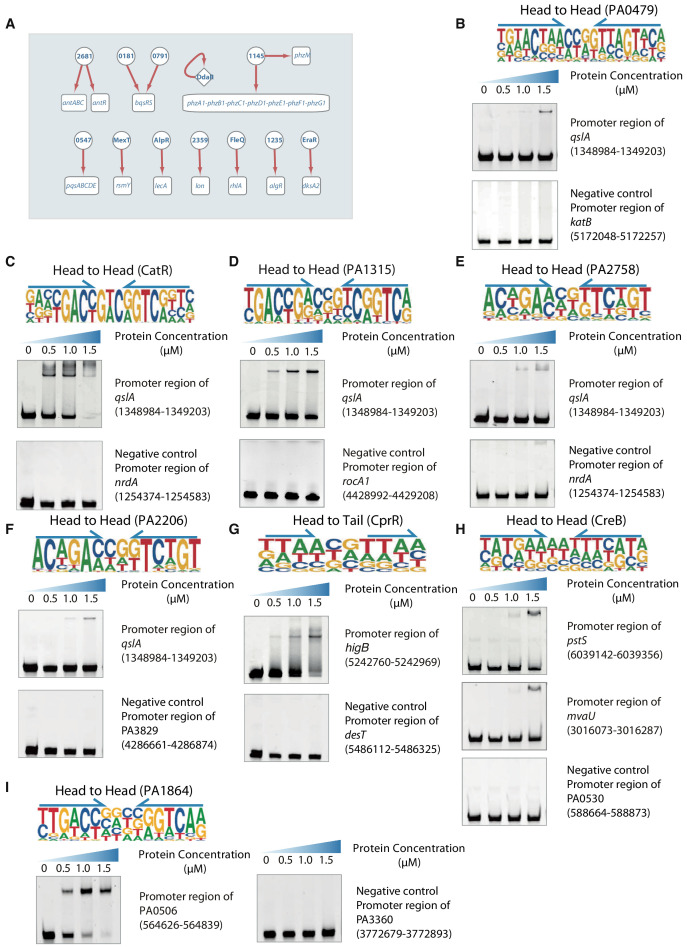
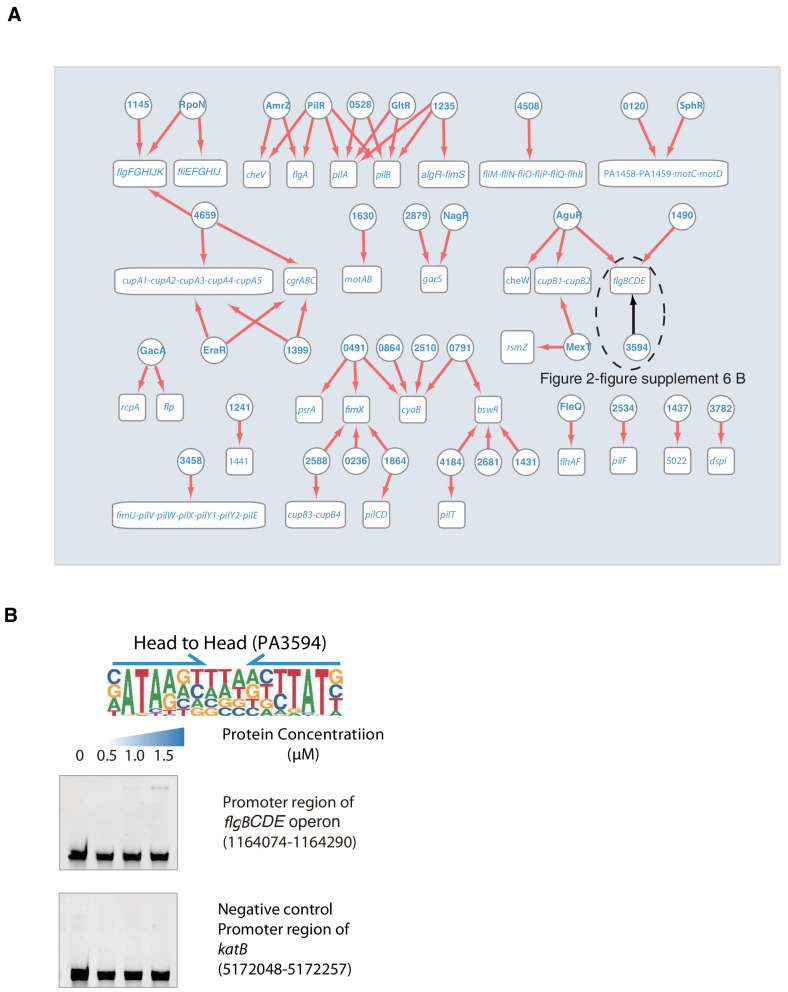
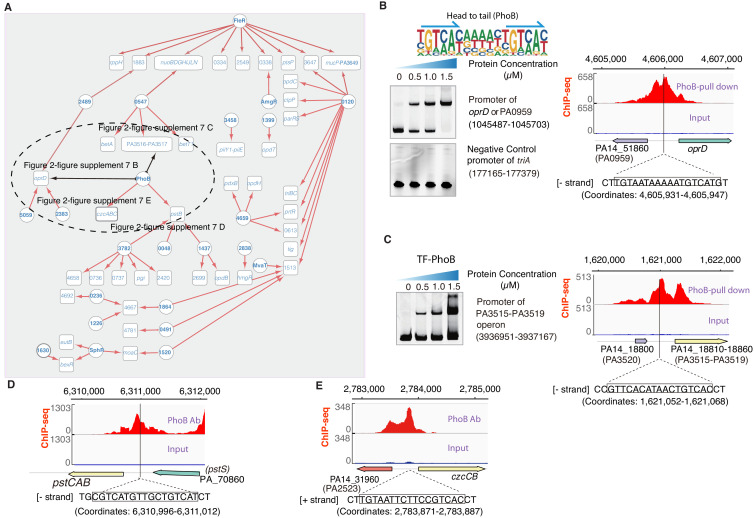
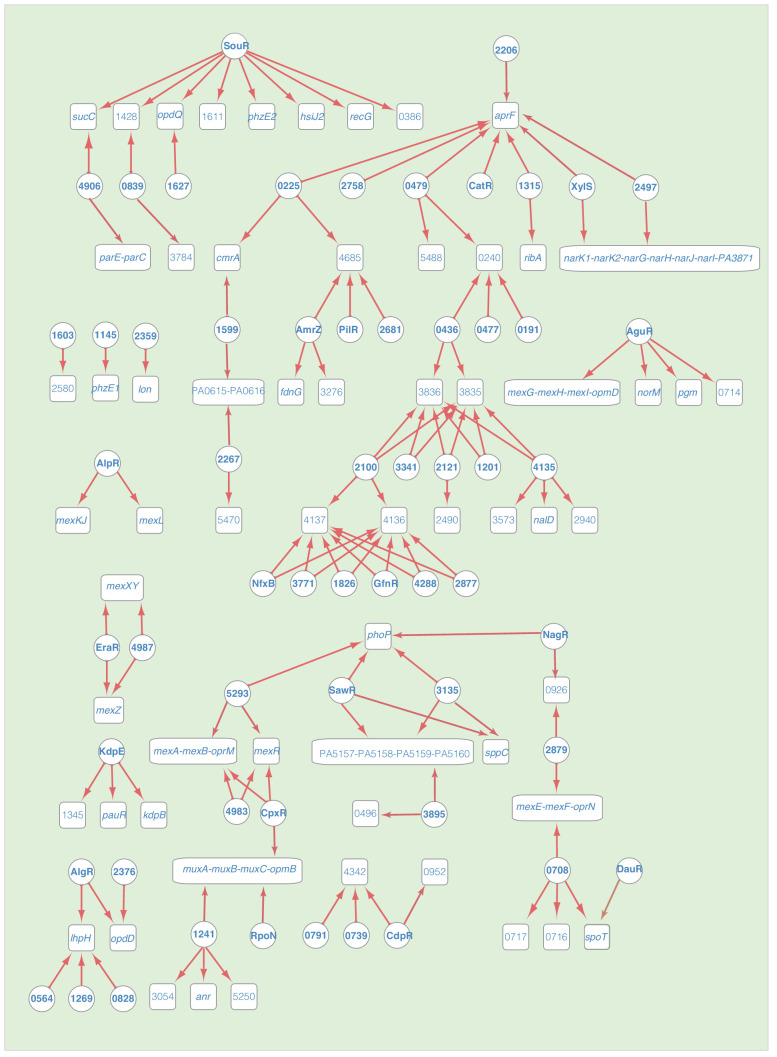
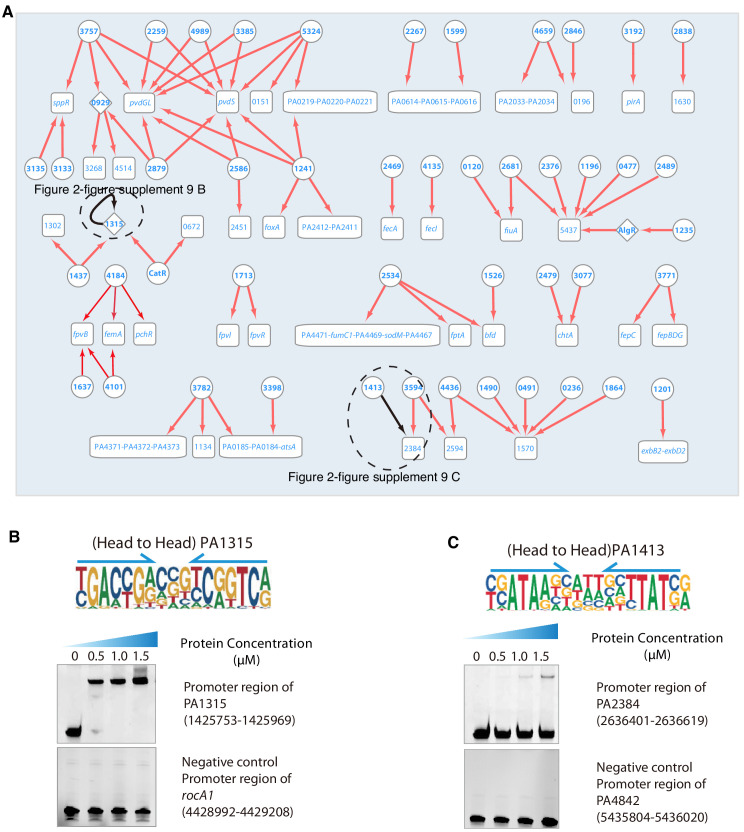
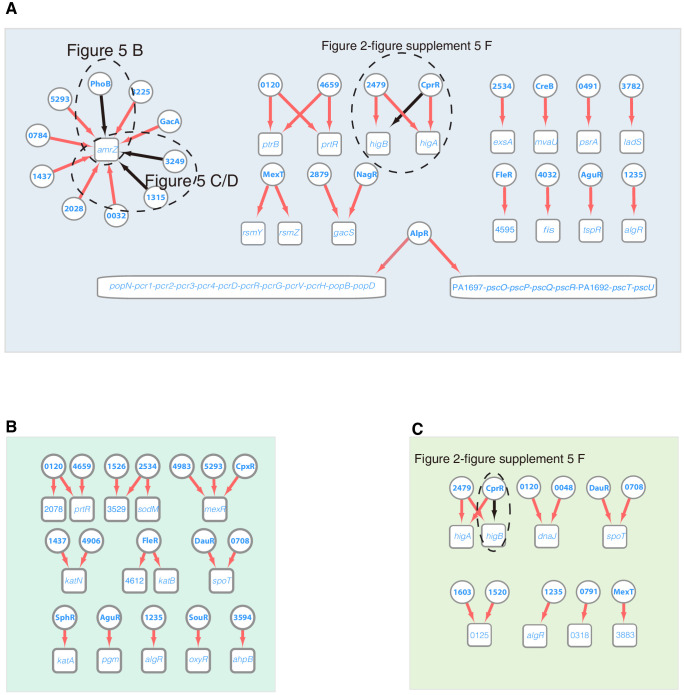
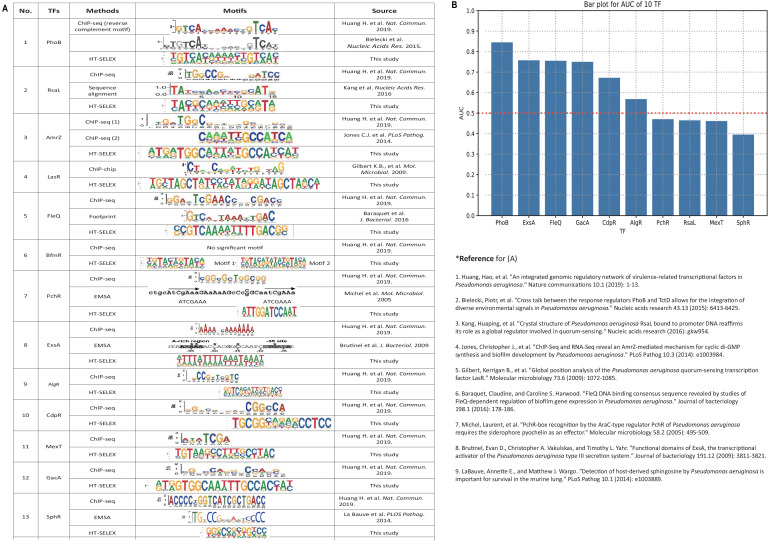
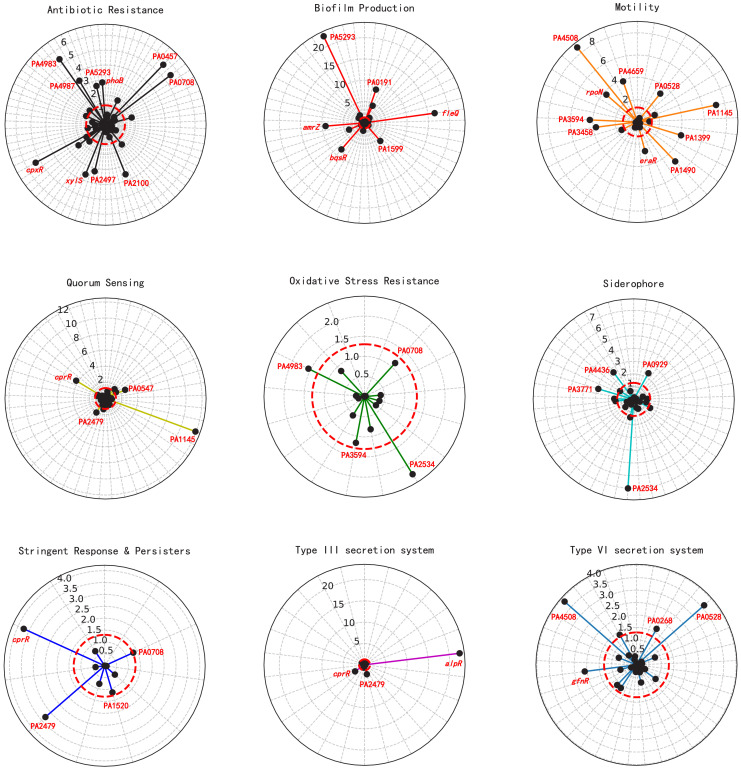
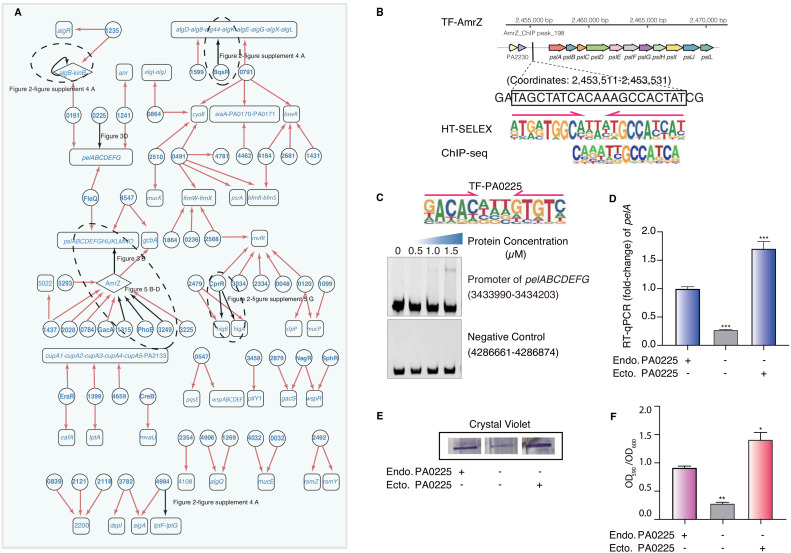
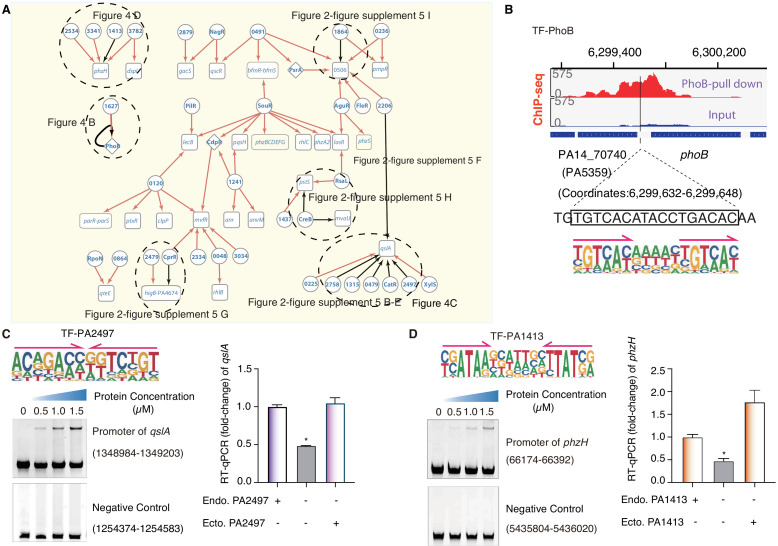
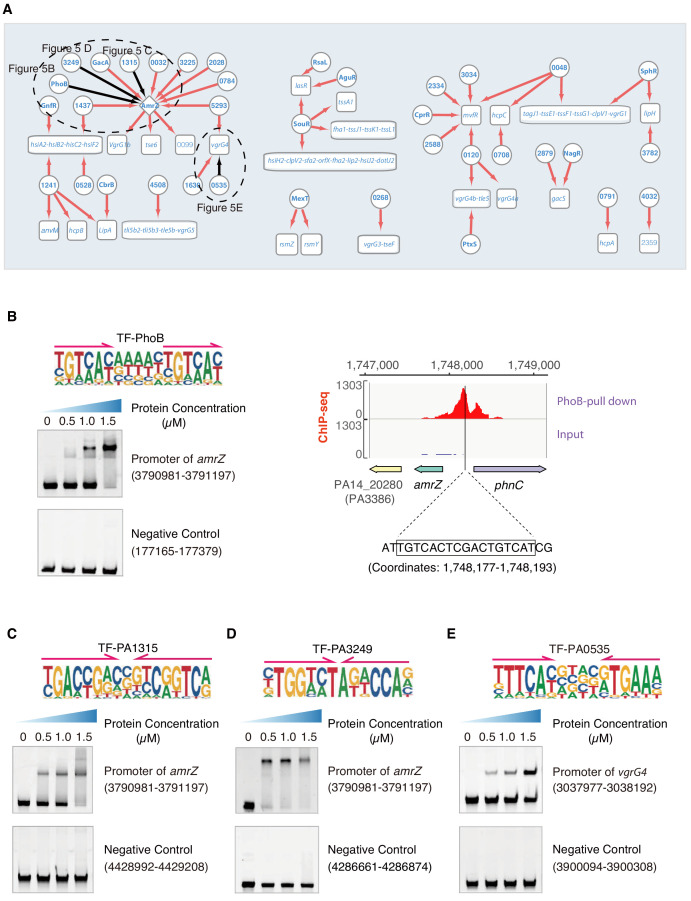
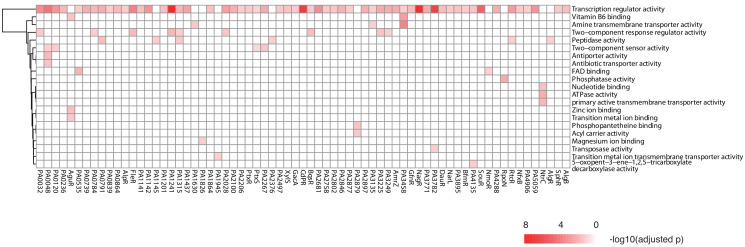
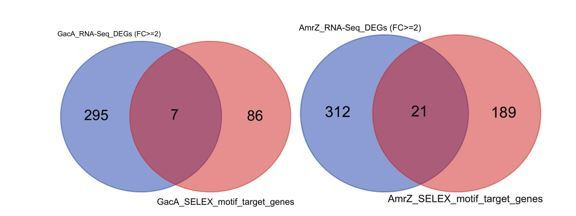
A high-throughput systematic evolution of ligands by exponential enrichment assay was applied to 371 putative TFs in Pseudomonas aeruginosa, which resulted in the robust enrichment of 199 unique sequence motifs describing the binding specificities of 182 TFs. By scanning the genome, we predicted in total 33,709 significant interactions between TFs and their target loci, which were more than 11-fold enriched in the intergenic regions but depleted in the gene body regions. To further explore and delineate the physiological and pathogenic roles of TFs in P. aeruginosa, we constructed regulatory networks for nine major virulence-associated pathways and found that 51 TFs were potentially significantly associated with these virulence pathways, 32 of which had not been characterized before, and some were even involved in multiple pathways. These results will significantly facilitate future studies on transcriptional regulation in P. aeruginosa and other relevant pathogens, and accelerate to discover effective treatment and prevention strategies for the associated infectious diseases.

Keywords: Pseudomonas aeruginosa; dna binding specificity; gene expression; genetics; genomics; infectious disease; microbiology; transcription factors; transcriptional regulation network; virulence.


Conflict of interest statement

TW, WS, LF, CH, NW, SF, JZ, XD, JY No competing interests declared

Figures

Figure 1.
Figure 1.. Summary of the HT-SELEX results in P. aeruginosa.
(A) Schematic description of protein expression and HT-SELEX procedure and output. (B) Network analysis of similarity of the obtained PWMs. Diamonds indicate TF genes, circles indicate individual PWMs. Edges are drawn between a TF and its PWM model, and between similar models if SSTAT similarity score >1.5e-05. To save space, ‘PA’ is omitted in all TFs names. The names of RRs of TCS are marked in pink font. (C) Comparison of the binding motifs of three TFs (LasR, RsaL, and PhoB) obtained from HT-SELEX (upper) and ChIP or cross-species sequence alignment methods (lower). Arrows indicate half-sites in dimeric sites. Also see Figure 1—figure supplement 1, Supplementary file 1.
Figure 1—figure supplement 1.
Figure 1—figure supplement 1.. Ligand design of HT-SELEX and the distribution of the 24 RRs genomic binding, related to Figure 1A and Figure 1B, and Figure 2D.
(A–D) The schematic diagram for generating the input library for HT-SELEX. (E) The location and the number of binding sites for 24 RRs. The horizontal axis represents the name of each RR, and the positions annotation of 24 different RRs binding sites in the P. aeruginosa genome using pie charts, and the area of each pie chart represents the number of binding sites (log2-transformation).
Figure 2.
Figure 2.. Comparison of different TF-binding modes.
(A) Histogram shows the distribution of the lengths of all PWM models, using red for odds numbers and blue for even numbers for better illustration. (B) Pie chart shows the category of different TF-binding modes. Classification of all binding models into non-repetitive sites (monomer) and sites with two similar subsequences (dimer). The dimeric types are further classified as head-to-head (two TF protein molecules bind to opposite orientation on DNA) and head-to-tail (two TF protein molecules bind consecutively on the same orientation on DNA). (C) Bar chart shows the number of the binding sites per TF. Note that most of TFs target fewer than 100 genes, while eight TFs exceptionally bind to more than 1000 sites in the genome. The inset histogram shows the prevalence of TFs with the corresponding number of predicted TFBSs. (D) The position annotation of binding sites of all 182 TFs in the P. aeruginosa genome using pie charts. The pie chart area is proportional to the percentage of predicted binding site location for all TFs, either inside (blue) or outside (orange) gene body regions. The inset shows the fraction of gene body (blue) and intergenic (orange) regions in the genome, reflected by the area of the two colors in the pie chart. (E) The number of TFs potentially significantly associated with nine virulence-associated pathways. The corresponding transcriptional regulatory network and validation details for each pathway are indicated in the parenthesis (display item). Note that newly associated TFs indicate that the TFs are uncharacterized genes. Also see Figure 2—figure supplement 12.
Figure 2—figure supplement 1.
Figure 2—figure supplement 1.. Validation of different modes of TF binding, related to Figure 2.
(A) Electrophoretic mobility shift assay (EMSA) validation (head-to-head) for the predicted binding of PA4984 in the promoters of the genes PA4889 and arnB. By contrast, the promoter fragment of qslA is used as the negative control for PA4984. (B) EMSA validation (head-to-head) for the predicted binding of AlgB in the promoters of the genes PA2137. By contrast, the promoter fragment of arnB is used as the negative control for AlgB. (C) EMSA validation (monomer) for predicted binding of PA5403 in five promoters (PA5402, PA2439, PA4070, PA2784, and oprQ). By contrast, the promoter fragment of pslA is used as the negative control for PA5403. (D) EMSA validation (head-to-tail) for predicted binding of AmgR in PA0123 promoter. By contrast, the promoter fragment of triA is used as the negative control for AmgR. (E) EMSA validation (head-to-tail) for predicted binding of KdpE in the promoters of the gene PA3762. By contrast, the promoter fragment of PA2078 is used as the negative control for KdpE. (F) EMSA validation (head-to-tail) for the predicted binding of BqsR in the promoters of the gene dppA3. By contrast, the promoter fragment of PA2078 is used as the negative control for BqsR. Note that the up-shift bands of DNA in gel were observed for all samples. By contrast, the promoter fragments of negative control DNA showing no binding to PA4984, AlgB, PA5403, AmgR, KdpE, and BqsR, respectively. The TF motifs are shown in the upper panel of EMSA, respectively. Arrows indicate half-sites in dimeric binding.
Figure 2—figure supplement 2.
Figure 2—figure supplement 2.. Validation of different modes of PhoB binding, related to Figure 2.
Electrophoretic mobility shift assay (EMSA) validation (head-to-tail) for the predicted binding of PhoB in the promoters of PA0136, PA2803, PA2548, PA0842, PA3940, PA1631, phoA, PA0730, PA2428, PA3250, ctpL, PA5473, aer, yrfI, aspA, PA1736, panB, PA1769, and PA3258. By contrast, the promoter fragment of triA is used as the negative control for PhoB binding. Note that the up-shift bands of DNA in gel were observed in all experiments. By contrast, the fragments of negative control DNA showed no binding to PhoB. The TF motif of PhoB is shown in the upper panel of EMSA. Arrows indicate half-sites in dimeric binding.
Figure 2—figure supplement 3.
Figure 2—figure supplement 3.. Validation of different modes of CpxR binding, related to Figure 2.
Electrophoretic mobility shift assay (EMSA) validation (head-to-tail) for the predicted binding of CpxR in the promoters of PA3965, PA3794, PA4513, muxA, nirS, nrdA, PA3205, and PA3575. By contrast, the promoter fragment of PA2078 is used as the negative control for CpxR binding. Note that the up-shift bands of DNA in gel are observed in all experiments. By contrast, the fragments of negative control DNA showed no binding to CpxR. The TF motif of CpxR is shown in the upper panel of EMSA. Arrows indicate half-sites in dimeric binding.
Figure 2—figure supplement 4.
Figure 2—figure supplement 4.. Transcriptional regulation in biofilm pathway, related to Figure 2.
(A) Electrophoretic mobility shift assay (EMSA) validation (head-to-head) for predicted binding of PA4984 in the promoter of iptF. By contrast, the promoter fragment of qslA is used as the negative control for PA4984. Note that the up-shift bands of DNA in gel were observed in the experiment. The fragments of negative control DNA showed no binding to PA4984. The TF motif of PA4984 is shown in the upper panel of EMSA. Arrows indicate half-sites in dimeric binding (left). EMSA validation (head-to-head) for predicted binding of AlgB in the promoter of algB. By contrast, the promoter fragment of arnB is used as the negative control for AlgB. Note that the up-shift bands of DNA in gel were observed in the experiment. The fragments of negative control DNA showed no binding to AlgB. The TF motif of AlgB is shown in the upper panel of EMSA. Arrows indicate half-sites in dimeric binding (middle). EMSA validation (head-to-tail) for predicted binding of BqsR in the promoter of algD. By contrast, the promoter fragment of PA2078 is used as the negative control for BqsR. Note that the up-shift bands of DNA in gel were observed in the experiment. The fragments of negative control DNA showed no binding to BqsR. The TF motif of BqsR is shown in the upper panel of EMSA. Arrows indicate half-sites in dimeric binding (right). (B) Crystal violet assay for 53 transposon insertion mutants. Bar chart shows the biofilm production of the 53 transposon insertion mutant strains in relative to the wild-type strain. *p<0.05, **p<0.01, NS, not significant. The significant mutants were highlighted in yellow color.
Figure 2—figure supplement 5.
Figure 2—figure supplement 5.. Transcriptional regulation in QS pathway, related to Figure 2.
(A) The network illustrates rest of the regulatory relationship between TFs and their target genes in QS pathway. Circles indicate TF proteins, and squares indicate target genes. Diamond highlights the gene with auto-regulation. Red arrows show the binding sites located in the putative promoters of the target genes, establishing the regulatory relationship. To save space, ‘PA’ is omitted in the names of all TFs and their target genes. (B–F) The electrophoretic mobility shift assay (EMSA) validation of predicted binding of PA0479 (B), CatR (C), PA1315 (D), PA2758 (E), and PA2206 (F) to the promoter of qslA, respectively. By contrast, the promoter fragment of katB, nrdA, rocA1, nrdA, and PA3829 were used as the negative controls, respectively. Note that the up-shift bands of DNA in gel were observed in the experiments but not in negative controls. The TF motifs for TFs are respectively shown in the upper panel of EMSA. Arrows indicate half-sites in dimeric binding. (G) EMSA validation (head-to-tail) for predicted binding of CprR to the promoter of higB. By contrast, the promoter fragment of desT is used as the negative control for CprR. Note that the up-shift bands of DNA in gel were observed in the experiment. The fragments of negative control DNA showed no binding to CprR. The TF motif of CprR is shown in the upper panel of EMSA. Arrows indicate half-sites in dimeric binding. (H) EMSA validation (head-to-head) for predicted binding of CreB to the promoters of pstS and mvaU. By contrast, the promoter fragment of PA0530 is used as the negative control for CreB binding. Note that the up-shift bands of DNA in gel were observed in the experiments. The fragments of negative control DNA showed no binding to CreB. The TF motif of CreB is shown in the upper panel of EMSA. Arrows indicate half-sites in dimeric binding. (I) EMSA validation (head-to-head) for predicted binding of PA1864 to the promoter of PA0506. By contrast, the promoter fragment of PA3360 is used as the negative control for PA1864. Note that the up-shift bands of DNA in gel were observed in the experiment. The fragments of negative control DNA showed no binding to PA1864. The TF motif of PA1864 is shown in the upper panel of EMSA. Arrows indicate half-sites in dimeric binding.
Figure 2—figure supplement 6.
Figure 2—figure supplement 6.. Transcriptional regulation in motility pathway.
(A) Network illustrates the regulatory relationship between TFs and their target genes in motility pathway. Circles indicate TF proteins, and squares indicate target genes. Red arrows show the binding sites located in the putative promoters of the target genes, establishing the regulatory relationship. Black arrows indicate that we did electrophoretic mobility shift assay (EMSA) validation, demonstrated in panel B. To save space, ‘PA’ is removed in the names of all TFs and their target genes. (B) EMSA validation (head-to-head) for predicted binding of PA3594 to the promoter of flgB. By contrast, the promoter fragment of katB is used as the negative control for P PA3594. Note that the up-shift bands of DNA in gel were observed in the experiment. The fragments of negative control DNA showed no binding to PA3594. The TF motif of PA3594 is shown in the upper panel of EMSA. Arrows indicate half-sites in dimeric binding.
Figure 2—figure supplement 7.
Figure 2—figure supplement 7.. Transcriptional regulation in antibiotic resistance pathway.
(A) Network illustrates part of the regulatory relationship between TFs and their target genes in antibiotic resistance pathway. The other part is shown in Figure 2—figure supplement 8. Circles indicate TF proteins, and squares indicate target genes. Red arrows show the binding sites located in the putative promoters of the target genes, establishing the regulatory relationship. Black arrows indicate that we did experimental validations, demonstrated in panels B–E. To save space, ‘PA’ is removed in the names of all TFs and their target genes. (B) The validation on the binding of PhoB to the shared promoter of PA0959 or oprD. Electrophoretic mobility shift assay (EMSA) experiment (left) validated the binding of PhoB to the promoter. Note that a binding-caused up-shift of the DNA bands in gel was observed. By contrast, the promoter fragment of triA was used as the negative control showing no binding to PhoB. The motif of PhoB is shown in above the EMSA result. Arrows indicate half-sites in dimeric binding. The right panel validates the binding of PhoB to a predicted site in the promoter of the PA0959 orthologue TF PA14_51860 in Pseudomonas aeruginosa UCBPP-PA14, by a ChIP-seq peak identified in an independent study (Bielecki et al., 2015). (C) The validation on the binding of PhoB to the promoter of PA3515-PA3519 operon. EMSA experiment (left) validated the binding of PhoB to the promoter of PA3515–PA3519 operon. The binding-caused up-shift of the DNA bands in gel was observed. The negative control is the same as panel B. The right panel validates the binding of PhoB to a predicted site in the promoter of the PA3515-PA3519 operon orthologue TF PA14_18810 in Pseudomonas aeruginosa UCBPP-PA14, by a ChIP-seq peak identified in an independent study (Bielecki et al., 2015). (D and E) Binding of PhoB to a predicted site in the promoters of pstCAB operon (D) and the shared promoter of czcCB operon and PA2523 orthologue PA14_31960 (E) is supported by a ChIP-seq peak identified in an independent study (Bielecki et al., 2015).
Figure 2—figure supplement 8.
Figure 2—figure supplement 8.. Transcriptional regulation in antibiotic resistance pathway, related to Figure 2—figure supplement 7.
The remaining network illustrates the regulatory relationship between TFs and their target genes in antibiotic resistance pathway. Circles indicate TF proteins, and squares indicate target genes. Red arrows show the binding sites located in the putative promoters of the target genes, establishing the regulatory relationship. To save space, ‘PA’ is removed in the names of all TFs and their target genes.
Figure 2—figure supplement 9.
Figure 2—figure supplement 9.. Transcriptional regulation in siderophore synthesis pathway.
(A) Network illustrates the regulatory relationship between TFs and their target genes in siderophore synthesis pathway. Circles indicate TF proteins, and squares indicate target genes. Diamond highlights the gene with auto-regulation. Red arrows show the binding sites located in the putative promoters of the target genes, establishing the regulatory relationship. Black arrows highlight the binding with additional experimental validation, shown in panels B and C. To save space, ‘PA’ is removed in the names of all TFs and their target genes. (B) Electrophoretic mobility shift assay (EMSA) experiment validates the binding of PA1315 (head-to-head) in its own promoter. By contrast, the promoter fragment of rocA1 is used as the negative control. Note that the up-shift bands of DNA in gel were observed in the experiment. The fragments of negative control DNA showed no binding to PA1315. The TF motif of PA1315 is shown in the upper panel of EMSA. Arrows indicate half-sites in dimeric binding. (C) Validation of the predicted binding for PA1413 (head-to-head) in the promoters of PA2384 were conducted using EMSA. Note that a binding-caused up-shift of the DNA bands were observed. By contrast, the promoter of PA4842 was used as the negative controls showing no binding. The TF motif of PA1413 is shown in the upper panel of EMSA. Arrows indicate half-sites in dimeric binding.
Figure 2—figure supplement 10.
Figure 2—figure supplement 10.. Transcriptional regulation in T3SS, ROS, and SR and persister pathways.
Networks illustrate the regulatory relationship between TFs and their target genes in T3SS (A), ROS (B), SR and persister (C) pathways. Circles indicate TF proteins, and squares indicate target genes. Red arrows show the binding sites located in the putative promoters of the target genes, establishing the regulatory relationship. Black arrows highlight the binding with additional experimental validation and indicating the panels of the experimental results. To save space, ‘PA’ is removed in the names of all TFs and their target genes.
Figure 2—figure supplement 11.
Figure 2—figure supplement 11.. Comparison of motifs derived from HT-SELEX and other methods.
(A) A table lists motifs derived from different methods, such as ChIP-seq, ChIP-chip, and sequence alignment. (B) Bar chart shows the area under the precision-recall curve for the 10 TFs that were analyzed by both ChIP-seq and HT-SELEX.
Figure 2—figure supplement 12.
Figure 2—figure supplement 12.. Significant association of putative TFs with various virulence-associated pathways.
Radar plots show the putative regulators significantly associated with different virulence pathways (from top left to bottom right): antibiotic resistance, biofilm production, motility, quorum sensing, oxidative stress resistance, siderophore, stringent response and persisters, type III secretion system, and type VI secretion system. Each radiation line represents one TF, and the length of colored radius is proportional to the -log10 (p-value), reflecting the significance of the enrichment of the network analysis-predicted TF targets within the pathway-associated genes. The names of regulators are marked in red type-face.
Figure 3.
Figure 3.. Transcriptional regulatory network in biofilm production pathway.
(A) Network illustrates part of the regulatory relationship between TFs and their target genes in the biofilm pathway. Circles indicate TF proteins, and squares indicate target genes. Diamond highlights the gene with auto-regulation. Red arrows show that the binding sites are located in the putative promoters of the target genes, establishing the regulatory relationship. Black arrows highlight the binding with additional experimental validation. To save space, ‘PA’ is removed in the names of all TFs and their target genes. The dashed ovals and letters highlight regulatory relation validated in the corresponding figures and panels. (B) Comparison of binding motif of AmrZ derived by HT-SELEX (‘SELEX’) in the current study with a motif developed from a previous ChIP-seq study (upper). Arrows indicate half-sites in dimeric binding. Binding of AmrZ to a predicted site in the promoter of the psl operon is supported by a peak identified by a previous ChIP-seq study (lower) (Jones et al., 2014). (C) Electrophoretic mobility shift assay (EMSA) experiment validates the binding of PA0225, with its motif shown at the upper panel, to the promoter of pelABCDEFG. Arrows indicate half-sites in dimeric binding. Note that a binding-caused up-shift of the DNA band in gel is observed. By contrast, a negative control is used showing no binding to PA0225. (D) RT-qPCR shows that the transcription of pelA is significantly lower in PA0225 mutant cells compared with the wild-type cells (***p<0.001, Student’s t-test). ‘Endo. PA0225’ indicates endogenous expression of PA0225. ‘Ecto. PA0225’ indicates the ectopic expression of PA0225 delivered by the transformed plasmid pAK1900. Three technical replicates were performed. (E) The biofilm formation detection in the wild-type, PA0225 mutant, and PA0225 complemented strains using a crystal violate staining assay. ‘Endo. PA0225’ indicates endogenous expression of PA0225. ‘Ecto. PA0225’ indicates the ectopic expression of PA0225 by the transformed plasmid pAK1900. (F) The quantification of biofilm production in the wild-type, PA0225 mutant, and PA0225 complemented strains using a crystal violate staining assay. ‘Endo. PA0225’ indicates endogenous expression of PA0225. ‘Ecto. PA0225’ indicates the ectopically expression of PA0225 by the transformed plasmid pAK1900. Three technical replicates were conducted (*p<0.05; **p<0.01, Student’s t-test).
Figure 4.
Figure 4.. TF-target networks in QS pathway.
(A) Network illustrates part of the regulatory relationship between TFs and their target genes in the QS pathway. The rest of the part is shown in Figure 2—figure supplement 5. Circles indicate TF proteins, and squares indicate target genes. Diamond highlights the gene with auto-regulation. Red arrows show that the binding sites are located in the putative promoters of the target genes, establishing the regulatory relationship. Black arrows highlight the binding with additional experimental validation. To save space, ‘PA’ is removed in the names of all TFs and their target genes. The dashed ovals and letters highlight regulatory relation validated in the corresponding figures and panels. (B) Arrows indicate half-sites in dimeric binding. Binding of PhoB to a predicted site in its own promoter, which was supported by a ChIP-seq peak. Input signal is shown for reference. The genomic coordinates are shown above the track and the genes (blue blocks) are indicated below the track. The exact binding site identified by our PhoB PWM is also highlighted. (C) Electrophoretic mobility shift assay (EMSA) and RT-qPCR validation of the predicted binding of PA2497 in the promoter of qslA. Left, EMSA experiment validates the binding of PA2497, with its motif shown at the upper panel, to the promoter of qslA. Arrows indicate half-sites in dimeric binding. Note that a binding-caused up-shift of the DNA band in gel was observed. By contrast, a negative control is used showing no binding to PA2497. Right, RT-qPCR shows that the qslA transcription is significantly lower in PA2497 mutant cells compared with the wild-type cells (*p<0.05, Student’s t-test). ‘Endo. PA2497’ indicates endogenous expression of PA2497. ‘Ecto. PA2497’ indicates the ectopic expression of PA2497 by the transformed plasmid. Three technical replicates were conducted. (D) EMSA and RT-qPCR validation of the predicted binding of PA1413 in the promoter of phzH. Left, EMSA experiment validates the binding of PA1413, with its motif shown at the upper panel, to the promoter of phzH. Arrows indicate half-sites in dimeric binding. Note that a binding-caused up-shift of the DNA band in gel was observed. By contrast, a negative control is used showing no binding to PA1413. Right, RT-qPCR shows that the phzH transcription is significantly lower in PA1413 mutant cells compared with the wild-type cells (*p<0.05, Student’s t-test). ‘Endo. PA1413’ indicates endogenous expression of PA1413. ‘Ecto. PA1413’ indicates the ectopic expression of PA1413 by the transformed plasmid. Three technical replicates were conducted.
Figure 5.
Figure 5.. Transcriptional regulation in T6SS pathway.
(A) Network illustrates the regulatory relationship between TFs and their target genes in T6SS pathway. Circles indicate TF proteins, and squares indicate target genes. Diamond highlights the gene with auto-regulation. Red arrows show that the binding sites are located in the putative promoters of the target genes, establishing the regulatory relationship. Black arrows highlight the binding with additional experimental validation. To save space, ‘PA’ is removed in the names of all TFs and their target genes. The dashed ovals and letters highlight regulatory relation validated in the corresponding figures and panels. (B) Left panel shows an electrophoretic mobility shift assay (EMSA) experiment to validate the binding of PhoB, with its motif shown at the upper panel, to the promoter of amrZ (left). Arrows indicate half-sites in dimeric binding. Note that a binding-caused up-shift of the DNA band in gel was observed. By contrast, a negative control was used showing no binding to PhoB. Right panel shows the binding of PhoB to a predicted site in the promoter of amrZ, which was supported by a ChIP-seq peak. Input signal is shown for reference. The genomic coordinates are shown above the track and the genes are indicated below the track. The exact binding site identified by our PhoB PWM is also highlighted. (C) EMSA experiment validates the binding of PA1315, with its motif shown at the upper panel, to the promoter of amrZ. Arrows indicate half-sites in dimeric binding. Note that a binding-caused up-shift of the DNA band in gel was observed. By contrast, a negative control was used showing no binding to PA1315. (D) EMSA experiment validated the binding of PA3249, with its motif shown at the upper panel, to the promoter of amrZ. Arrows indicate half-sites in dimeric binding. Note that a binding-caused up-shift of the DNA band in gel was observed. By contrast, a negative control was used showing no binding to PA3249. (E) EMSA validation of the predicted binding of PA0535, with its motif shown at the upper panel, to the promoter of vgrG4. Arrows indicate half-sites in dimeric binding. Note that a binding-caused up-shift of the DNA band in gel was observed. By contrast, a negative control was used showing no binding to PA0535.
Figure 6.
Figure 6.. TF clustering by function of the putative targets.
The heat map shows the functional annotation enrichment of TF targets in 29 gene ontology (GO) terms. The color key indicates the -log10 (p-value).
Author response image 1.
Author response image 1.. Venn diagrams show the comparison of predicted GacA (left) or AmrZ (right) target genes (red) and differentially expressed genes upon deletion of GacA or AmrZ (blue).
Author response image 2.
Author response image 2.. A table shows comparison of motifs discovered in different replicative experiments of TF HT-SELEX.
Note that the proteins and input DNA were both independently synthesized and all motifs for the same TF were identical.
Author response image 3.
Author response image 3.. SDS-PAGE results detecting the TF protein expression.
The three TFs, GbdR, SoxR, and VqsR showing abundant expression did not recover any specific DNA binding motifs.
Author response image 4.
Author response image 4.. SDS-PAGE gel result for 23 purified TFs (Left).
All TFs expressed successfully. Only 13 TFs had HT-SELEX-generated motifs.
Author response image 5.
Author response image 5.. Table shows comparison of RpoN motifs.
Original motif shows the PWM logo of RpoN binding we obtained in original submission while the current motifs shows the replicative experiments in revision. Note that we repeated the HT-SELEX for 4 times with different input DNA ligands. Except in the replication 1 that we detected both conventional RopN motif and the motif we obtained in first batch, the other 3 replicates only detected the conventional RopN motif.
Author response image 6.
Author response image 7.
Author response image 7.. The association between predicted TSS and TF binding sites for PA0225 and PA2497.

Similar articles

Cited by

References

    1. Allsopp LP, Wood TE, Howard SA, Maggiorelli F, Nolan LM, Wettstadt S, Filloux A. RsmA and AmrZ orchestrate the assembly of all three type VI secretion systems in Pseudomonas aeruginosa. PNAS. 2017;114:7707–7712. doi: 10.1073/pnas.1700286114. - DOI - PMC - PubMed
    1. Arora SK, Ritchings BW, Almira EC, Lory S, Ramphal R. A transcriptional activator, FleQ, regulates mucin adhesion and flagellar gene expression in Pseudomonas aeruginosa in a cascade manner. Journal of Bacteriology. 1997;179:5574–5581. doi: 10.1128/JB.179.17.5574-5581.1997. - DOI - PMC - PubMed
    1. Badal D, Jayarani AV, Kollaran MA, Kumar A, Singh V. Pseudomonas aeruginosa biofilm formation on endotracheal tubes requires multiple two-component systems. Journal of Medical Microbiology. 2020;69:906–919. doi: 10.1099/jmm.0.001199. - DOI - PubMed
    1. Balasubramanian D, Schneper L, Merighi M, Smith R, Narasimhan G, Lory S, Mathee K. The regulatory repertoire of Pseudomonas aeruginosa AmpC ß-lactamase regulator AmpR includes virulence genes. PLOS ONE. 2012;7:e34067. doi: 10.1371/journal.pone.0034067. - DOI - PMC - PubMed
    1. Baraquet C, Murakami K, Parsek MR, Harwood CS. The FleQ protein from Pseudomonas aeruginosa functions as both a repressor and an activator to control gene expression from the pel operon promoter in response to c-di-GMP. Nucleic Acids Research. 2012;40:7207–7218. doi: 10.1093/nar/gks384. - DOI - PMC - PubMed

Publication types

MeSH terms

Associated data