Review
. 2021 Mar 29:10:e60416.
doi: 10.7554/eLife.60416.

FRET-based dynamic structural biology: Challenges, perspectives and an appeal for open-science practices

Affiliations
Review

FRET-based dynamic structural biology: Challenges, perspectives and an appeal for open-science practices

Eitan Lerner et al. Elife. .

Abstract

Single-molecule FRET (smFRET) has become a mainstream technique for studying biomolecular structural dynamics. The rapid and wide adoption of smFRET experiments by an ever-increasing number of groups has generated significant progress in sample preparation, measurement procedures, data analysis, algorithms and documentation. Several labs that employ smFRET approaches have joined forces to inform the smFRET community about streamlining how to perform experiments and analyze results for obtaining quantitative information on biomolecular structure and dynamics. The recent efforts include blind tests to assess the accuracy and the precision of smFRET experiments among different labs using various procedures. These multi-lab studies have led to the development of smFRET procedures and documentation, which are important when submitting entries into the archiving system for integrative structure models, PDB-Dev. This position paper describes the current 'state of the art' from different perspectives, points to unresolved methodological issues for quantitative structural studies, provides a set of 'soft recommendations' about which an emerging consensus exists, and lists openly available resources for newcomers and seasoned practitioners. To make further progress, we strongly encourage 'open science' practices.

Keywords: FRET; biochemistry; biomolecules; chemical biology; community; conformation; dynamics; molecular biophysics; single-molecule; structural biology.


Conflict of interest statement

EL, AB, JH, BA, VB, SB, RB, HS, TC, TC, AD, JD, JF, RG, IG, TH, CH, GH, NH, SH, SH, TH, AI, CJ, AK, HK, TL, NL, TL, EL, EM, JM, XM, SM, DN, TP, EP, YR, NR, BS, HS, CT, RV, DL, CS, SW No competing interests declared

Figures

Figure 1.
Figure 1.. Workflow of modeling dynamic structures from FRET measurements.
(A) Integrative modeling requires structural and dynamic information. Prior information from conventional approaches (X-ray, NMR, cryoEM) together with computational tools defines the space of possible solutions for FRET-assisted structural modeling. The combination of structural (inter-dye distances) and dynamic information (kinetic connectivity and exchange rates) enables identification of a consistent model. (B) Study of structure and dynamics of chromatin fibers. A combined TIRF and confocal FRET study of structure and dynamics of chromatin fibers using three FRET labeling positions (DA1-3) for two pairs of dyes with distinct Förster distances. Förster distances ( is defined in section Inter-dye distances, Equation 6). Prior structural information provided by cryo-electron microscopy (top, left) (Song et al., 2014) and X-ray crystallography (top, right PDB ID: 1ZBB Schalch et al., 2005) is combined with the structural and dynamic information obtained by FRET experiments on immobilized molecules measured by total internal reflection (TIRF) microscopy and on freely diffusing molecules by confocal microscopy (Kilic et al., 2018). From the combined information, a consistent model is derived for chromatin fiber conformations with shifted registers, which are connected by slow (>100 ms) and fast de-compaction processes (150 µs) that do not proceed directly, but rather through an open fiber conformation. Figure 1B was reproduced from Figures 1, 3, and 6 in Kilic et al., 2018, Nature Communications with permission, published under the Creative Commons Attribution 4.0 International Public License (CC BY 4.0; https://creativecommons.org/licenses/by/4.0/).
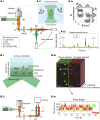
Figure 2.
Figure 2.. Different smFRET modalities.
(A) Confocal smFRET measurements on freely-diffusing molecules. (i) A schematic of a single-color excitation confocal microscope with point detectors used for two-color detection. The excitation light is guided to the microscope body and reflected by a dichroic mirror (DM) toward a high numerical aperture (NA) objective lens that focuses the light in solution. The fluorescence emission is collected through the same objective lens, passes through the DM and pinhole and is spectrally split into donor and acceptor detection channels by a second DM in the detection path. After passing through emission filters (EF), single photons are detected on point detectors with high quantum efficiency, typically avalanche photodiodes (APD). (ii) Illustration of a double-labeled molecule freely diffusing through the confocal excitation spot. (iii) Exemplary confocal smFRET measurement showing photon bursts arising from single-molecules diffusing through the confocal volume. Green: Donor emission. Red: Acceptor emission. Exemplary bursts belonging to a single- or a double-labeled molecule are indicated with arrows. (iv) In ALEX or PIE experiments, the two-dimensional histogram of the molecule-wise FRET efficiency E and stoichiometry S allows one to separate single- and double-labeled populations (2005 Elsevier Ltd. All rights reserved. The figure was originally published as Figure 2A in Lee et al., 2005. Biophysical Journal, 88(4): 2939–2953. Further reproduction of this panel would need permission from the copyright holder). (B) TIRF-based smFRET experiments on surface-immobilized molecules. (i) Illustration of a surface-immobilized sample labeled with donor and acceptor fluorophores. (ii) Scheme of a single-color objective-type TIRF excitation two-color wide-field detection microscope. A: Aperture, TL: Tube lens, L: Lens, M: Mirror, DM: Dichroic mirror, EF: Emission filter. (iii) Illustration of an image of single molecules, in which the donor and acceptor (FRET) signals are split onto two halves of the camera. Mapping between the two channels is typically done using fluorescent beads (Joo and Ha, 2012; Roy et al., 2008; Zhuang et al., 2000) or zero-mode waveguides (Salem et al., 2019). (iv) Single-molecule fluorescence trajectory of the donor and acceptor (FRET) dyes, illustrating an anti-correlation indicative of FRET dynamics.
Figure 3.
Figure 3.. Exemplary methods for following smFRET dynamics on different timescales.
Top: Biomolecular dynamics cover a wide range of timescales. Biomolecular rotations occur in the pico- to nanosecond range, while conformational changes take place in nano- to microseconds (ns-µs), as in chain dynamics of disordered proteins, and protein folding in microseconds to minutes. Transitions along energetically unfavorable pathways can take up to hours or longer, as in protein misfolding (Borgia et al., 2011; Tosatto et al., 2015). (2013 Elsevier Ltd. All rights reserved. The figure was originally published as Figure 1 in Schuler and Hofmann, 2013. Current Opinion in Structural Biology, 23(1): 36–47. Further reproduction of this panel would need permission from the copyright holder.) Bottom: (A) Picosecond (ps) to millisecond (ms) processes are typically examined with confocal methods such as polarization-resolved fluorescence lifetime measurements and Fluorescence Correlation Spectroscopy (FCS). Example shown: chain dynamics of an IDP from nsFCS. (B) Conformational states are identified by individual populations with characteristic positions in the FRET efficiency - lifetime diagrams as discussed in the sections Detection and characterization of intra-state dynamics and Future of smFRET (adapted from Soranno et al., 2012). (C) Fast transitions measured using confocal microscopy can be analyzed using the photon trajectory and applying a photon-by-photon maximum likelihood approach (2018 Elsevier Ltd. All rights reserved. The figure was originally published as Figures 2 and 3 in Chung and Eaton, 2018. Current Opinion in Structural Biology, 48: 30–39. Further adaptation of this panel would need permission from the copyright holder.) The timescale over which kinetics can be measured can be extended for diffusing molecules at low concentrations by using a recurrence analysis of single particles (RASP, Hoffmann et al., 2011). (D) Non-equilibrium experiments over extended periods of time can be performed with microfluidic mixing devices. (Copyright 2011, Nature Publishing Group, a division of Macmillan Publishers Limited. All Rights Reserved. Reproduced from Gambin et al., 2011, with permission. Nature Methods 8:239–241. Further reproduction of this panel would need permission from the copyright holder.) (E) Slow changes in conformations over a broad range of timescales can be followed in smFRET efficiency trajectories registered by single-photon counting (SPC) or cameras over minutes to many hours when the sample is immobilized (adapted from Figure 1 of Zosel et al., 2018).
Figure 4.
Figure 4.. Exemplary selection of approaches to detect and quantify conformational dynamics in smFRET.
(A) Dynamics in a three-state system are detected using the two-dimensional distribution of the FRET efficiency and donor fluorescence lifetime (Reproduced from Gopich and Szabo, 2012. Further reproduction of this panel would need permission from the copyright holder.) (B) The two-state dynamics of a DNA hairpin are revealed from the standard deviation of the proximity ratio E that is higher than expected for photon counting statistics alone in the burst variance analysis (BVA). (2011 The Biophysical Society. Published by Elsevier Inc All rights reserved. The figure was originally published as Figure 4C in Torella et al., 2011. Biophysical Journal, 100(6): 1568–1577. Further reproduction of this panel would need permission from the copyright holder.) (C) In fluorescence correlation spectroscopy (FCS), the dynamics show up as a positive correlation in the autocorrelation functions GDD and GAA and an anti-correlation in the cross-correlation function GDA (2010 American Chemical Society Ltd. All rights reserved. The figure was originally published as Figure 1B and C in (Gurunathan and Levitus, 2010, reproduced with permission). Copyright 2010 ACS Publications. Further reproduction of this panel would need permission from the copyright holder.) (D) Photon-by-photon maximum likelihood estimation (MLE) infers the kinetic parameters directly from the photon arrival times (2011 American Chemical Society Ltd. All rights reserved. The figure was originally published as the Abstract Figure in Chung et al., 2011, reproduced with permission. Copyright 2011 ACS Publications. Further reproduction of this panel would need permission from the copyright holder.) (E–F) A hidden Markov model (HMM) is applied to the time traces of the FRET efficiency to estimate the states and interconversion rates (E). From the transition density plot (F), the connectivity of the FRET states is revealed. Displayed data in E and F are simulated. (Panels E and F: 2006 The Biophysical Society. Published by Elsevier Inc All rights reserved. The figures were originally published as Figure 4A and D in McKinney et al., 2006. Biophysical Journal, 91(5): 1941–1951. Further reproduction of this panel would need permission from the copyright holder.)
Figure 5.
Figure 5.. Dye models for FRET.
(A) The different kinetic averaging regimes for rotation and diffusion are shown schematically. In the dynamic averaging regime, rotation and diffusion happen on a timescale faster than the FRET process. In the isotropic averaging regime, translation is slower than the FRET process, but rotation is fast. The static average applies if both rotation and diffusion are slow compared to the rate of energy transfer. For most experimental situations, the isotropic average is most appropriate. (2008 National Academy of Sciences. Reproduced from Wozniak et al., 2008. Further reproduction of this panel would need permission from the copyright holder.) (B) A schematic of a donor/acceptor fluorophore pair (Alexa488, Alexa647) attached to the protein Atlastin-1. (C) The accessible volume that the acceptor fluorophore can explore is determined from a molecular dynamics simulation. (D) Different coarse-grained dye models are used in the community to describe the three-dimensional dye density ρDye (see main text). (Panels B, C, and D were reproduced from Dimura et al., 2016, Current Opinion in Structural Biology with permission, published under the Creative Commons Attribution 4.0 International Public License (CC BY 4.0; https://creativecommons.org/licenses/by/4.0/).)
Figure 6.
Figure 6.. Approaches to integrative modeling using FRET restraints.
(A) Rigid bodies, representing either different domains of a protein or different proteins within a complex, are arranged by translation and rotation to satisfy the FRET restraints. Adapted from Figure 1 of Hellenkamp et al., 2017. (B) The structure that best satisfies all FRET restraints is selected from a prior ensemble. Adapted from Figure 2 of Dimura et al., 2020. (C) Using triangulation, the most likely dye position is estimated from the FRET distances with respect to known reference positions on the structure. (Reproduced from Andrecka et al., 2009, Nucleic Acid Research with permission, published under the Creative Commons Attribution-NonCommercial 4.0 International Public License (CC BY NC 4.0; https://creativecommons.org/licenses/by-nc/4.0). Further reproduction of this panel would need permission from the copyright holder.) (D) Starting from a known structure, a molecular dynamics simulation is guided using the FRET information by applying forces based on the FRET distances. (Reproduced from Dimura et al., 2020. Further reproduction of this panel would need permission from the copyright holder.)
Figure 7.
Figure 7.. Concept for data storage following the FAIR principle.
All essential information should be contained in two data files, one for raw data and a second with the essential information regarding the associated analysis. (Left) Structure of proposed data file formats containing confocal or TIRF raw data in a time-tagged, TT, or time-tagged time-resolved, TTTR, format together with sample- and experiment-specific metadata (for details, see Figure 8). The measurement specifications are needed by the reading routine to reconstruct the photon trace from the stored data, for example, for timing in the TT format (sampling frequencies expressed as time bins or frame rates) or in the TTTR format (laser repetition rates, time binning in time-correlated single-photon counting). Moreover, the detector that measured the signal is noted (detector #) along with the detection time with a given time resolution. For representing the detection time of single photons in time-resolved smFRET studies, the TTTR format is used where the time corresponds to the sum of the macro time and the nano time (upper left panel). The macro time comprises multiple cycles of excitation laser pulses (blue vertical lines) and the nano time is determined by time-correlated single-photon counting with picosecond resolution. The TTTR format is the most compact data format for single-molecule fluorescence data for detection times with picosecond time resolution and macro-times of hours (Felekyan et al., 2005). The representation of the photon detection of intensity-based and imaging-based smFRET studies is in the TT format, where the macro-time comprises multiples of the external clock pulse or readout cycles, where single or several photons were detected. The stack of TIFF images acquired in TIRF measurements (lower left panel) is transformed into the TT format for analyzing photon time traces for selected spots. (Middle) For the corresponding data file, a metadata system as implemented in the Photon-HDF5 file format (Ingargiola et al., 2016a) is suggested. (Right) The analysis file should contain the determined parameters obtained by a quantitative analysis together with analysis metadata that assure evaluation, reproducibility, and re-usability of the analysis. The processed data should be documented as outlined in Figure 8D.
Figure 8.
Figure 8.. Disseminating the results of smFRET studies.
Recommended categories for data and method-specific information (metadata), which are needed for documentation of smFRET studies where the authors want to archive their obtained kinetic/structural models. (A) General information. (B) Information on the sample and FRET-specific properties. (C) Information on the experiment and data acquisition. (D) Information on processing and analysis procedures. (E) Information on the interpretation of the data and the final kinetic network or structural model.
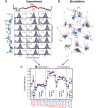
Figure 9.
Figure 9.. Using smFRET to investigate the structure and dynamics of ultrahigh-affinity IDP complexes.
(A) SmFRET efficiency histograms for FRET between a donor label (Alexa488) attached at various positions to the linker histone H1 (shown in blue) with the IDP ProTα (shown in red) labeled at different positions with the acceptor fluorophore (Alexa594). (B) For structural calculations of the H1-ProTα complex, coarse-grained MD simulations were performed. From the MD simulations, an ensemble of structures was determined. Eleven examples of configurations are shown and projected onto the first three principle components (PC1, PC2, and PC3) of the inter-residue distance map. 2D projections of the full ensemble are shown in gray (axes are labeled in Å). (C) A comparison of the experimental FRET efficiencies (filled squares) and the FRET efficiencies estimated from simulated structures (open circles) shows good agreement between the measured and simulated values. Pictograms indicate the variations of dye positions studied. (Panels A, B, and C: Copyright 2018, Nature Publishing Group, a division of Macmillan Publishers Limited. All rights reserved. Reproduced from Borgia et al., 2018, with permission. Further reproduction of this panel would need permission from the copyright holder.)

References

    1. Acuna GP, Möller FM, Holzmeister P, Beater S, Lalkens B, Tinnefeld P. Fluorescence enhancement at docking sites of DNA-directed self-assembled nanoantennas. Science. 2012;338:506–510. doi: 10.1126/science.1228638. - DOI - PubMed
    1. Aitken CE, Marshall RA, Puglisi JD. An oxygen scavenging system for improvement of dye stability in single-molecule fluorescence experiments. Biophysical Journal. 2008;94:1826–1835. doi: 10.1529/biophysj.107.117689. - DOI - PMC - PubMed
    1. Akyuz N, Altman RB, Blanchard SC, Boudker O. Transport dynamics in a glutamate transporter homologue. Nature. 2013;502:114–118. doi: 10.1038/nature12265. - DOI - PMC - PubMed
    1. Alejo JL, Blanchard SC, Andersen OS. Small-molecule photostabilizing agents are modifiers of lipid bilayer properties. Biophysical Journal. 2013;104:2410–2418. doi: 10.1016/j.bpj.2013.04.039. - DOI - PMC - PubMed
    1. Altman RB, Terry DS, Zhou Z, Zheng Q, Geggier P, Kolster RA, Zhao Y, Javitch JA, Warren JD, Blanchard SC. Cyanine fluorophore derivatives with enhanced photostability. Nature Methods. 2012;9:68–71. doi: 10.1038/nmeth.1774. - DOI - PMC - PubMed

Publication types

MeSH terms

Grants and funding