. 2021 Jun 7;218(6):e20201839.
doi: 10.1084/jem.20201839.

Inhibition of macrophage histone demethylase JMJD3 protects against abdominal aortic aneurysms

Affiliations

Inhibition of macrophage histone demethylase JMJD3 protects against abdominal aortic aneurysms

Frank M Davis et al. J Exp Med. .

Abstract

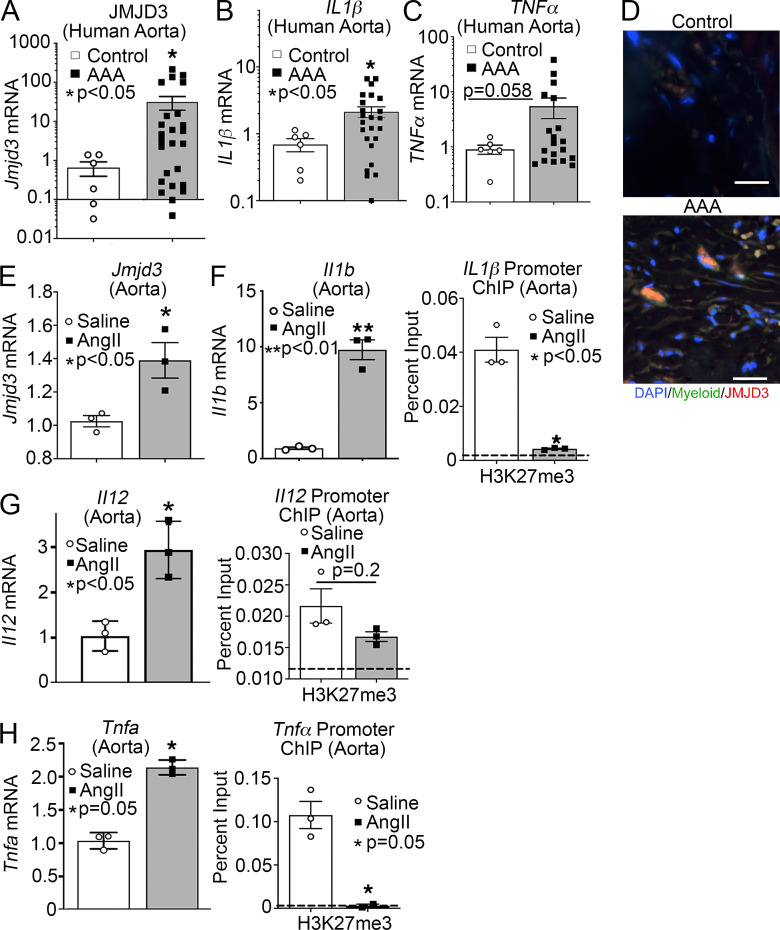
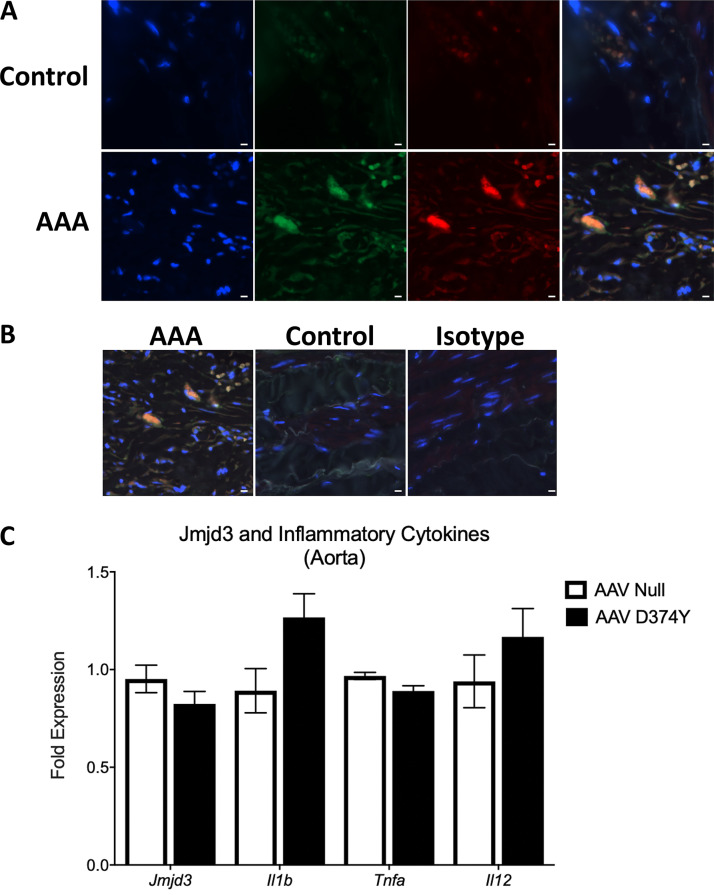
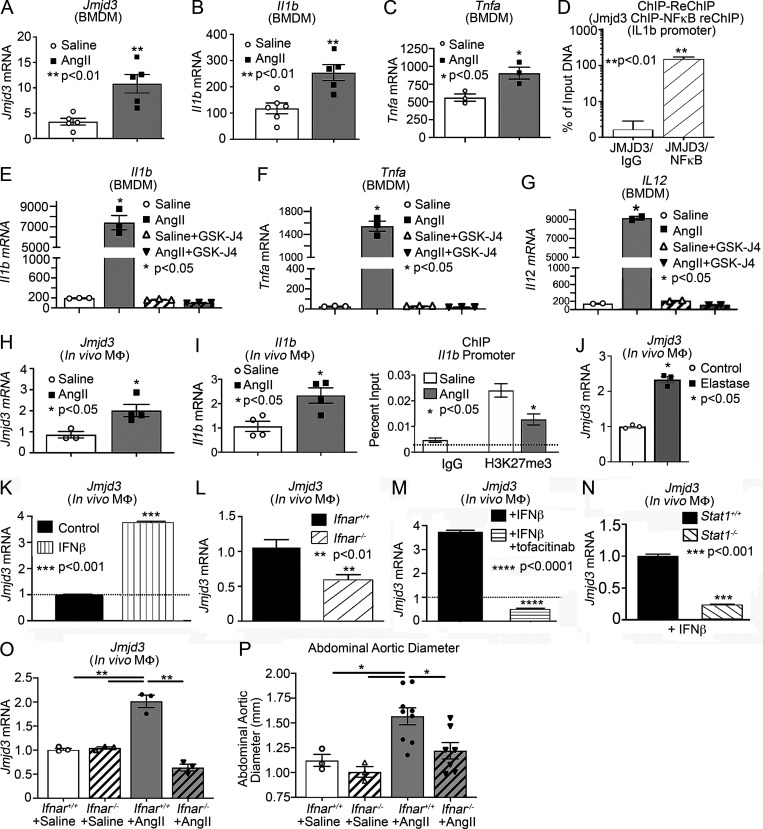
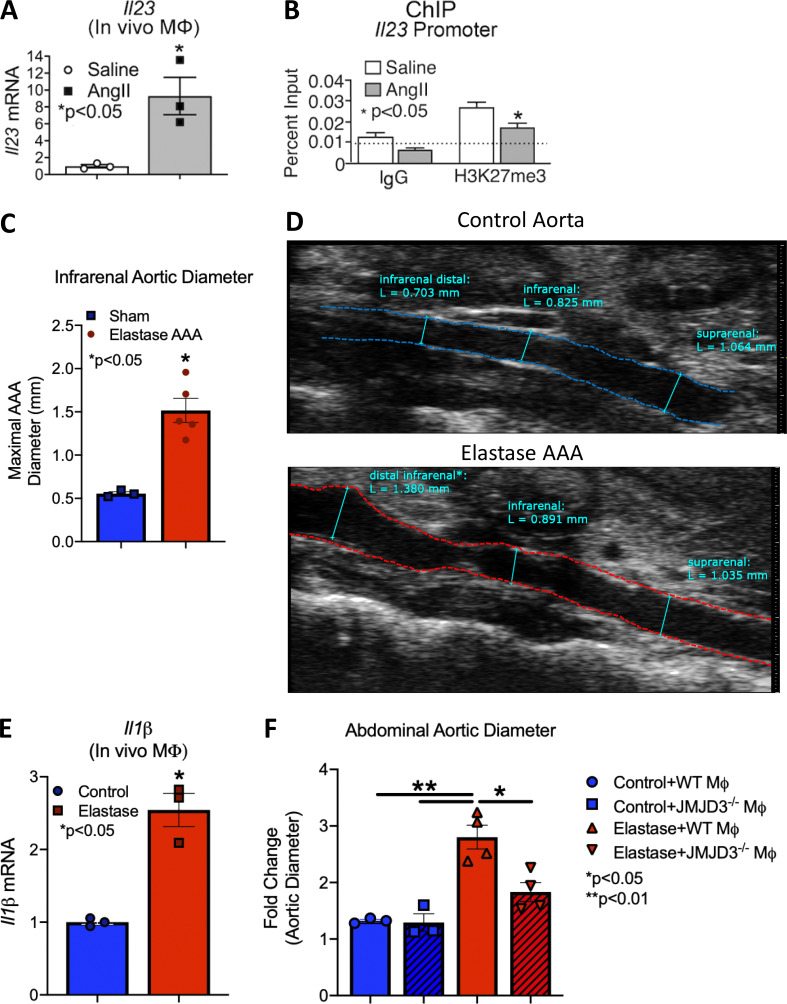
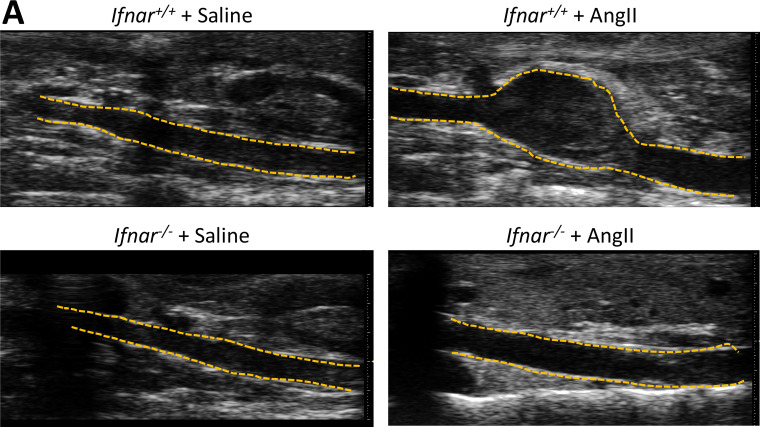
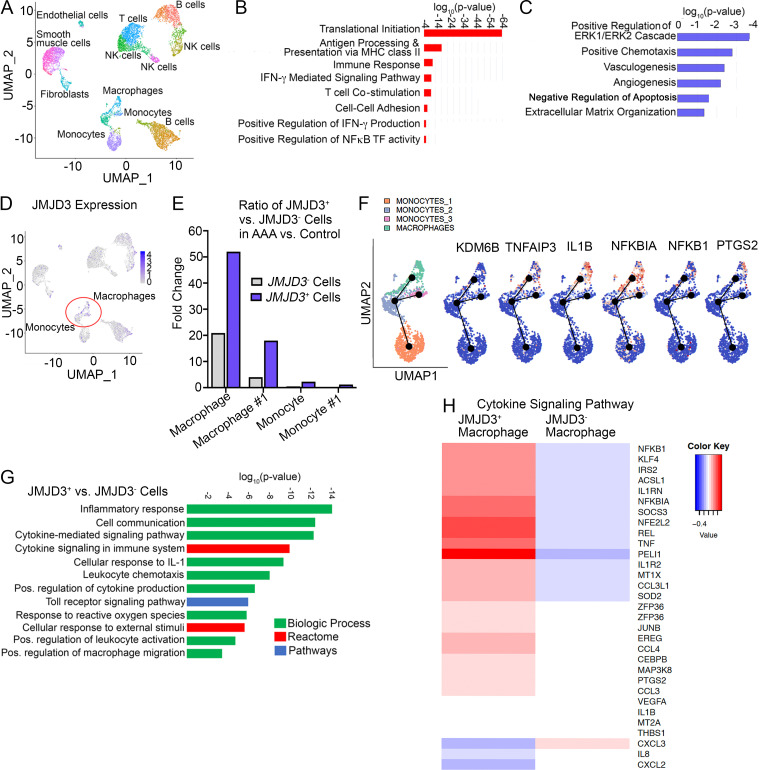
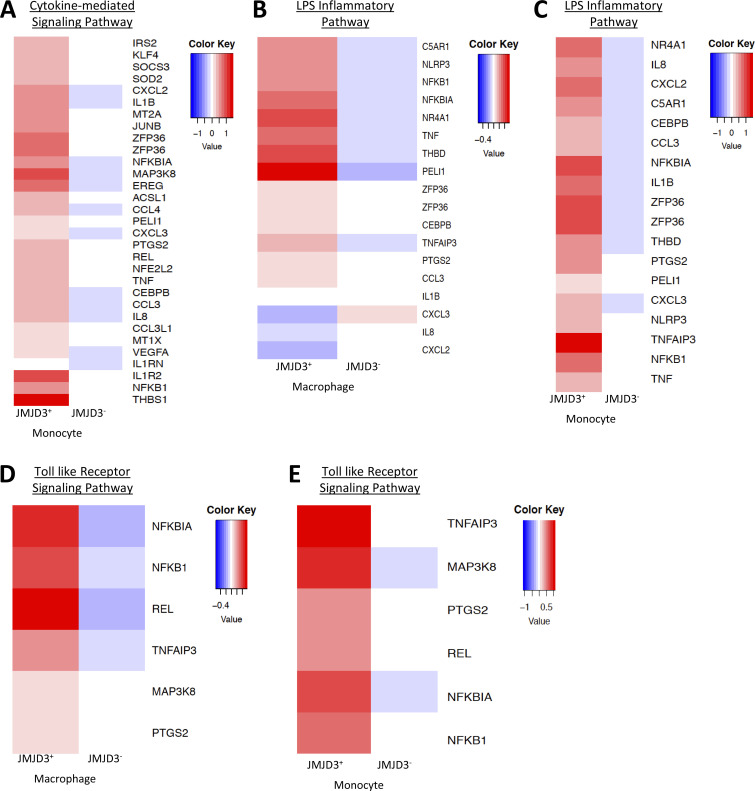
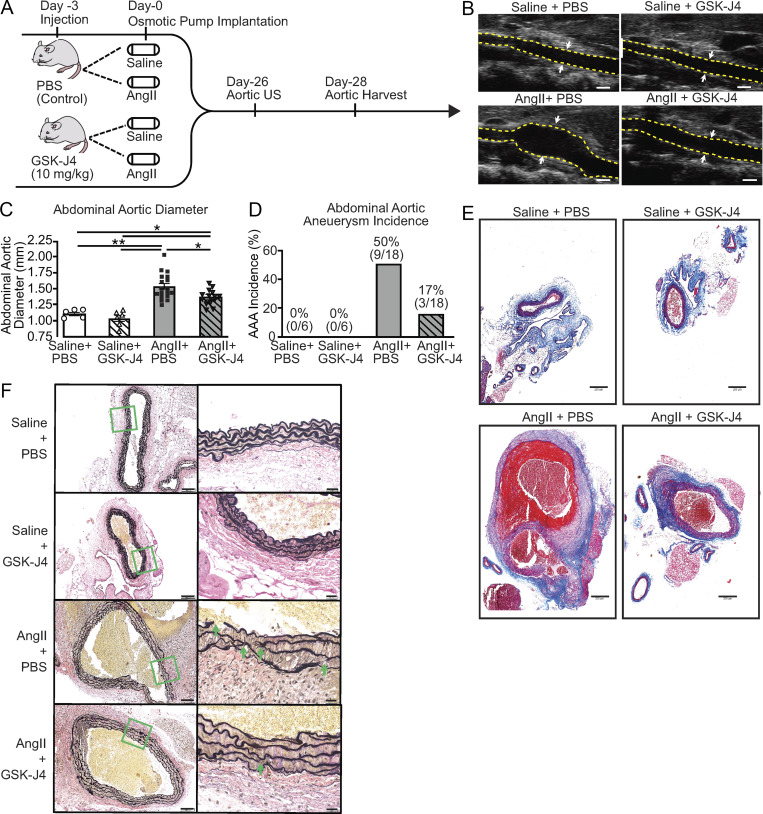
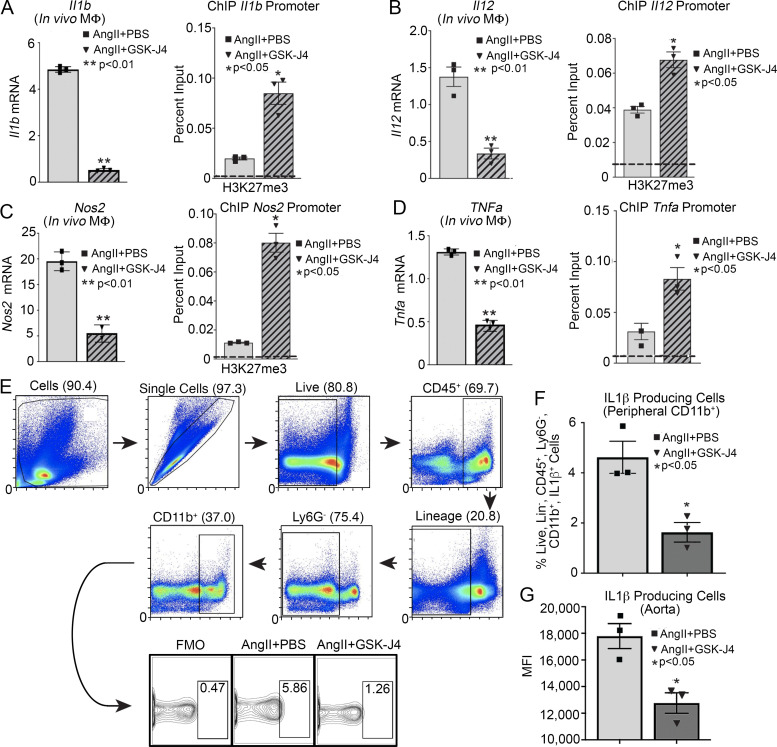
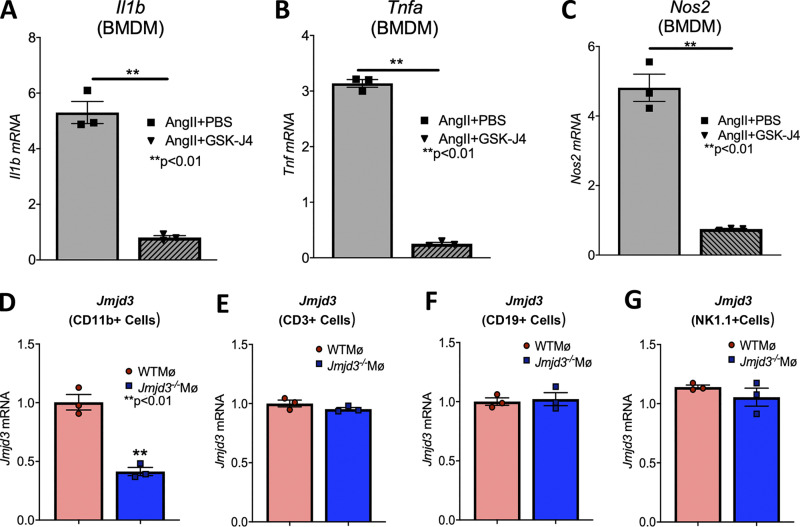
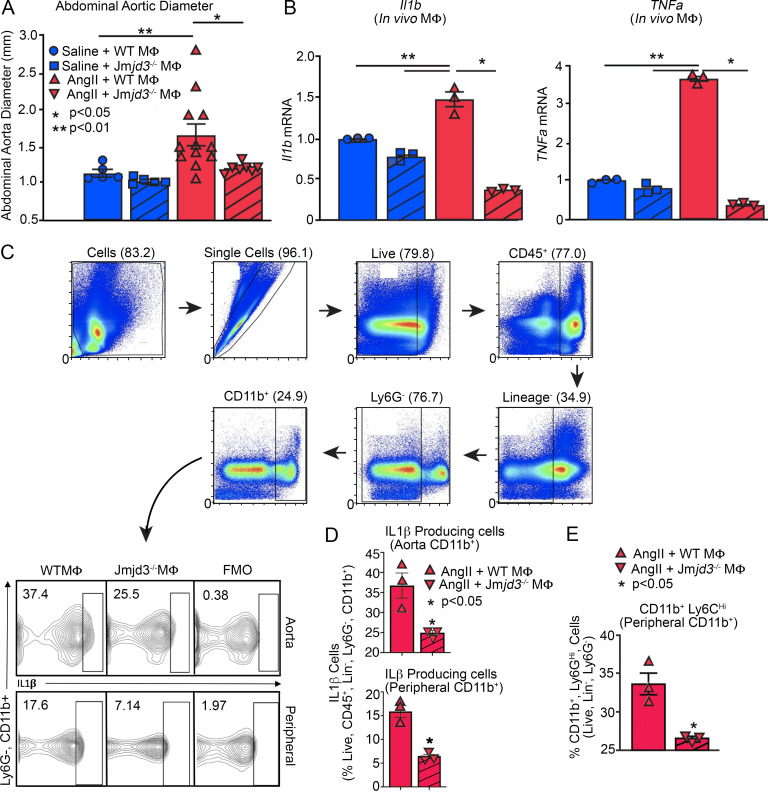
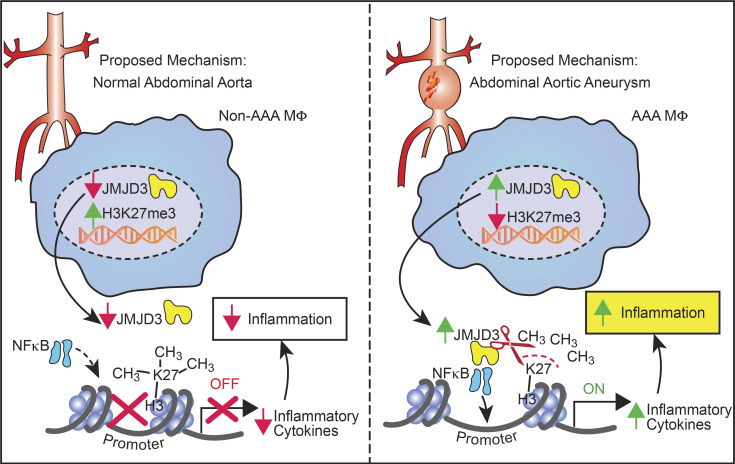
Abdominal aortic aneurysms (AAAs) are a life-threatening disease for which there is a lack of effective therapy preventing aortic rupture. During AAA formation, pathological vascular remodeling is driven by macrophage infiltration, and the mechanisms regulating macrophage-mediated inflammation remain undefined. Recent evidence suggests that an epigenetic enzyme, JMJD3, plays a critical role in establishing macrophage phenotype. Using single-cell RNA sequencing of human AAA tissues, we identified increased JMJD3 in aortic monocyte/macrophages resulting in up-regulation of an inflammatory immune response. Mechanistically, we report that interferon-β regulates Jmjd3 expression via JAK/STAT and that JMJD3 induces NF-κB-mediated inflammatory gene transcription in infiltrating aortic macrophages. In vivo targeted inhibition of JMJD3 with myeloid-specific genetic depletion (JMJD3f/fLyz2Cre+) or pharmacological inhibition in the elastase or angiotensin II-induced AAA model preserved the repressive H3K27me3 on inflammatory gene promoters and markedly reduced AAA expansion and attenuated macrophage-mediated inflammation. Together, our findings suggest that cell-specific pharmacologic therapy targeting JMJD3 may be an effective intervention for AAA expansion.


Conflict of interest statement

Disclosures: The authors declare no competing interests exist.

Figures

None
Graphical abstract
Figure 1.
Figure 1.
JMJD3 is increased in human and murine AAA tissues and reduces the repressive H3K27 trimethylation on NF-κB–mediated inflammatory cytokine promoters. (A–C) Aortic tissue from patients with AAA (n = 19) and atherosclerotic controls (n = 6) were collected. No statistical differences were found between groups with respect to sex, age, or comorbid conditions. JMJD3, Il1β, and TNFα gene expression was measured by quantitative PCR. *, P < 0.05, Welch’s t test replicated twice. (D) Immunofluorescence was performed on AAA and nonaneurysmal control tissue to analyze DAPI (blue), myeloid (green), and JMJD3 (red; n = 5 AAA and n = 3 controls with representative pictures shown). Representative images show 200× magnification, with scale bars representing 30 µm. (E–H) Male C57BL/6J mice were injected i.p. with an AAV containing mouse PCSK9D377Y and fed saturated fat diet for 6 wk. Mice were infused with saline or AngII (1,000 ng/min/kg) for 4 wk. Quantitative PCR analysis of Jmjd3, Il1b, Il12, and Tnfa isolated from aortas of mice exposed to saline or AngII for 28 d (n = 3/group run in triplicate). *, P < 0.05; **, P < 0.01, Welch’s t test. ChIP analysis for H3K27me3 at Il1b, Il12, and Tnfa promoter was performed (n = 3/group run in triplicate). For all ChIP experiments, isotype-matched IgG was run in parallel. Dotted line represents isotype control. *, P < 0.05 for Welch’s t test. Data are presented as the mean ± SEM.
Figure S1.
Figure S1.
JMJD3 is increased in human AAA tissues. (A) Immunofluorescence was performed on AAA and nonaneurysmal control tissue to analyze DAPI (blue), myeloid (green), and JMJD3 (red). Representative images show 200× magnification, and scale bars represent 30 µm. (B) Immunofluorescence with DAPI, JMJD3, myeloid, and isotype control. Representative images show 200× magnification, and scale bars represent 30 µm. (C) Male C57BL/6 mice were injected i.p. with an either a null AAV or AAV containing mouse PCSK9D377Y and fed Western diet for 6 wk. Following a high-fat diet period, the aortic tissue was isolated, and expression of Jmjd3, Il1b, Tnfa, and Il12 was measured in aortic tissue on day 28 following viral vector injection (n = 3–4 mice/group run in triplicate). Data are presented as the mean ± SEM.
Figure 2.
Figure 2.
Macrophages from AngII-induced AAA mice demonstrate increased Jmjd3 and decreased H3K27me3 at NF-κB binding sites on inflammatory gene promoters. (A–C) Jmjd3, Il1b, and Tnfa expression was measured by quantitative PCR in BMDMs isolated from either saline or AngII-infused mice on day 28 of infusion (n = 3/group run in triplicate). *, P < 0.05; **, P < 0.01 by Mann–Whitney U test. (D) Sequential ChIP was performed at the Il1b promoter on BMDMs treated for 6 h with IFNβ. DNA bound to Jmjd3 was isolated by ChIP, followed by a second immunoprecipitation with antibody to NF-κB or IgG (n = 6 mice/group run in triplicate). **, P < 0.01, Welch’s t test. (E–G) Il1b, Tnfa, and Il12 expression were measured by quantitative PCR in BMDMs isolated from either saline or AngII-infused mice administered with or without GSK-J4 (10 µM; JMJD3 inhibitor) for 6 h (n = 3/group run in triplicate). *, P < 0.05, ANOVA test with Dunnett multiple comparison. (H and I) Quantitative PCR analysis of Jmjd3and Il1b from macrophages (CD11b+[CD3CD19Nk1.1Ly6G]) in mice infused with either saline or Ang II for 28 d (n = 3–4/group run in triplicate). *, P < 0.05 for Mann–Whitney U test. ChIP analysis for H3K27me3 at Il1b promoter was performed (n = 3/group run in triplicate). For all ChIP experiments, isotype-matched IgG was run in parallel. Dotted line represents isotype-matched control. *, P < 0.05 by ANOVA test with Newman–Keuls multiple comparison test. (J) Quantitative PCR analysis of Jmjd3 from macrophages (CD11b+[CD3CD19Nk1.1Ly6G]) in control and elastase-treated mice (n = 3/group run in triplicate). *, P < 0.05, Mann–Whitney U test. (K) Quantitative PCR analysis of Jmjd3 was conducted in macrophages (CD11b+[CD3CD19Nk1.1Ly6G]) treated with IFNβ (100 U) for 24 h (n = 3 mice/group run in triplicate). (L) Quantitative PCR analysis of Jmjd3 was conducted in macrophages isolated from Ifnar−/− and littermate controls (Ifnar+/+) and treated with IFNβ (100 U) for 24 h (n = 3 mice/group run in triplicate). **, P < 0.01 for Mann–Whitney U test. (M) Jmjd3 expression in macrophages treated with IFNβ ± tofacitinib (JAK inhibitor; n = 3 mice/group run in triplicate). ****, P < 0.0001 for Mann–Whitney U test. (N) Quantitative PCR analysis of Jmjd3 was conducted in macrophages isolated from Stat1−/− and littermate controls (Stat1+/+) and treated with IFNβ (100 U) for 24 h (n = 3 mice/group run in triplicate). ***, P < 0.001 for Mann–Whitney U test. (O) Quantitative PCR analysis of Jmjd3 from macrophages (CD11b+[CD3CD19Nk1.1Ly6G]) in Ifnar+/+ and Ifnar−/− mice infused with either saline or Ang II for 28 d (n = 3 mice/group run in triplicated). **, P < 0.01 for Mann–Whitney U test. (P) Maximal abdominal aortic as determined by ultrasound in Ifnar+/+ and Ifnar−/− mice infused with either saline or AngII. *, P < 0.05 by ANOVA with Newman–Keuls multiple comparison test (n = 3–7/group). Data are presented as the mean ± SEM. MΦ, macrophage.
Figure S2.
Figure S2.
Inflammatory cytokines and murine elastase AAA model. (A) Quantitative PCR analysis of IL-23 from macrophages (CD11b+[CD3CD19Nk1.1Ly6G]) in mice infused with either saline or AngII for 28 d (n = 8–9 mice/group run in triplicate). *, P < 0.05 for Mann–Whitney U test. (B) ChIP analysis for H3K27me3 at Il23 promoter was performed (n = 5 mice/group run in triplicate). For all ChIP experiments, isotype-matched IgG was run in parallel. Dotted line represents isotype-matched control. *, P < 0.05 by ANOVA test with Newman–Keuls multiple comparison test. (C) Maximal infrarenal abdominal aortic diameter as determined by ultrasound in control and elastase-treated mice (n = 3–5 per group measured by two independent observers). *, P < 0.05; Mann–Whitney test. (D) Representative ultrasound images of the abdominal aorta at day 14 in control and elastase-treated mice. Dotted line represents aortic contour and arrows represent aortic wall diameter. Scale bar on the right side of image with each major axis representing 1 mm. (E) Quantitative PCR analysis of Il1b from macrophages (CD11b+[CD3CD19Nk1.1Ly6G]) in control or elastase mice (n = 3 mice/group). *, P < 0.05; Mann–Whitney test. (F) Fold change abdominal aortic diameter was determined by ex vivo measurement in Jmjd3−/−MΦ or WTMΦ mice treated with or without elastase (n = 3 in control cohorts and n = 4 in elastase cohorts). *, P < 0.05; **, P < 0.001 by ANOVA with Newman–Keuls multiple comparison test.
Figure S3.
Figure S3.
Genetic deficiency of IFN-α receptor prevents AngII-induced AAAs. (A) Representative ultrasound images of the abdominal aorta at day 28 in WT Ifnar+/+ and Ifnar−/− mice that received either saline or AngII infusion. Dotted line represents aortic contour and arrows represent aortic wall diameter. Scale bar on the right side of the image with each major axis represents 1 mm.
Figure 3.
Figure 3.
Human aortic single-cell transcription profiling reveals elevated JMJD3 and inflammatory pathway expression in infiltrating monocytes/macrophages. (A) Cluster analysis using the uniform manifold approximation and projection technique of single-cell sequencing from human AAA (n = 4) and nonaneurysmal (n = 2) samples revealed 21 distinct cell clusters (representative). Source data are provided as a source data file. (B and C) Gene Ontology biological pathway enrichment analysis of differentially expressed genes up-regulated (B) and down-regulated (C) in AAA samples. The combined score metric corresponds to the P value (two-tailed Fisher’s exact test) multiplied by the Z-score of the deviation from the expected rank, and q values determined by Benjamini–Hochberg correction. (D) Feature plots displaying the single-cell gene expression of JMJD3 across cell clusters. (E) Fold expression analysis of JMJD3+ vs. JMJD3 macrophages or monocytes (clusters 1–3) in AAA versus control tissue. (F) Focused Monocle pseudotime trajectory analysis including only the monocyte/macrophage defined clusters. Monocyte/macrophage clusters superimposed on pseudotime branches with gene expression plotted as a function of pseudotime. (G) Gene Ontology biological process, Reactome, or process enrichment analysis of differentially expressed genes JMJD3+ versus JMJD3 cells. The combined score metric corresponds to the P value (two-tailed Fisher’s exact test) multiplied by the Z-score of the deviation from the expected rank, and q values were determined by Benjamini–Hochberg correction. (H) Heatmap of differentially expressed genes in JMJD3+ versus JMJD3 macrophages from the cytokine-mediated signaling pathway.
Figure S4.
Figure S4.
Differential expressed gene heatmaps. (A–E) Heatmaps of differentially expressed genes in JMJD3 versus JMJD3+ macrophage/monocytes in human aortic tissue samples by scRNA-seq.
Figure 4.
Figure 4.
Pharmacological inhibition of JMJD3 via GSK-J4 prevents AAA formation. (A) Experimental design of JMJD3 inhibition (GSK-J4) in murine AAA model. WT mice were fed a high-fat diet for 6 wk and infused with saline or AngII (1,000 ng/min/kg) for 4 wk. During this period, mice were randomized to receive either PBS or GSK-J4 (10 mg/kg) injection thrice weekly. (B) Representative ultrasound images of the abdominal aorta at day 28 in WT mice that received either saline or AngII infusion with or without GSK-J4 treatment. Dotted line represents aortic contour, and arrows represent aortic wall diameter. Scale bar represents 1-mm distance. (C and D) Maximal abdominal aortic diameter and aneurysm incidence as determined by ultrasound measured by two observers in WT mice infused with either saline or AngII with or without GSK-J4 administration (n = 6 in saline-infused cohorts and 18 in AngII-infused cohorts). *, P < 0.05; **, P < 0.001, ANOVA with Newman–Keuls multiple comparison test. Data are presented as the mean ± SEM. (E and F) Representative Masson’s trichrome staining and Verhoeff–van Gieson elastin staining of abdominal aortic sections showing preserved aortic structure in AngII + GSK-J4 mice compared with AngII + PBS mice; scale bars represent 200 µm in Masson’s trichrome and 100 µm or 50 µm in Verhoeff–van Gieson stain; arrows represent elastin fragmentation.
Figure 5.
Figure 5.
Pharmacological inhibition of JMJD3 via GSK-J4 decreases macrophage inflammatory cytokine production. (A–D) Quantitative PCR analysis of Il1b, Il12, Nos2, and Tnfa mRNA from macrophages (CD11b+[CD3CD19Nk1.1Ly6G]) in mice exposed to saline + PBS, saline + GSK-J4, AngII + PBS, or AngII + GSK-J4 infusion for 28 d (n = 5 mice/group pooled and run in triplicate). ChIP analysis for H3K27me3 at Il1b, Il12, Nos2, and Tnfa promoter was performed (n = 5 mice/group pooled and run in triplicate). For all ChIP experiments, isotype-matched IgG was run in parallel. Dotted line represents isotype-matched control. *, P < 0.05; **, P < 0.01, ANOVA test with Newman–Keuls multiple comparison test. (E) Gating strategy to select single, live, lineage [CD3, CD19, NK1.1, Ter-119], Ly6G, CD11b+ by flow cytometry at day 28 peripheral blood and aortic tissue. (F and G) Percentage of CD11b+ cells staining positive for IL-1β in monocytes and aortic tissue macrophages (n = 6 mice/group pooled and run in triplicate). Tissues of two mice per mouse were pooled for a single biological replicate. *, P < 0.05, Welch’s t test. Data are presented as the mean ± SEM. FMO, fluorescence minus one; MΦ, macrophage.
Figure S5.
Figure S5.
JMJD3 inhibition reduced BMDM inflammatory cytokine expression. (A–C) Expression of Il1b, Tnfa, and Nos2 was measured in BMDMs isolated from mice undergoing AngII + PBS or AngII + GSK-J4 infusion for 28 d (n = 3–4 mice/group run in triplicate). *, P < 0.05; **, P < 0.01 by Mann–Whitney U test. Data are presented as the mean ± SEM. (D–G) Jmjd3 expression was measured by quantitative PCR in CD11b+[CD3CD19Ly6G], CD3+[CD11bCD19Ly6G], CD19+[CD3CD11bLy6G], or Nk1.1+[CD3CD11bCD19Ly6G] cells isolated from Jmjd3flox/floxLys2cre+/− (Jmjd3−/−MΦ) and Jmjd3flox/floxLys2cre−/− (WTMΦ) control mice. **, P < 0.01, t test. Data are presented as the mean ± SEM.
Figure 6.
Figure 6.
AAA formation is inhibited in macrophage-specific JMJD3-deficient mice. (A) Maximal abdominal aortic diameter was determined by ultrasound in Jmjd3−/−MΦ or WTMΦ mice infused with either saline or AngII (n = 5 in saline-infused cohorts and 7–10 in AngII-infused cohort). *, P < 0.05; **, P < 0.001, ANOVA with Newman–Keuls multiple comparison test. (B) Quantitative PCR analysis of Il1b and Tnfa from macrophages (CD11b+[CD3CD19Nk1.1Ly6G]; n = 3 mice/group run in triplicate). *, P < 0.05; **, P < 0.01, ANOVA test with Tukey's multiple comparison test. (C) Gating strategy to select single, live, lineage [CD3, CD19, NK1.1, Ter-119], Ly6G, CD11b+ by flow cytometry at day 28 peripheral blood monocytes and aortic tissue macrophages. (D) Percentage of CD11b+ cells from monocytes and aortic tissue macrophages immunostained positive for IL-1β in Jmjd3−/−MΦ or WTMΦ mice (n = 3/group run in triplicate). Tissues of two mice per mouse were pooled for a single biological replicate. *, P < 0.05 by Welch’s t test. (E) Percentage of CD11b+Ly6CHi cells in Jmjd3−/−MΦ or WTMΦ mice (n = 3 mice/group). *, P < 0.05 by Welch’s t test. Data are presented as the mean ± SEM. MΦ, macrophage.
Figure 7.
Figure 7.
Schematic of JMJD3-mediated regulation of macrophage inflammation during AAA development.

Comment in

  • Immune cells-A curse and a blessing!
    Mirakaj V. Mirakaj V. J Exp Med. 2021 Jun 7;218(6):e20210590. doi: 10.1084/jem.20210590. Epub 2021 May 21. J Exp Med. 2021. PMID: 34019638 Free PMC article.

Similar articles

Cited by

References

    1. Baxter, B.T., Terrin M.C., and Dalman R.L.. 2008. Medical management of small abdominal aortic aneurysms. Circulation. 117:1883–1889. 10.1161/CIRCULATIONAHA.107.735274 - DOI - PMC - PubMed
    1. Beischlag, T.V., Prefontaine G.G., and Hankinson O.. 2018. ChIP-re-ChIP: Co-occupancy Analysis by Sequential Chromatin Immunoprecipitation. Methods Mol. Biol. 1689:103–112. 10.1007/978-1-4939-7380-4_9 - DOI - PubMed
    1. Bosselut, R. 2016. Pleiotropic Functions of H3K27Me3 Demethylases in Immune Cell Differentiation. Trends Immunol. 37:102–113. 10.1016/j.it.2015.12.004 - DOI - PMC - PubMed
    1. Boytard, L., Spear R., Chinetti-Gbaguidi G., Acosta-Martin A.E., Vanhoutte J., Lamblin N., Staels B., Amouyel P., Haulon S., and Pinet F.. 2013. Role of proinflammatory CD68(+) mannose receptor(-) macrophages in peroxiredoxin-1 expression and in abdominal aortic aneurysms in humans. Arterioscler. Thromb. Vasc. Biol. 33:431–438. 10.1161/ATVBAHA.112.300663 - DOI - PubMed
    1. Butler, A., Hoffman P., Smibert P., Papalexi E., and Satija R.. 2018. Integrating single-cell transcriptomic data across different conditions, technologies, and species. Nat. Biotechnol. 36:411–420. 10.1038/nbt.4096 - DOI - PMC - PubMed

Publication types