

Development of a Machine Learning Model Using Electronic Health Record Data to Identify Antibiotic Use Among Hospitalized Patients
- PMID: 33779743
- PMCID: PMC8008288
- DOI: 10.1001/jamanetworkopen.2021.3460
Development of a Machine Learning Model Using Electronic Health Record Data to Identify Antibiotic Use Among Hospitalized Patients
Abstract
Importance: Comparisons of antimicrobial use among hospitals are difficult to interpret owing to variations in patient case mix. Risk-adjustment strategies incorporating larger numbers of variables haves been proposed as a method to improve comparisons for antimicrobial stewardship assessments.
Objective: To evaluate whether variables of varying complexity and feasibility of measurement, derived retrospectively from the electronic health records, accurately identify inpatient antimicrobial use.
Design, setting, and participants: Retrospective cohort study, using a 2-stage random forests machine learning modeling analysis of electronic health record data. Data were split into training and testing sets to measure model performance using area under the curve and absolute error. All adult and pediatric inpatient encounters from October 1, 2015, to September 30, 2017, at 2 community hospitals and 1 academic medical center in the Duke University Health System were analyzed. A total of 204 candidate variables were categorized into 4 tiers based on feasibility of measurement from the electronic health records.
Main outcomes and measures: Antimicrobial exposure was measured at the encounter level in 2 ways: binary (ever or never) and number of days of therapy. Analyses were stratified by age (pediatric or adult), unit type, and antibiotic group.
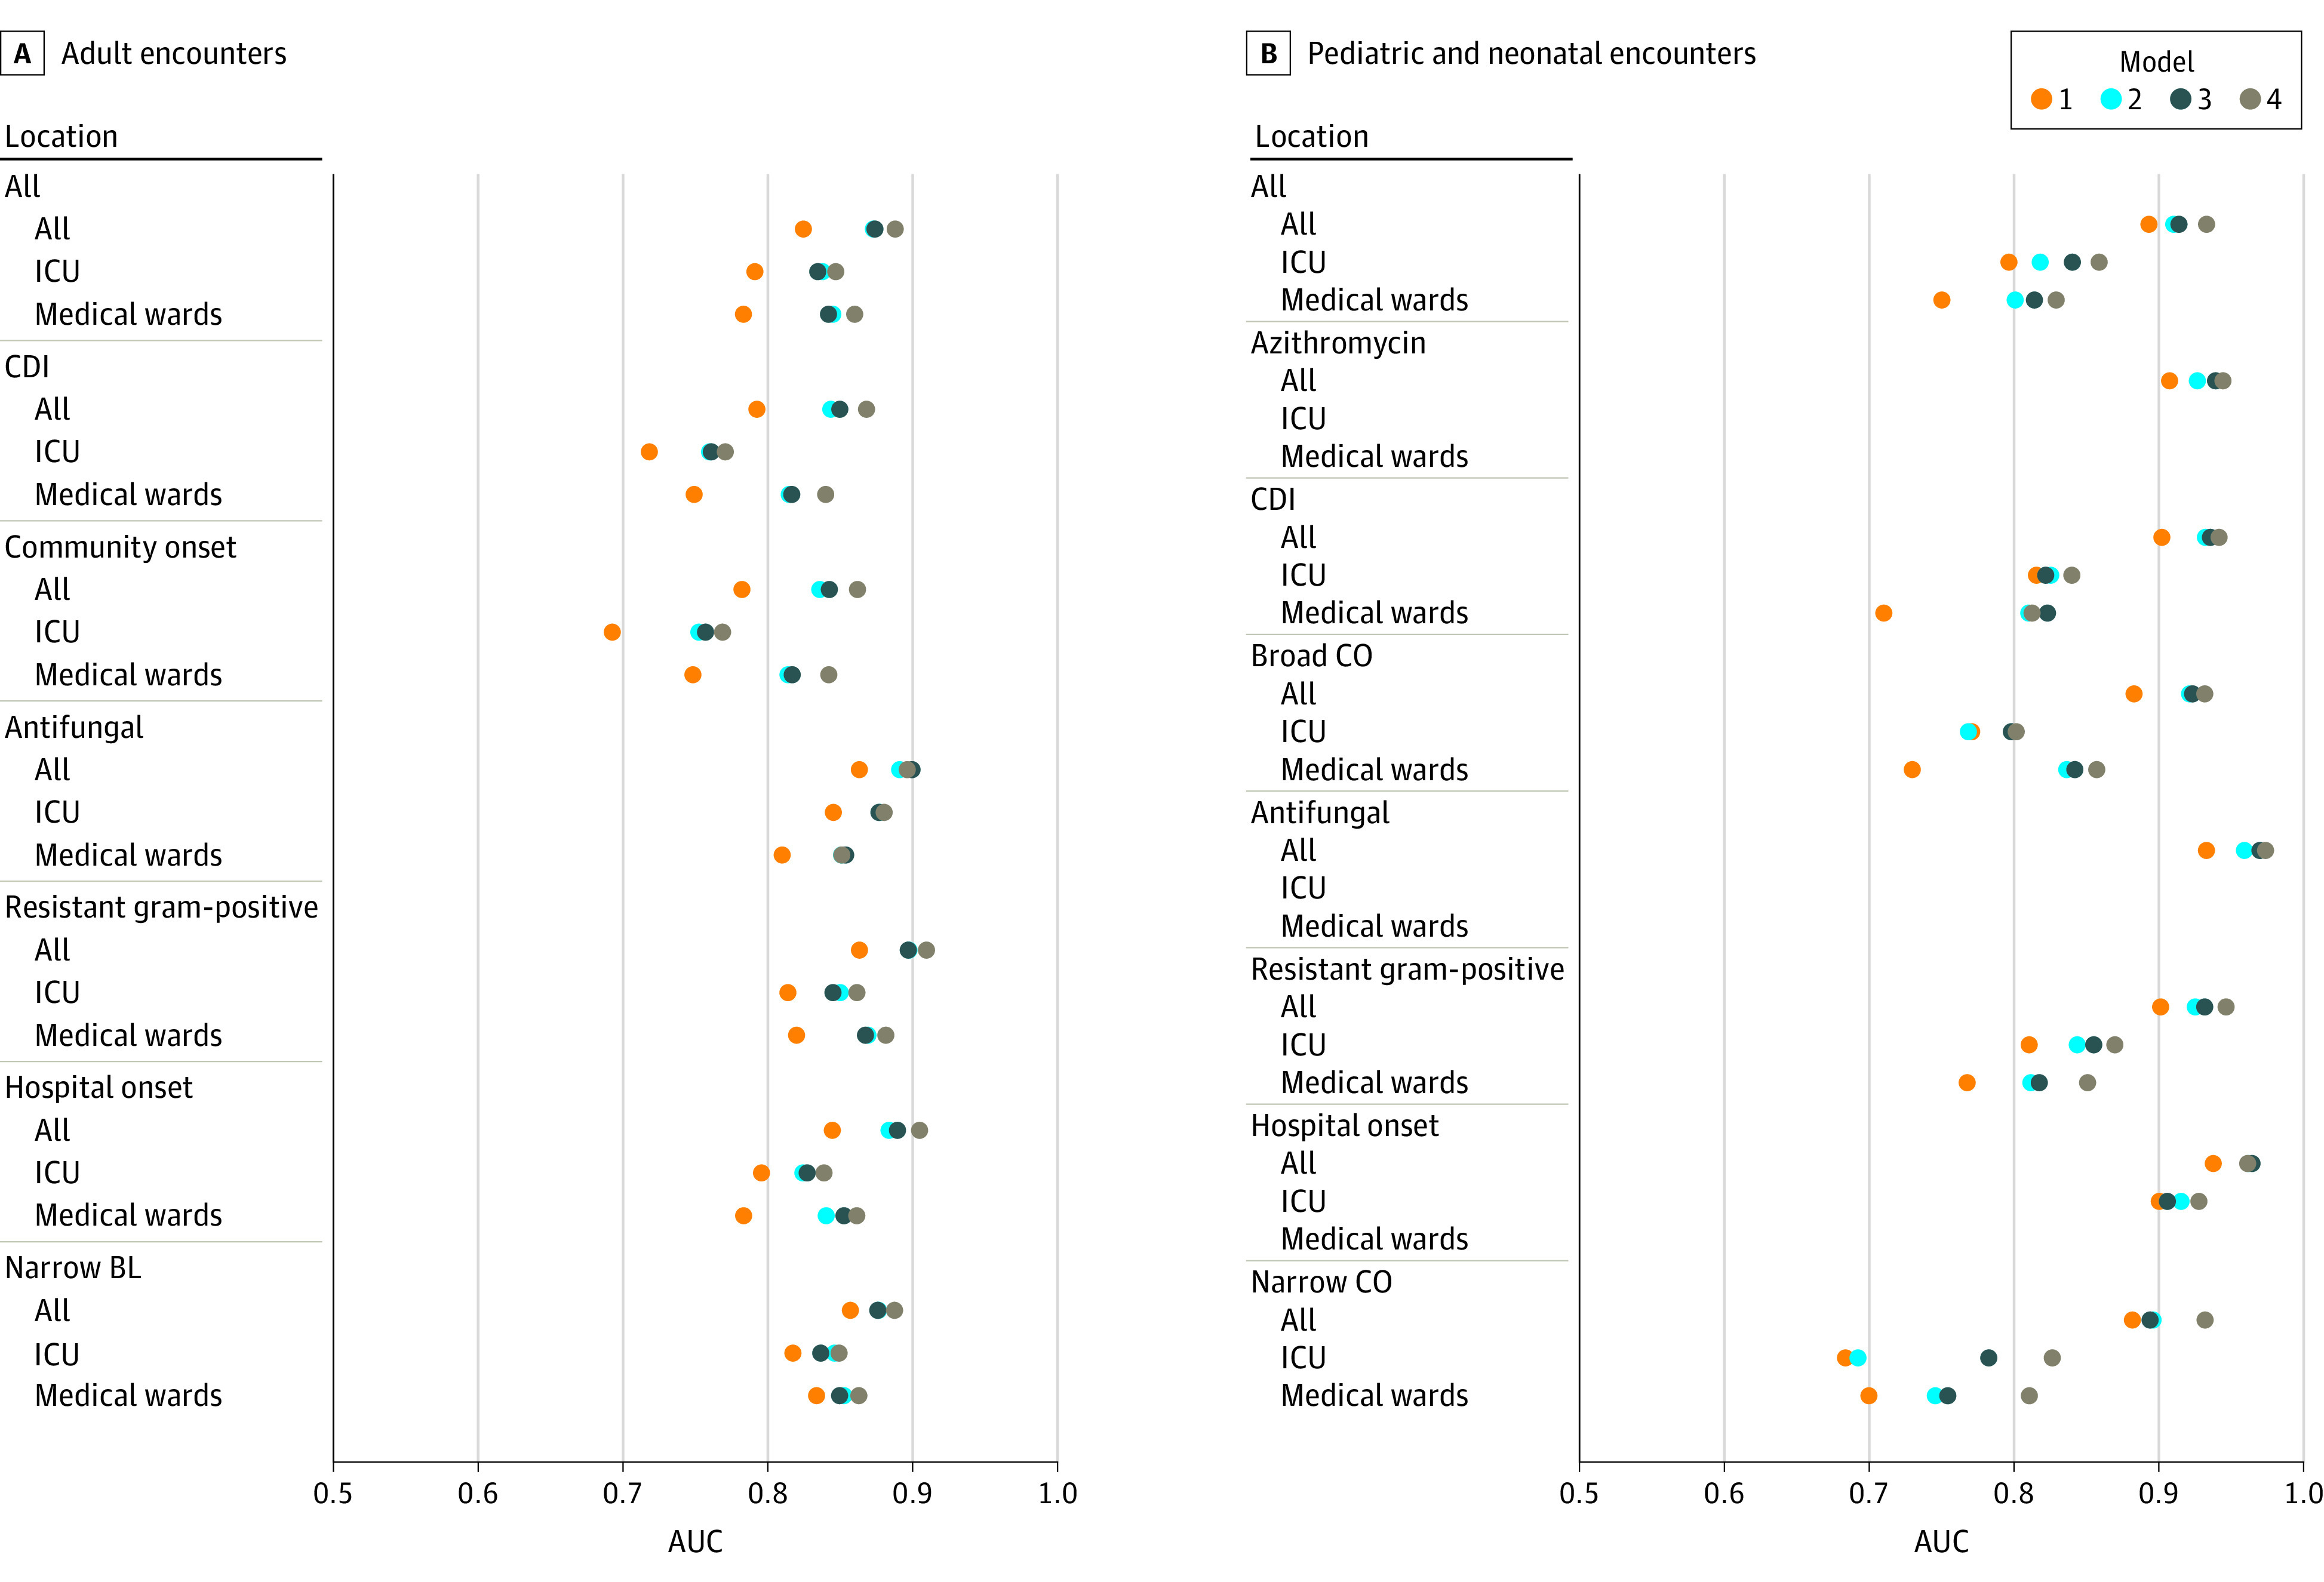
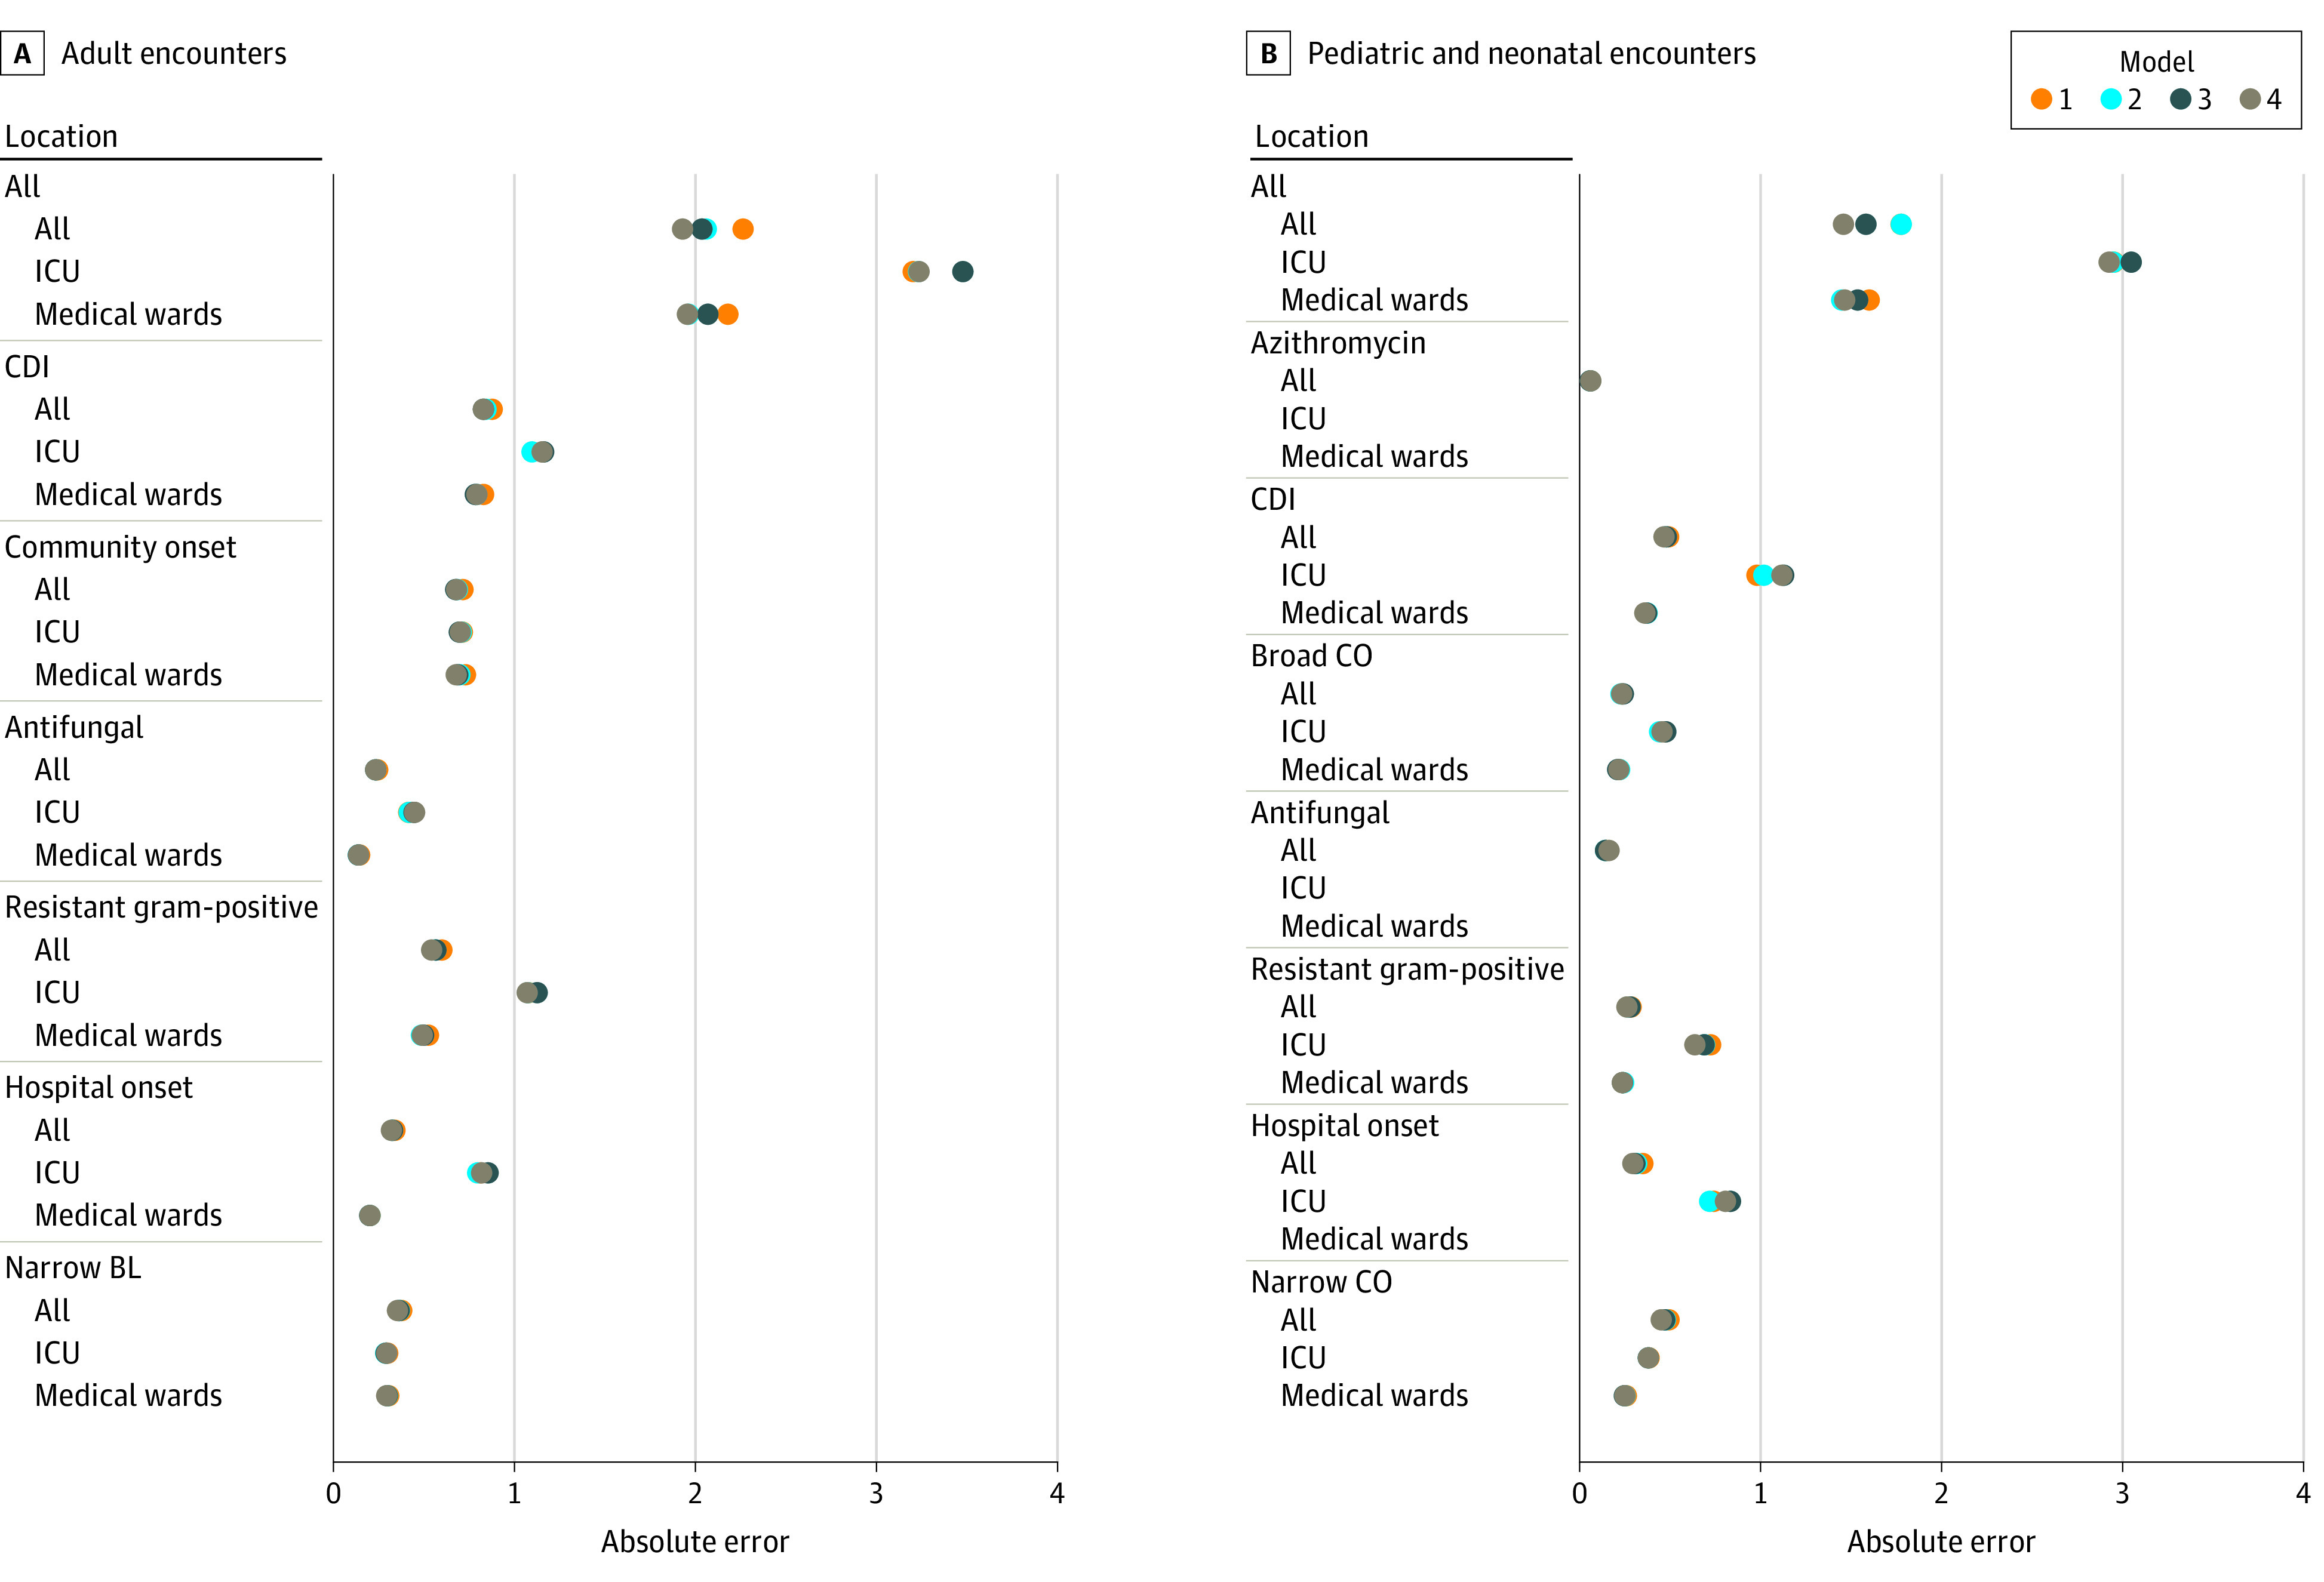
Results: The data set included 170 294 encounters and 204 candidate variables from 3 hospitals during the 3-year study period. Antimicrobial exposure occurred in 80 190 encounters (47%); 64 998 (38%) received 1 to 6 days of therapy, and 15 192 (9%) received 7 or more days of therapy. Two-stage models identified antimicrobial use with high fidelity (mean area under the curve, 0.85; mean absolute error, 1.0 days of therapy). Addition of more complex variables increased accuracy, with largest improvements occurring with inclusion of diagnosis information. Accuracy varied based on location and antibiotic group. Models underestimated the number of days of therapy of encounters with long lengths of stay.
Conclusions and relevance: Models using variables derived from electronic health records identified antimicrobial exposure accurately. Future risk-adjustment strategies incorporating encounter-level information may make comparisons of antimicrobial use more meaningful for hospital antimicrobial stewardship assessments.
Conflict of interest statement
Figures
Similar articles
-
Development and Validation of an Electronic Health Record-Based Machine Learning Model to Estimate Delirium Risk in Newly Hospitalized Patients Without Known Cognitive Impairment.JAMA Netw Open. 2018 Aug 3;1(4):e181018. doi: 10.1001/jamanetworkopen.2018.1018. JAMA Netw Open. 2018. PMID: 30646095 Free PMC article.
-
Predicting Intensive Care Unit Readmission with Machine Learning Using Electronic Health Record Data.Ann Am Thorac Soc. 2018 Jul;15(7):846-853. doi: 10.1513/AnnalsATS.201710-787OC. Ann Am Thorac Soc. 2018. PMID: 29787309 Free PMC article.
-
Assessment of the Appropriateness of Antimicrobial Use in US Hospitals.JAMA Netw Open. 2021 Mar 1;4(3):e212007. doi: 10.1001/jamanetworkopen.2021.2007. JAMA Netw Open. 2021. PMID: 33734417 Free PMC article.
-
The Current State and Future Directions of Inpatient Pediatric Antimicrobial Stewardship.Infect Dis Clin North Am. 2022 Mar;36(1):173-186. doi: 10.1016/j.idc.2021.12.001. Infect Dis Clin North Am. 2022. PMID: 35168709 Review.
-
Inpatient Antibiotic Stewardship Interventions in the Adult Oncology and Hematopoietic Stem Cell Transplant Population: A Review of the Literature.Ann Pharmacother. 2020 Jun;54(6):594-610. doi: 10.1177/1060028019890886. Epub 2019 Nov 26. Ann Pharmacother. 2020. PMID: 31771337 Review.
Cited by
-
Data harnessing to nurture the human mind for a tailored approach to the child.Pediatr Res. 2023 Jan;93(2):357-365. doi: 10.1038/s41390-022-02320-4. Epub 2022 Sep 30. Pediatr Res. 2023. PMID: 36180585 Review.
-
Brave New World of Artificial Intelligence: Its Use in Antimicrobial Stewardship-A Systematic Review.Antibiotics (Basel). 2024 Mar 28;13(4):307. doi: 10.3390/antibiotics13040307. Antibiotics (Basel). 2024. PMID: 38666983 Free PMC article. Review.
-
The Role of Artificial Intelligence and Machine Learning Models in Antimicrobial Stewardship in Public Health: A Narrative Review.Antibiotics (Basel). 2025 Jan 30;14(2):134. doi: 10.3390/antibiotics14020134. Antibiotics (Basel). 2025. PMID: 40001378 Free PMC article. Review.
-
Temporal Generalizability of Machine Learning Models for Predicting Postoperative Delirium Using Electronic Health Record Data: Model Development and Validation Study.JMIR Perioper Med. 2023 Oct 26;6:e50895. doi: 10.2196/50895. JMIR Perioper Med. 2023. PMID: 37883164 Free PMC article.
-
Antibiotic stewardship in the era of precision medicine.JAC Antimicrob Resist. 2022 Jun 21;4(3):dlac066. doi: 10.1093/jacamr/dlac066. eCollection 2022 Jun. JAC Antimicrob Resist. 2022. PMID: 35733911 Free PMC article. Review.
References
-
- Fridkin SK. Advancing metrics for benchmarking in stewardship research: is perfection our enemy? Paper presented at: SHEA Antimicrobial Stewardship Research Workshop; November 2016; San Diego, CA.
-
- van Santen KL. National Healthcare Safety Network (NHSN) Antimicrobial Use and Resistance (AUR) Options. Centers for Disease Control and Prevention. Accessed June 15, 2019. https://www.cdc.gov/nhsn/acute-care-hospital/aur/index.html
Publication types
MeSH terms
Substances
LinkOut - more resources
Full Text Sources
Other Literature Sources
Medical
