. 2021 Jun;141(6):881-899.
doi: 10.1007/s00401-021-02293-4. Epub 2021 Mar 29.

Meningeal inflammation in multiple sclerosis induces phenotypic changes in cortical microglia that differentially associate with neurodegeneration

Affiliations

Meningeal inflammation in multiple sclerosis induces phenotypic changes in cortical microglia that differentially associate with neurodegeneration

Lynn van Olst et al. Acta Neuropathol. 2021 Jun.

Abstract

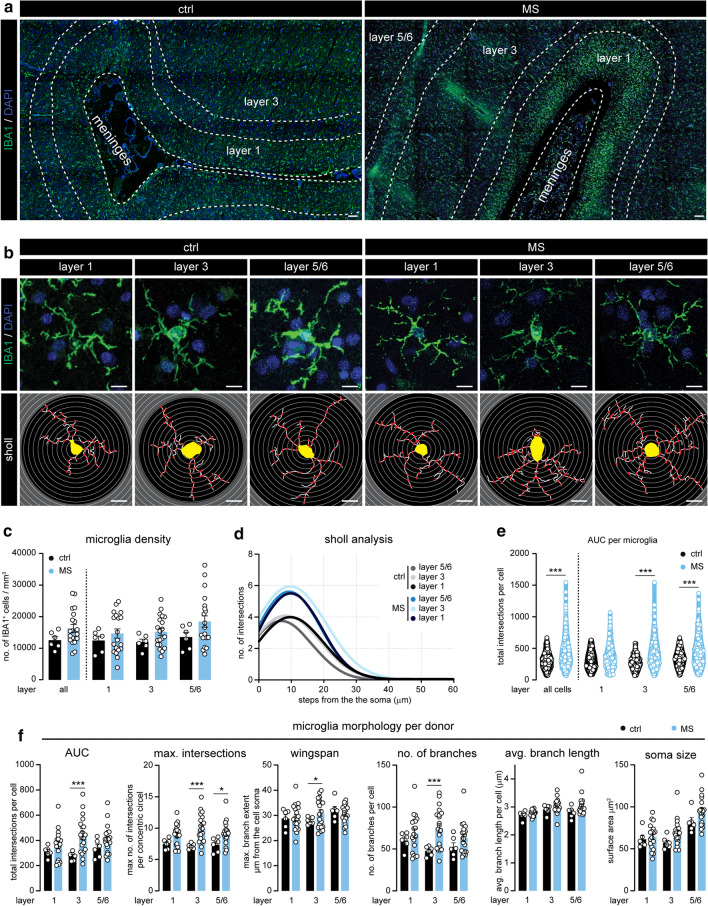
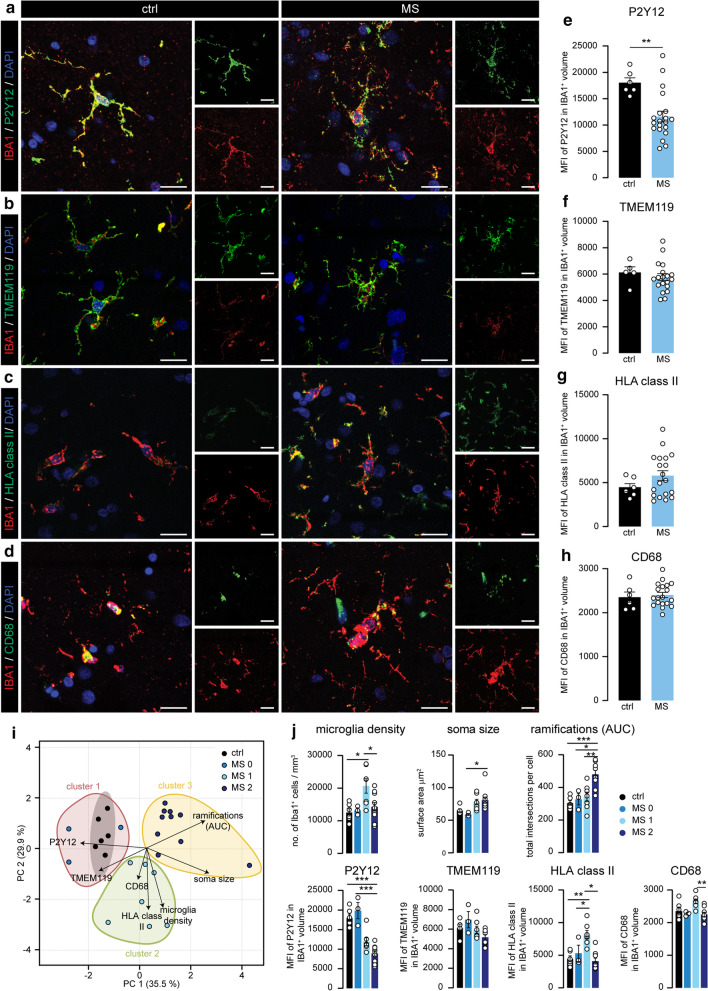
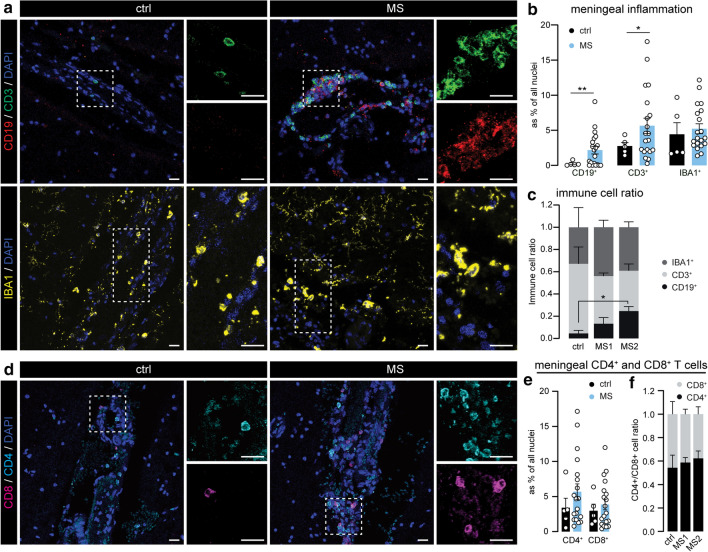
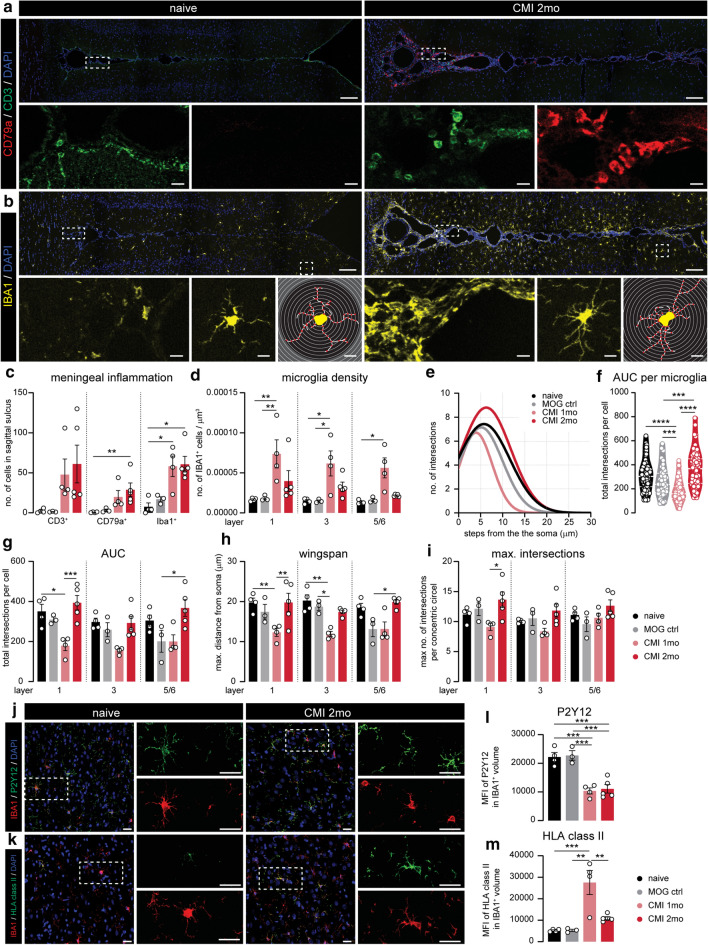
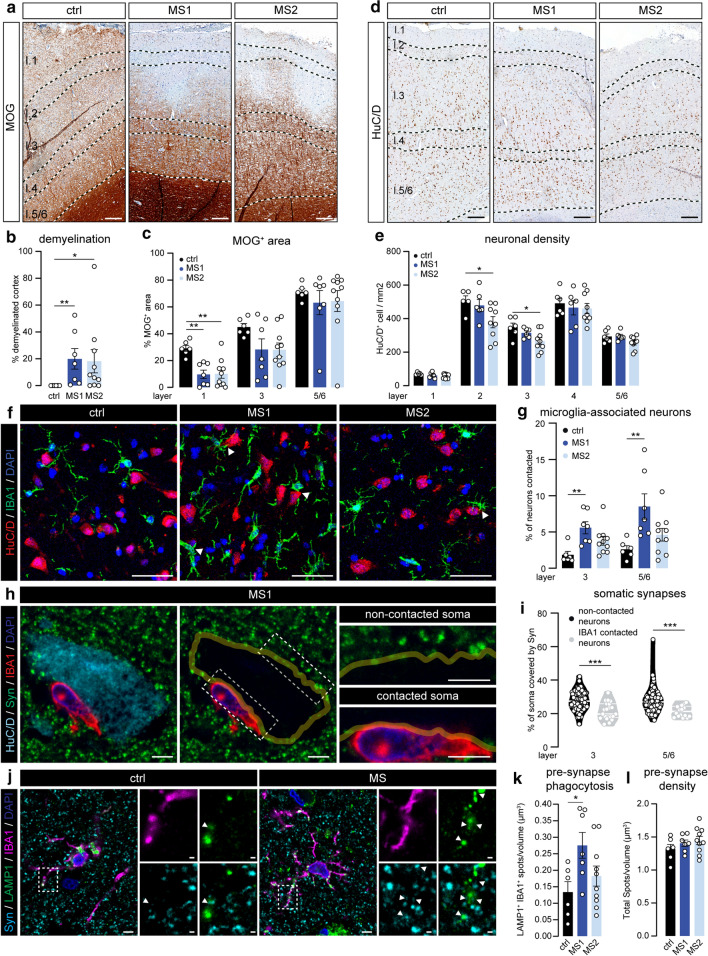
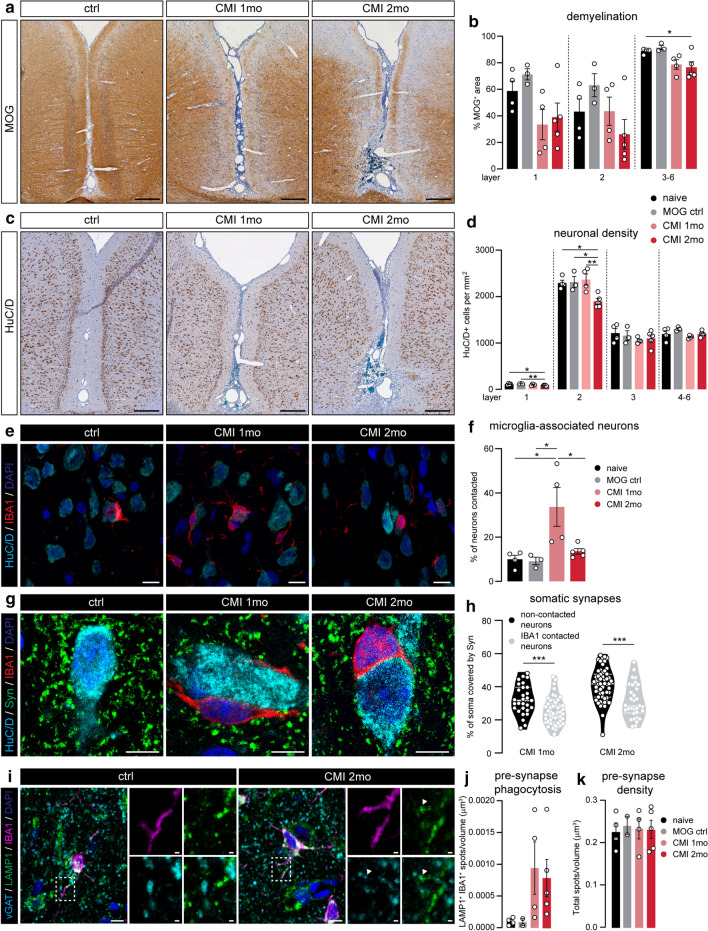
Meningeal inflammation strongly associates with demyelination and neuronal loss in the underlying cortex of progressive MS patients, thereby contributing significantly to clinical disability. However, the pathological mechanisms of meningeal inflammation-induced cortical pathology are still largely elusive. By extensive analysis of cortical microglia in post-mortem progressive MS tissue, we identified cortical areas with two MS-specific microglial populations, termed MS1 and MS2 cortex. The microglial population in MS1 cortex was characterized by a higher density and increased expression of the activation markers HLA class II and CD68, whereas microglia in MS2 cortex showed increased morphological complexity and loss of P2Y12 and TMEM119 expression. Interestingly, both populations associated with inflammation of the overlying meninges and were time-dependently replicated in an in vivo rat model for progressive MS-like chronic meningeal inflammation. In this recently developed animal model, cortical microglia at 1-month post-induction of experimental meningeal inflammation resembled microglia in MS1 cortex, and microglia at 2 months post-induction acquired a MS2-like phenotype. Furthermore, we observed that MS1 microglia in both MS cortex and the animal model were found closely apposing neuronal cell bodies and to mediate pre-synaptic displacement and phagocytosis, which coincided with a relative sparing of neurons. In contrast, microglia in MS2 cortex were not involved in these synaptic alterations, but instead associated with substantial neuronal loss. Taken together, our results show that in response to meningeal inflammation, microglia acquire two distinct phenotypes that differentially associate with neurodegeneration in the progressive MS cortex. Furthermore, our in vivo data suggests that microglia initially protect neurons from meningeal inflammation-induced cell death by removing pre-synapses from the neuronal soma, but eventually lose these protective properties contributing to neuronal loss.

Keywords: Cortical pathology; Meninges; Microglia; Multiple sclerosis; Neurodegeneration; Neuroinflammation.


Figures

Fig. 1
Fig. 1
Microglia morphology is altered in MS cortex. a Representative images displaying IBA1 expression in the cortex surrounding the sulcus of ctrl and MS subjects. b Micrographs of individual IBA1+ microglia in cortical layer 1, 3 and 5/6 (top panels) and their corresponding traced outlines (bottom panels). c Quantification of the microglial density per cortical layer, quantified as the number of IBA1+ cells per mm3. d Non-linear curve fit of the average number of microglial branch intersections per 0.3 µm step from the cell soma per cortical layer as measured by Sholl analysis. e Total Sholl-derived area under the curve (AUC) of individual microglia. f Quantification of different measurements (AUC, maximal number of intersections, wingspan, number of branches, average branch length, soma size) of microglial cell morphology averaged per donor. Individual datapoints indicate averaged data from an individual donor (c, f) or individual microglia (e), columns and error bars show mean ± SEM; *p < 0.05, **p < 0.01, *** p < 0.001; n = 6 ctrls, n = 20 MS subjects (c, d, f), n = 246 microglia in ctrls, n = 1014 microglia in MS (e); Scale bars = 10 µm (a), 100 µm (b)
Fig. 2
Fig. 2
Differential expression of microglial markers in MS cortex corresponds with morphological changes. ad Representative images displaying P2Y12 (a), TMEM119 (b), HLA class II (c) and CD68 (d) expression in IBA1+ microglia in cortical layer 3 of ctrl and MS donors. e–f. Quantification of the mean fluorescence intensity of P2Y12 (e), TMEM119 (f), HLA class II (g) and CD68 (h) in microglia. i. Scores for the first and second principle component (PC1/PC2) of ctrl and MS cases. Subjects are coloured according to their K-means cluster assignment. j Quantification of microglia density, microglia soma size, Sholl-derived area under the curve, mean fluorescence intensity of P2Y12, TMEM119, HLA class II and CD68 in IBA1+ volume in the different subgroups. Individual datapoints indicate averaged data from an individual donor, columns and error bars show mean ± SEM; *p < 0.05, **p < 0.01, ***p < 0.001; n = 6 ctrls, except in (f) where n = 5 ctrls, n = 20 MS subjects; Scale bars = 20 µm
Fig. 3
Fig. 3
MS2 microglia associate with meningeal B cells in progressive MS. a Representative images of the leptomeninges in ctrl and MS brains immunostained for CD3 (T cells), CD19 (B cells) and IBA1 (myeloid cells). b Quantification of CD19+, CD3+ and IBA1+ cells as percentage of all nuclei in the meninges. c Immune cell ratio of CD19+, CD3+ and IBA1+ cells in the meninges of ctrls, MS1 and MS2 clusters. d Representative images of CD8+ (pink) and CD4+ (cyan) T cells in meninges of ctrl and MS donors. e Quantification of CD4+ and CD8+ cells as percentage of all nuclei in the meninges. f CD4+/CD8+ immune cell ratio in the meninges of ctrls, MS1 and MS2 clusters. Individual datapoints indicate averaged data from an individual donor, columns and error bars show mean ± SEM; *p < 0.05, **p < 0.01; n = 5 ctrls and n = 20 MS subjects (b), n = 3 ctrls, n = 5 MS1 and n = 6 MS2 (c), n = 5 ctrls and n = 19 MS subjects (e), n = 4 ctrls, n = 7 MS1 and n = 9 MS2 (f); Scale bars = 20 µm
Fig. 4
Fig. 4
Experimental chronic meningeal inflammation induces similar microglial phenotypes as in MS cortex at different time points. a Representative image of CD3 (T cells) and CD79a (B cells) expression of the sagittal sulcus and surrounding cortex of naive and CMI 2 months animals. b Representative images of IBA1 expression in and around the sagittal sulcus of naïve and CMI 2 month rats (top panels). Higher magnification images of IBA1 expression inside the meninges (lower panel—left). Close-up of a single IBA1+ cell (lower panel—middle) and corresponding traced outline (lower panel—right). c Absolute number of CD3+ T cells, CD79a+ B cells and IBA1+ cells in the sagittal sulcus. d Microglial density per cortical layer, quantified as the number of IBA1+ cells per mm3 in the different animal groups e. Non-linear curve fit of the average number of microglial branch intersections per 0.3 µm step from the cell soma per cortical layer as measured by the Sholl analysis. f. Total Sholl-derived area under the curve (AUC) of individual microglia. gi Different measurements (AUC, wingspan, maximal number of intersections) of microglial cell morphology averaged per animal. j, k. Representative confocal images of cortical layer 3 from naïve and CMI 2 months displaying P2Y12 (j) or HLA class II (k) and IBA1 expression. i, m Mean fluorescence intensity of P2Y12 signal (i) and HLA class II (m) in IBA1+ volume. Individual datapoints indicate averaged data from an individual donor (ce, gi, l, m) or individual microglia (e), columns and error bars show mean ± SEM; *p < 0.05, **p < 0.01, ***p < 0.001; n = 4 naïve, n = 3 MOG ctrl, n = 4 CMI 1mo, n = 5 CMI 2 months (ce, gi, l, m), n = 112 naïve, n = 43 MOG ctrl, n = 173 CMI 1 month, n = 143 CMI 2 months (f); Scale bars = 100 µm (top panels of a, b), 10 µm (lower panels of a, b), 25 µm (j, k)
Fig. 5
Fig. 5
MS subgroups based on microglia phenotype reveal different levels of neuronal loss and pre-synaptic removal. a Representative images of MOG-stained cortex of ctrl, MS1 and MS2 subjects. b, c Percentage of total cortical demyelination (b) and MOG+ pixels (c) in cortical layers 1, 3 and 5/6 d. Representative images showing HuC/D-labelled neurons in the cortex of ctrl, MS1 and MS2 subjects. e Quantification of neuronal density in the different cortical layers. f Representative images of cortical layers 5/6 from a ctrl, MS1 and MS2 case double-labelled with IBA1 (microglia) and HuC/D (neurons). Arrow heads depict soma-soma contact between microglia and neurons. g Percentage of neuronal somata directly contacted by microglia in cortical layers 3 and 5/6. h Representative single z-plane of a cortical layer 3 neuron from an MS1 subject immunolabelled for HuC/D (neuronal soma), IBA1 (microglia) and Synaptophysin (pre-synapse) (left panel). Yellow line depicts the outline of the neuronal cell body (middle panel), highlighting the synaptic input on the soma. Right panels show close-ups of the areas outlined in the middle panel. i Quantification of the percentage of neuronal soma covered by Synaptophysin+ structures in microglia-contacted neurons and neurons not associated with microglia in the MS cortex (pooled data from 3 MS1, and 3 MS2 cases). j Representative images of cortical layer 3 from a ctrl and MS1 subject-stained for IBA1 (microglia), LAMP1 (lysosomes) and Synaptophysin (pre-synapses). k Number of Synaptophysin+ spots in microglial lysosomes per volume of cortical layer 3. l Total Synaptophysin+ spot density in cortical layer 3. Individual datapoints indicate averaged data from an individual donor (b, c, e, g, k, l), or individual neurons (i), columns and error bars show mean ± SEM; *p < 0.05, **p < 0.01, ***p < 0.001; n = 6 ctrls (b, c, e, g, k, l) except in layer 1 (c, e) and layer 2 (e) where n = 5 ctrls, n = 7 MS1 and n = 10 MS2 (b, c, g, k, l), n = 6 MS1 and n = 9 MS2 (e), n = 110 layer 3 and n = 102 layer 5/6 neurons (i); Scale bars = 250 µm (a, d), 50 µm (f), 10 µm (h, j)
Fig. 6
Fig. 6
Experimentally induced chronic meningeal inflammation recapitulates cortical pathology in the MS cortex. a Representative images of MOG-stained cortex around the sagittal sulcus of naive, CMI 1 month and CMI 2 months animals. b Quantification of the percentage of MOG+ pixels in cortical layers 1, 2 and 3–6 surrounding the sagittal sulcus in the four groups of rats. c Representative images showing HuC/D+ neurons in the cortex of naive, CMI 1 month and CMI 2 months animals. d Quantification of neuronal density in the different cortical layers. e Representative maximum projection confocal images of cortical layer 3 from naive, CMI 1 month and CMI 2 months animals double-labelled with IBA1 (microglia) and HuC/D (neurons). f Quantification of the percentage of neuronal somata directly in contact with microglia soma in cortical layer 3. g Representative single z-plane confocal images of cortical layer 3 of naive, CMI 1 month and CMI 2 months animals immunolabelled for HuC/D (neuronal somata), IBA1 (microglia) and Synaptophysin (pre-synapses). h Quantification of the percentage of neuronal soma covered by Synaptophysin-labelled structures in microglia-contacted neurons and neurons not associated with microglia in CMI animals (pooled data from 3 animals in each group). i Representative images of IBA1 (microglia), LAMP1 (lysosomes) and vGAT (pre-synapses) expression in cortical layer 3 of a naive and CMI 2 months animal. j Quantification of the density of vGAT+ spots in microglial lysosomes of cortical layer 3. k Total density of vGAT spots in layer 3 of the cortex. Individual datapoints indicate averaged data from an individual animal (b, d, f, h, j, k), or individual neurons (h), columns and error bars show mean ± SEM; *p < 0.05, **p < 0.01, *** p < 0.001; n = 4 naïve, n = 3 MOG ctrl, n = 4 CMI 1 month, n = 5 CMI 2 months (b, d, f, h, j, k) with the exception of n = 2 MOG ctrl in (j, k), n = 80 CMI 1mo and n = 88 CMI 2 months neurons (h). Scale bars = 250 µm (a, c), 10 µm (e, g)

Comment in

Similar articles

Cited by

References

    1. Arganda-Carreras I, Fernández-González R, Muñoz-Barrutia A, Ortiz-De-Solorzano C. 3D reconstruction of histological sections: Application to mammary gland tissue. Microsc Res Tech. 2010;73:1019–1029. doi: 10.1002/jemt.20829. - DOI - PubMed
    1. Bankhead P, Loughrey MB, Fernández JA, Dombrowski Y, McArt DG, Dunne PD, et al. QuPath: Open source software for digital pathology image analysis. Sci Rep. 2017 doi: 10.1038/s41598-017-17204-5. - DOI - PMC - PubMed
    1. Bell L, Lenhart A, Rosenwald A, Monoranu CM, Berberich-Siebelt F. Lymphoid aggregates in the CNS of progressive multiple sclerosis patients lack regulatory T cells. Front Immunol. 2020;10:1–18. doi: 10.3389/fimmu.2019.03090. - DOI - PMC - PubMed
    1. Butovsky O, Weiner HL. Microglial signatures and their role in health and disease. Nat Rev Neurosci. 2018 doi: 10.1038/s41583-018-0057-5. - DOI - PMC - PubMed
    1. Calabrese M, Magliozzi R, Ciccarelli O, Geurts JJG, Reynolds R, Martin R. Exploring the origins of grey matter damage in multiple sclerosis. Nat Rev Neurosci. 2015;16:147–158. doi: 10.1038/nrn3900. - DOI - PubMed

Publication types

MeSH terms